By Eric Lindstrom
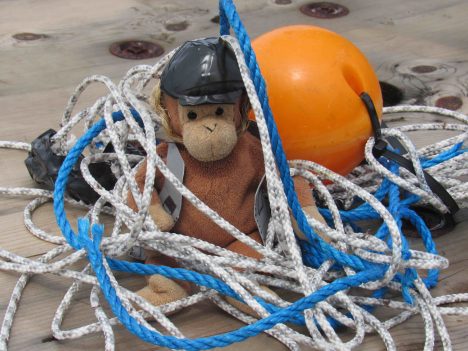
Monkey makes its own mess!
Long ago on a planet very similar to our own, oceanography was done without the Internet or regular communication with shore. It required careful planning and forecasts of the conditions to be encountered were vague at best. Executing the original plan of work for a voyage was always a good objective.
Unlike those days on that planet, the shipboard work of SPURS-2 seeks to optimize our operation as we go by depending on a “dry team” ashore for a daily flow of information. The information comes from a number of sources including satellites, in situ data (data collected in place), models, and combinations of these sources. The daily flow of information comes to us via the Internet in a “tarball.” In computing, tar is a computer software utility (originating from Tape ARchive) for collecting many files into one archive file, often referred to as a tarball. Scientists on R/V Revelle receive the daily tarball assembled by our dry team at the NASA Jet Propulsion Laboratory (in association with many SPURS-2 scientists ashore). The tarball contains files for daily weather and oceanographic analysis and a wealth of ancillary information. The tarball is information desired by the team aboard the ship, a key point that should not be overlooked in the following discourse.
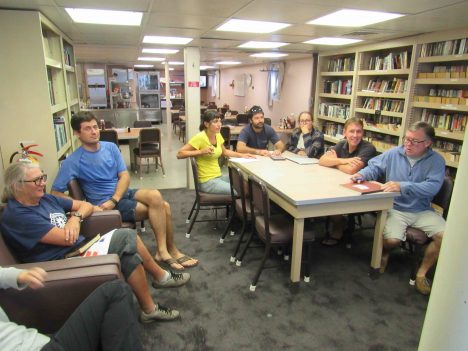
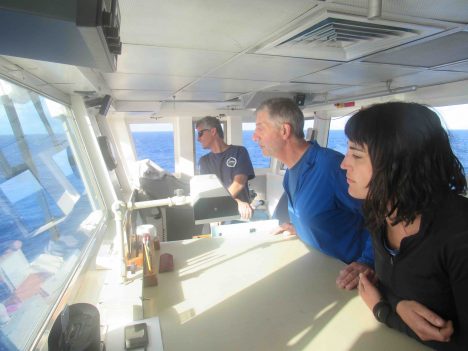
SPURS-2 planning is a daily occurrence in the R/V Revelle library. From left to right: Janet Spintall, Denis Volkov, Kyla Drushka, Ben Hodges, Audry Hasson, Julian Schanze and Jim Edson.
Well, you can see where I am going with this: a tarball is also a blob of petroleum that has been weathered after floating in the ocean, sticky marine debris from the age of oil spills. With all due respect to the efforts of the dry team, commonality of the computing and oil tarball terminology becomes all too clear when one tries to reconcile the complex flows of data from both the tarball and the vast array of instruments on the ship. The tangle of seemingly conflicting information can make you feel like you are dealing with a tarball of the sticky black variety!
The tarball does focus our attention by feeding back to us our own observations. After R/V Revelle has deployed moorings, drifters, and floats we might receive back meteorological data from the central WHOI mooring, profiles from the NOAA moorings, trajectories of surface drifters, and profiles from the Argo floats. This real information may or may not conflict with what we imagined we would see (and built our plans around). So, this tarball pushes us into consideration of whether our plans going forward need revision or remain sound.
For example, the tarball is always an implicit invitation to re-consider the planned work to take account of current or forecast conditions. Ostensibly this information enables us to make the most of our valuable ship time. However, having a constantly evolving plan of action is rough on people and their routines. Plans tend to lose their certainty.
Of course, proposals are funded and years of work are banking on our executing a planned set of measurements. However, the decisions are difficult, if we planned to collect seven days of Surface Salinity Profiler data in rainy conditions and our planned operations turn out to be south of the actual rains for the previous two weeks, do we change our plans? Or, will Mother Nature bring rain to us in the coming weeks if we simply execute the plan with which we came to sea? The tarball gives us some weather projections, satellite rain rate and cloud maps, as well as current and salinity patterns in the ocean and model forecasts to help with the decision-making. Unfortunately what seems clear and useful to those at desks thousands of miles away, can be less than clear and ultimately confusing when working on an isolated patch of ocean far from regular observation. The effort to make good use and sense of the tarball is one of the additional challenges facing modern oceanography.
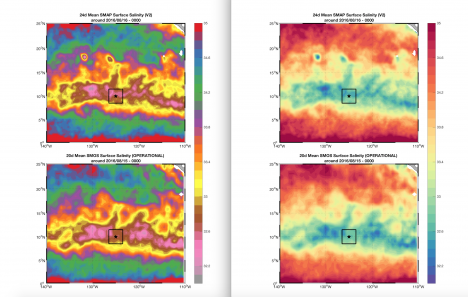
Two-panel plots of satellite salinity from the SMOS and SMAP missions. The only difference is the color scale; it is kind of a Rorschach test for oceanographers. Do you see fronts in one and not the other? Well, they are the same! What you see and interpret can be biased by how you present the information. That is another sticky mess in the tarball.
Before the tarball, seagoing oceangraphy was simpler (and more dangerous) and plans were simply to be executed. With the tarball, science is safer and more nimble and plans are malleable. I think that for us, older humans, the modern way with the tarball is more stressful. Or maybe, if you came of age with the Internet, life without the tarball is unimaginably silly and stupid. For a young oceanographer the science IS the sticky mess inside the tarball!
Whatever the reality, our information age has made a day at sea a challenge in environmental analysis. No more hoping, imagining, or guessing – it is all in the tarball if only you can figure it out!
By Eric Lindstrom
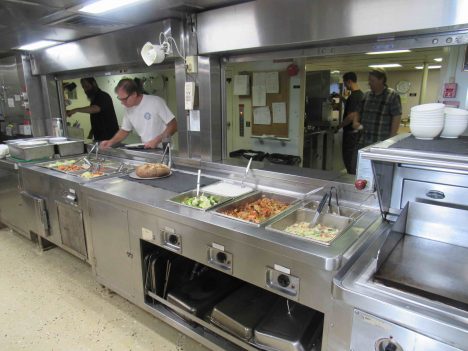
Food service on the R/V Revelle.
Food aboard the R/V Revelle is a cornerstone of happiness and good morale. Jay Erickson and Richard Buck are the cooks during this voyage and have many years of experience working together on R/V Revelle. I followed their daily routine all day on Friday, September 2, so that I can give you some beyond-consumer incite about food on the R/V Revelle. I will stipulate that their work is very good indeed and that we have been getting well fed. Since scales don’t work at sea, no weight gain can be observed. So says the fat blogger.
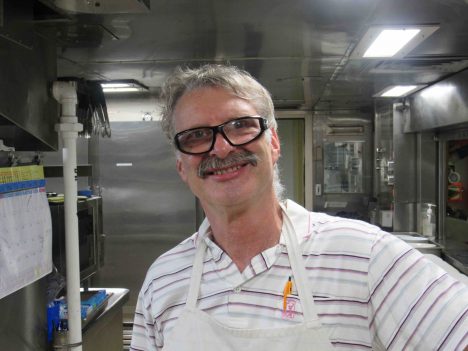
Jay Erickson, Chief Cook on the R/V Revelle.
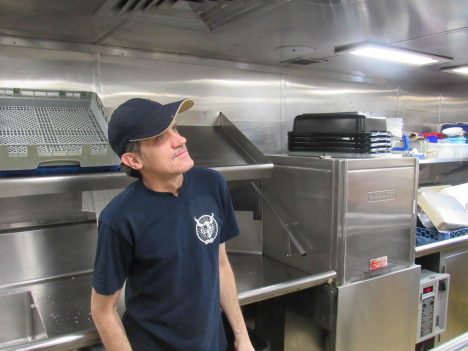
Richard Buck, Cook, R/V Revelle.
I think it is best to describe this important aspect of life on R/V Revelle in two ways. First is the routine that makes food service run like clockwork every day. Second are the secrets or magic of shipboard food service that those on land might find curious or amazing. I can touch on only a few highlights.
I’ll start with the clockwork routine. Richard and Jay alternate work assignments. Each day one them does the hot food preparation and other has salad/cold food preparation, cleaning/dishwashing, and supply runs to the stores (three decks down). The next day they switch. The key menu options for hot food are generally decided on the prior evening. Only one day has a predictable menu – Sunday is steak day! Jay and Richard’s workdays are over 12 hours long with two short breaks. That is a heavy, relentless duty.
Breakfast preparation starts at 6:00 am. Breakfast food options are those of a typical American diner (e.g., eggs several ways, several meats, potato, pancakes, oatmeal, cereal, fresh fruit), without the short orders, and do not vary substantially from day to day. Most people do not vary in their breakfast food choices so I’d characterize it as the constant, dependable meal (least challenging for the cooks).
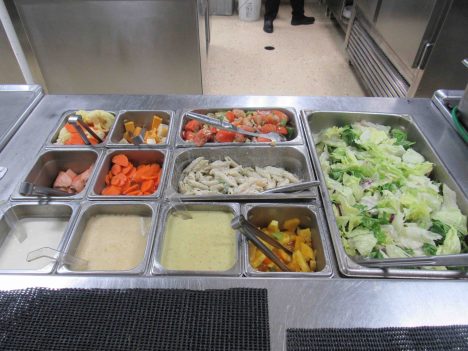
Salad bar at every meal.
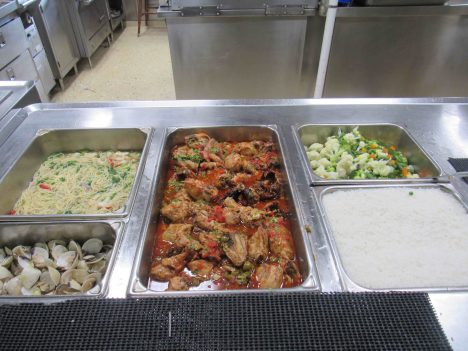
Hot meal of Balboa chicken and shrimp noodle soup.
After a short break from about 8:30 to 9:00 am, lunch preparation begins with galley and dining room cleaning. Typical lunch and dinner menus include a featured main course, a couple of side dishes, a vegetarian option, and a soup. After lunch cleanup there is another break in the action from around 1:30 to 2:30 pm. Some preparation for dinner will have been started during the lunch service.
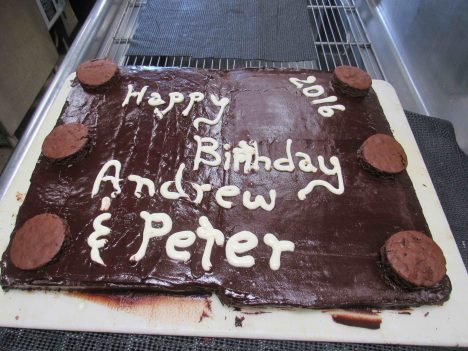
Birthday cake for Andrew and Peter.
Dinner preparation includes renewal and refreshment of the salad bar, bread baking, and work on the main meal from soup to nuts, as they say. Every day there are some extras or special events as well. On my day in the kitchen there were two birthdays, so a decorated birthday cake was prepared over the course of the day. Likewise, fresh bread, cookies, or a special dessert might be created for the dinner service.
As I learned over the course of the day, the vast share of labor goes into food preparation and cleanliness. The R/V Revelle professional facilities allow for the rapid and efficient cooking of food for 50-60 people. However, the washing and chopping of large quantities of fruit and vegetables, and meat handling are labor intensive. So too are the good habits of kitchen hygiene that assure that everything is done right and sparkling clean at all times. As you might expect, the work is hard enough without everything being shipshape and well organized. Fastidiousness was a hallmark of Jay and Richard’s work.
There are many challenges to creation of good meals at sea. Obviously motion of the ship can be a big issue. A ship’s cook is a cook who has mastered the art of corralling sloshing food! Richard told me of attempts to bake a level cake in the seas of the Southern Ocean. Rather than having it baked into the leaning cake of Pisa, he tried to balance the sea motion by turning the cake in the oven every few minutes to counter the sloshing of the batter. In that case, the ocean won…but I think the birthday recipient appreciated the effort nonetheless.
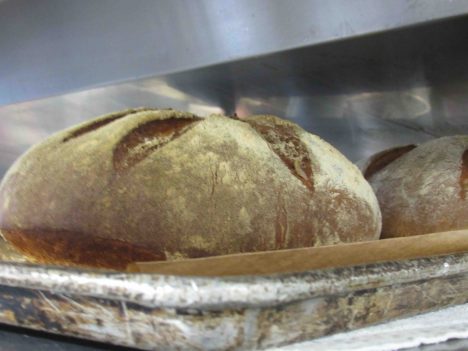
Fresh bread just out of the oven.
Jay shared an interesting secret of leftovers. Oatmeal is available for breakfast every day. Leftover oatmeal is mixed with water and yeast after breakfast and the slurry left to ferment. It is transformed by this effort of the microbes and a resourceful cook into the delicious bread at dinner!
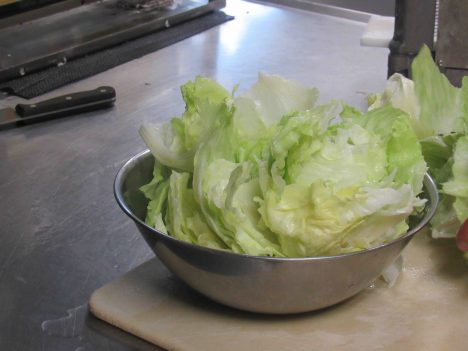
Let us admire a three-week-old lettuce, looking like it was fresh.
A great deal of science and experience goes into the food storage on a ship. Three weeks at sea and we still have lettuce and perfect avocados. That never happens for me at home! While each fruit and vegetable seems to have its own story with regard to ripeness at purchase, storage, and revitalization, the keys to longevity seem to be in the cold room temperature and humidity plus the skills of Jay and Richard to give foods a second chance. Lettuce, for example, might look finished due to a dehydrating stay in the cold storage, but skilled knife work, a cold bath, and a little secret chemistry can return lettuce to salad fitness!
We are all in debt to the skill and labor of Richard and Jay. We will feel the full extent of the deliciousness they loaned to us when we climb on the scale back home!
By Eric Lindstrom
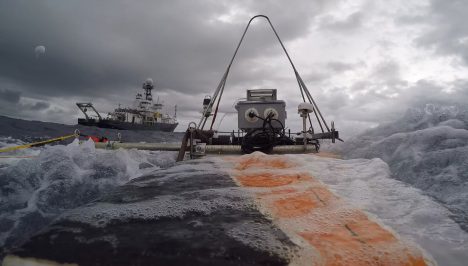
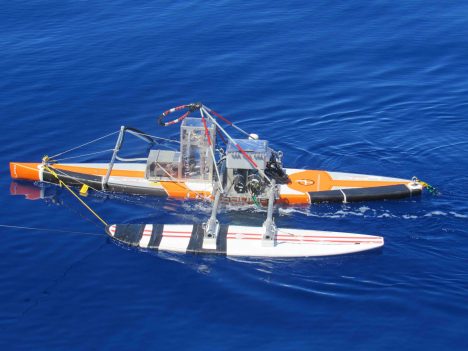
The R/V Revelle and the Lighter-Than-Air InfraRed System (on the left corner), as seen from the Surface Salinity Profiler. Credit: Dan Clark.
Kyla Drushka from University of Washington Applied Physics Laboratory (APL) received a National Science Foundation grant to participate in SPURS-2. It is one cornerstone of our work and is entitled “Rain-Formed Fresh Lenses in SPURS-2.” The idea of rainfall resulting in freshwater puddles or lenses at the sea surface is (perhaps) easy to imagine but is very tricky to observe and study in the real world. SPURS-2 will provide a wealth of new data on this subject with which to test the fidelity of our scientific imagination.
A beauty shot of the Surface Salinity Profiler.
Kyla and the APL crew have a variety of instruments aboard R/V Revelle but the Surface Salinity Profiler (SSP) is central to SPURS-2 science objectives. When you want to know the fate of rainwater after it hits the sea surface, measuring salinity (or equivalently the amount of freshwater) in the upper meter of the ocean is crucial. The profile of salinity in that top meter of the ocean is elusive for a number of reasons – technical and logistical. Technically, salinity sensors require some time and bubble-free water flow to make the measurement. However, normally the sea surface is rapidly moving up and down (because of waves!) so a sensor is not always in the water and away from bubbles until it is several meters below the surface. Finding a way to tow salinity (and other) sensors at fixed, shallow depths following the motions of the sea is another approach. APL scientists and engineers including Andy Jessup, Bill Asher, and Dan Clark designed the SSP to apply this approach.
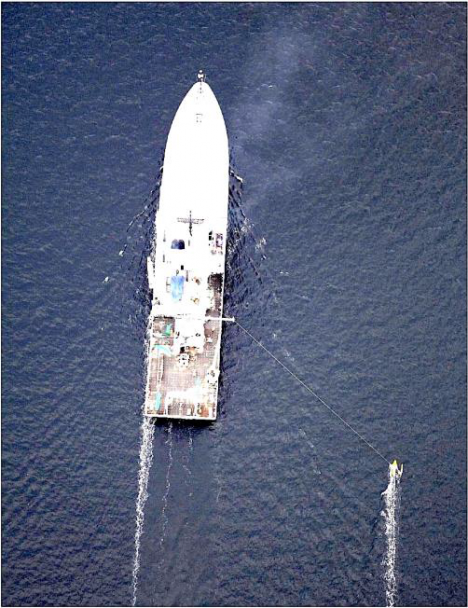
How the Surface Salinity Profiler runs outboard the ship — photo taken from the Lighter-Than-Air InfraRed System balloon camera.
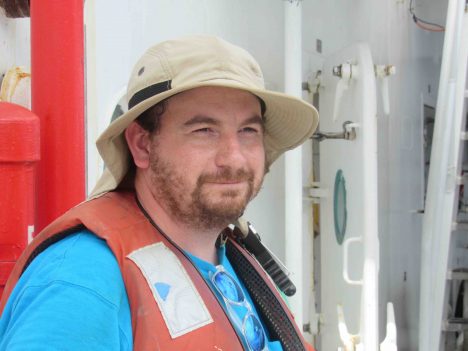
Dan Clark, APL engineer extraordinaire.
The SSP platform is a converted paddleboard with a keel and surfboard outrigger. It is tethered to the ship so it skims the sea surface outside the wake or influence of the ship. Below the paddleboard, on the leading edge of the keel, are salinity (and temperature) sensors at depths of 10 centimeters (4 inches), 30 centimeters (1 foot), 50 centimeters (1.64 feet), and 100 centimeters (3.28 feet), microstructure sensors (to estimate turbulence), and cameras. The Salinity Snake (see my last blog entry) supplements the SSP by providing temperature and salinity in the upper few centimeters of the ocean. The SSP can be towed for many hours before the instrument batteries need refreshing.
Deployment of SSP is most informative when there is a rain event, leading to stratification of the near-surface ocean with less dense fresher water on top of denser saltier water. If there is a rain event ahead of the ship, the SSP goes in the water. Then it can measure how the ocean changes over the periods from before rain, during rain, and recovering from rain. Salinity from several depths and simultaneous turbulence estimates are then used to determine how rainwater mixes into the ocean.
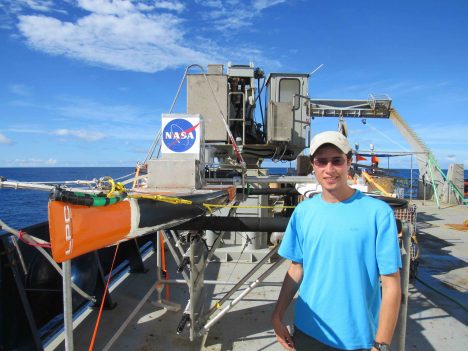
Suneil Iyer with Surface Salinity Profiler on deck (sensor to bottom left on keel)
Suneil Iyer is a new graduate student at University of Washington who will work with Kyla on interpretation of the microstructure measurements from the SSP data. He just arrived in Seattle from his hometown of Kansas City, Kansas, one week before the R/V Revelle departure from Honolulu. He just had time to find an apartment before jumping on a plane for SPURS-2. Graduate school in oceanography can be a blast of new experiences! This is not his first exposure to physical oceanography: Suneil worked on tides in estuaries during his undergraduate work at University of South Carolina.
Kyla Drushka working on the Surface Salinity Profiler.
Kyla Drushka joined UW in 2014 after PhD work at Scripps Institution of Oceanography. She is now an active member of NASA’s Ocean Salinity Science Team and the mission science team for the Surface Water Ocean Topography satellite that is planned for launch in April 2021.
This blog entry goes to press near an auspicious moment on R/V Revelle SPURS-2 voyage. Saturday at 2 am (local time) is the halfway point of our expedition! In our oceanography lexicon we would call this the “hump day” for our voyage. For all you land-loving 5-day-a-weekers hump day might mean Wednesday. For the 24/7 work at sea, we really have only a “hump moment” to mark the halfway point of a continuous work schedule. Like any good NASA activity, people aboard have countdowns running to both our hump moment and our arrival back in Honolulu (8 am on Sept. 23). Amusement is in short supply!
By Eric Lindstrom
A longstanding technical challenge for oceanography has been how to measure the sea surface – temperature, salinity, gas exchange, or surfactants – to name a few examples. Obviously enough, the surface is where the ocean and atmosphere interact and exchange heat, freshwater, gases, momentum, and particles of all kinds. So, how do we measure the properties and exchanges right at the surface? If we are on a ship or any floating platform, the platform disturbs the surface. From satellites we can measure many properties of the surface but only on very broad scales. The R/V Revelle, right now, is the ship showing how modern science is meeting the challenge. Let me tell you about some key elements.
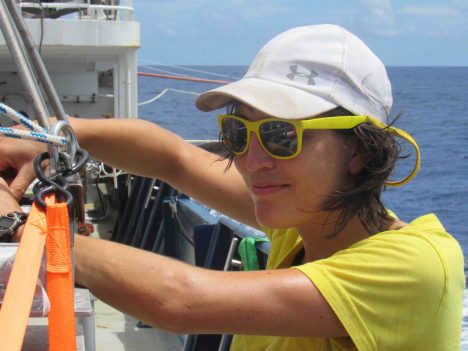
Julian Schanze from Earth and Space Research in Seattle and Jim Edson from University of Connecticut have brought two instruments aboard with innovative ways to measure the temperature and salinity at the surface – the Sea Snake for temperature (Edson) and the Surface Salinity Snake (Shanze) for, obviously, surface salinity. The former places a temperature sensor at the end of flexible hose that is hung outboard from the bow of the ship (near the wake), to continuously measure temperature. The Salinity Snake, outboard of the wake passes water through a vortex de-bubbler and thermosalinograph to obtain an estimate of salinity within inches of the ocean surface. It is an awesome “contraption” (with no offense to Julian).
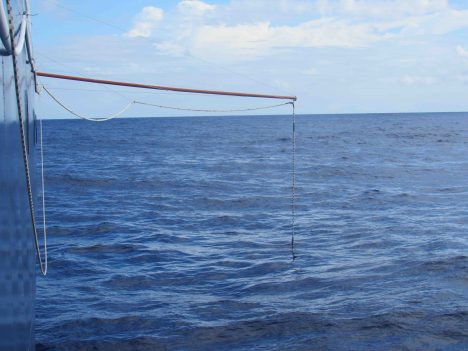
The Salinity Snake being deployed over the starboard side.
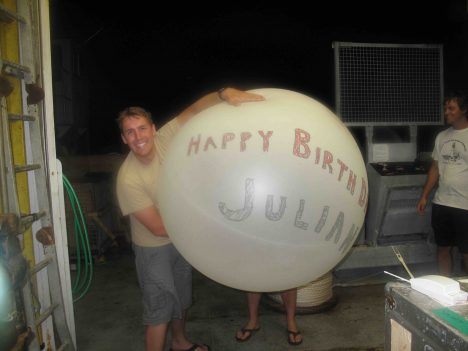
Julian Schanze’s birthday balloon.
Today is Julian’s birthday so all the Salinity Snake gear has been draped with colorful paper snakes carrying birthday greetings. Julian participated in SPURS-1 in 2012 and has since received his PhD and is making a name for himself by tackling surface salinity science from gadget to satellite and from seawater intake to space. It is wonderful to have someone so capable on the NASA Ocean Salinity Science Team!
Andy Jessup, our chief scientist from University of Washington Applied Physics Laboratory and Michael Reynolds from Remote Measurements and Research Co. in Seattle have brought a dazzling array of instruments for measuring and probing the skin temperature of the ocean. The surface of the ocean is known to have a cool skin at the molecular level. Photos of the sea surface with infrared cameras reveal complex and interesting patterns as a result of mixing, wave breaking, surfactant conditions, and wind. NASA has always had a deep interest in skin temperature because satellites do measure this skin temperature while every probe you stick in the ocean measures something deeper and different than skin temperature. From the Revelle, Andy and Michael are using several infrared radiometers and cameras to measure and depict the sea surface skin temperature. There is one on a boom to measure outboard of the ship wake, one mounted on the rail to look outward from the ship and another on a balloon to take infrared photos of the skin from 300 feet above the ship (the Lighter-Than-Air InfraRed System – LTAIRS.)
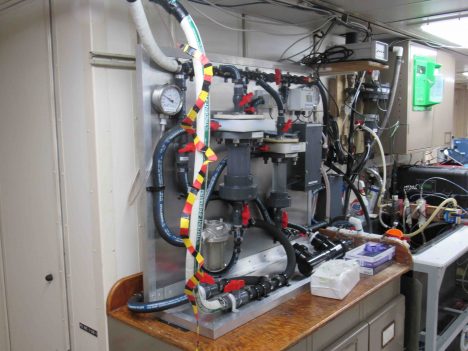
The laboratory end of the Salinity Snake and Carbon Dioxide analysis.
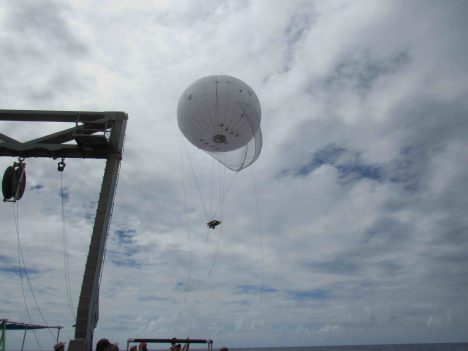
LTAIRS ascends toward 300 feet.
Eric Chan, from University of Hawaii, is aboard measuring making a suite of carbon dioxide, pH, and Dissolved Inorganic Carbon measurements for principal investigator David Ho. They study the exchange of carbon dioxide across the air-sea interface and they’re particularly interested in how rainwater on the surface of the ocean impacts the gas exchanges.
The array of instrumentation aboard Revelle is quite astonishing and the technical innovations displayed in measuring the sea surface are truly remarkable. And I haven’t even mentioned the Surface Salinity Profiler yet in this blog post. I have been teasing you with that since the start of the voyage and I PROMISE to give it a blog entry all to itself!
Today is also the birthday of the R/V Revelle Captain, Christopher Curl. I am sure I speak on behalf of the entire SPURS-2 science party when I offer him a hearty “HAPPY BIRTHDAY!” and say how pleased we are with the entire ship and crew of R/V Revelle. I guess that sharing the ship with a group of rare ocean-skin specialists with sea snakes is not how he imagined this birthday, but he is quick with a smile and will roll with our skinny offerings!
By Eric Lindstrom
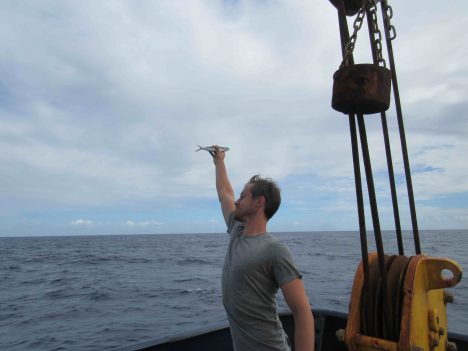
Sam Levang from WHOI catches a flying fish in flight.
I figured I would go off topic today and discuss a disturbing observation by someone who has spent more than half a lifetime going to sea. This is my personal opinion and does not reflect any policy or perspective of NASA. However, those of you on land really need to know that humans have had an enormous impact on the large life forms in the ocean. Sure, you probably know about how we took whales to the brink of extinction, but what about the fish on your dinner table. Do you really know how much is left in the sea?
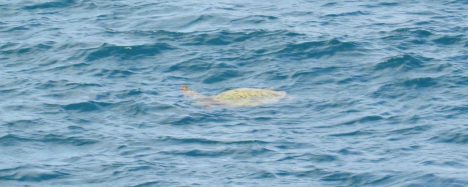
A sea turtle near Honolulu.
First, to minimize stating a bunch of boring facts and figures, I give you some brief but informative links below to research for yourself. This blog post is more of an emotional statement of alarm from my personal experience than that of a fisheries biologist or an expert on marine biota of any kind.
I became an observer of marine life from a very young age. I was raised in Seal Beach, California in the 1950’s when sea lions still roamed the beach. They have long departed. Most of my oceanographic life was spent in the tropical Pacific Ocean from late 1970s to present. My experience tells me has been an enormous change in the frequency of sightings of marine organisms from shipboard during those years. In the 1970s and 1980s it was a daily occurrence to see sharks, tuna, squid, and birds. Now, in the 21st century, we are lucky to see ANY of the former and few birds. Flying fish are still around but disturbingly little else swims by the ship during shipboard work in recent years. To put this in land-loving terms it feels like a rainforest filled with life is replaced by a desert of bleak lifeless sand. Sadly, this trend has been clear to me for decades and is substantiated in many ways by scientific studies. I particularly note that my personal observations coincide in time with the dramatic increase in tropical fisheries from the 1980s. Rapid depletion of large and visible marine organisms at the top of the food chain has been well-documented. A good book on this subject is “An Unnatural History of the Sea” By Callum Roberts.
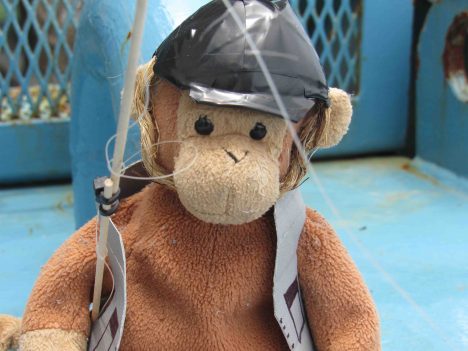
Monkey geared up for fishing.
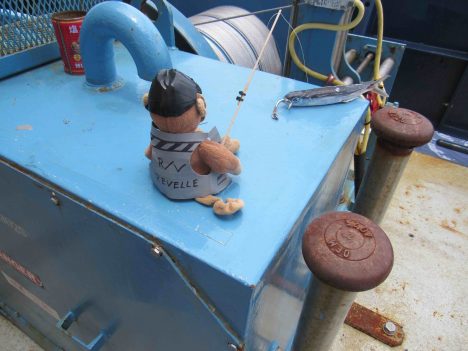
Monkey actually caught a fish!
Another aspect of the alarming trends in the ocean over recent decades is the growing abundance of marine debris, particularly plastics in the far reaches of the open ocean. I will devote a future blog to this subject (as I did during SPURS-1)
I do not wish to leave you with only a picture of doom and gloom. We should all pitch in to alleviate pressure on ocean ecosystems. The National Oceanic and Atmospheric Administration has created Fish Watch to help guide concerned consumers to sustainable seafood choices. I urge all who follow my blog to become concerned consumers! Also, any lessons from your past about the limitless abundance of the ocean should certainly be buried and replaced by thoughts about care and stewardship of precious and limited marine resources.
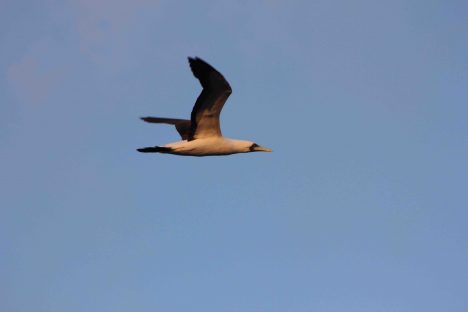
Masked booby.
References:
Overfishing (Wikipedia).
