By Eric Lindstrom
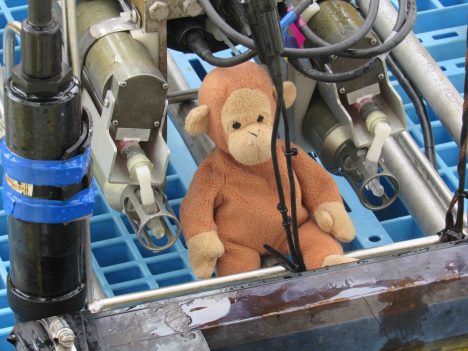
Our mixed-up Monkey looks everywhere for microstructure probes.
One of the challenges of oceanography (and many other sciences) is telling a coherent story of the environment across a vast space of space and time scales. For example, cosmologists tell the story of the universe from subatomic particles to the breath of the visible universe and from first nanoseconds of the big bang to billions of light years.
For SPURS-2, mixing is obviously an important factor in telling the story of how rainwater combines with seawater to bring about the east Pacific fresh pool that we see from space. That mixing primarily happens in the upper ocean at scales of centimeters, where turbulence is caused by phenomena such as wave breaking, current shears, convection in unstable layers, and the rain itself hitting the sea surface. In order to understand the big picture, we need to estimate the magnitude and location of the centimeter scale turbulent mixing.
Over many decades oceanographers have become quite adept at estimating mixing from measurements of centimeter scale temperature, salinity, and velocity variations – otherwise known as microstructure. Now, along with our standard instruments for measuring temperature and salinity, we also deploy microstructure probes – very fast sampling sensors of ocean variables.
It is beyond the scope of this blog to explain how microstructure measurements are transformed into ocean mixing estimates, but it is one of the more helpful developments in modern oceanography.
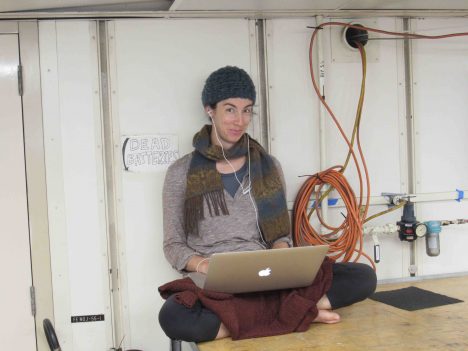
Caitlin Whalen, working on her review article for the Bulletin of the American Meteorological Society.
Caitlin Whalen of the University of Washington Applied Physics Laboratory (APL) is an expert in ocean mixing. While on the SPURS-2 expedition, she has contributed to a review paper on the subject for the Bulletin of the American Meteorological Society. During SPURS-2 she oversaw the addition of the Seagliders to the Lagrangian experiment.
The Seagliders will provide us with a picture of how the turbulence in the SPURS-2 region varies at deeper depths and over a longer time period than we will learn form our ship-based measurements. Over the next six months the Seagliders will repeatedly travel between the ocean surface and a depth of one kilometer, collecting data during each trip. From this data we will be able to determine how the turbulence in the ocean varies with depth and how it is related to other events such as heavy rain and the continuously changing density patterns of the water. Knowing where and when turbulence occurs will help us understand how the fresh rainwater eventually mixes deep into the salty ocean.
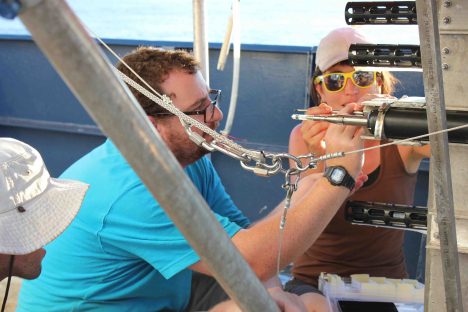
Dan Clark and Kyla Drushka of APL make final adjustments of the SSP microstructure probes.
Kyla Drushka and Suneil Iyer, also from APL, have deployed microstructure probes on the Surface Salinity Profiler (SSP). They will try to determine, from these measurements and the vertical structure of salinity in the upper meter of the ocean, how quickly rain-formed low salinity lenses are mixed into the upper ocean during individual events. Their big challenge during SPURS-2 has been to get a snapshot of salinity lenses at various stages of their lifetime. Being in the right place (low wind conditions) at the right time (just as rain begins to fall) with the right gear (SSP) actually deployed has been challenging. Still, I am sure we have collected more such data this expedition than previously existed. Finally enough data to find great exemplars for discussion in the scientific community! This is a wonderfully “fresh” topic for a graduate student like Suneil to tackle.
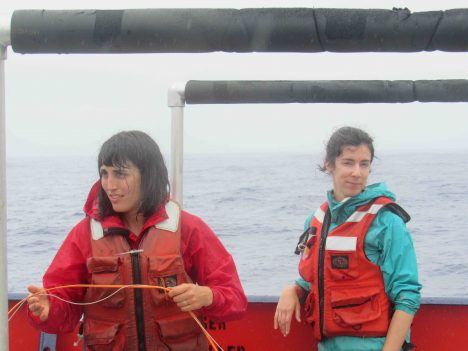
Kyla Drushka and Caitlin Whalen from APL, hard at work in the rain.
Just about everyone doing analysis of SPURS-2 data will use estimates of mixing in some way or another in the telling of their part of the story of salinity in the eastern tropical Pacific. It will be part of any salinity budget calculations and used in the description of salinity fronts. It will be an essential part of the story in explaining the seasonal patterns of salinity we see from space. The story of the smallest scales in the ocean meets up with the story of the planet as seen from space!
By Eric Lindstrom
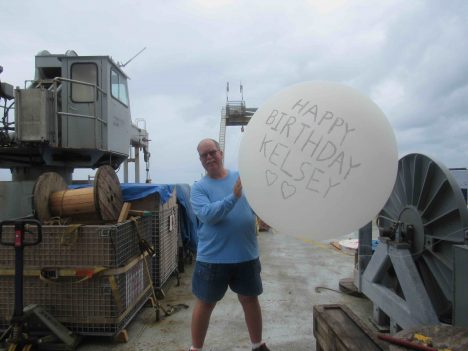
Your blogger, Eric Lindstrom, sending his daughter Kelsey a birthday balloon.
SPURS-2 on R/V Revelle has been a balloon bonanza. We have been profiling the atmosphere every six hours with radiosondes (AKA; sondes) attached to helium filled weather balloons. The sondes measure the temperature and humidity profiles in the atmosphere are transmitted via radio signal back to a receiver on the ship. They are tracked by GPS so also provide height and wind (via their changing position). The sondes are lost after the balloon pops in the upper atmosphere (over 12.4 miles –20 kilometers– up). The profile data of the atmosphere are key to studying convection, clouds, rain, and stability in the tropical atmosphere. Modern meteorology depends on hundreds of balloon launches worldwide every 12 hours. Such observations over the ocean are much less common and still provide for scientific discovery.
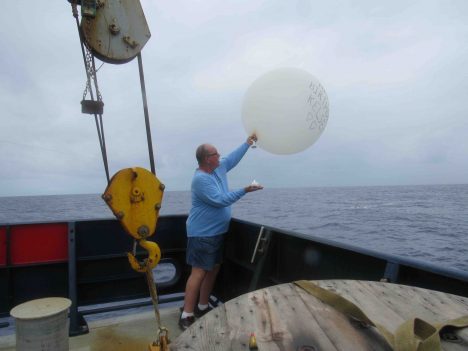
Kelsey’s balloon, floating away.
The regular weather balloon launches have also been a great way to send our birthday wishes home to friends and family. Today’s blog and balloon launch come with a hearty “Happy Birthday” to my daughter, Kelsey, in Everett, Washington! Kelsey, your birthday balloon made it to more than 21,000 meters (far into the stratosphere) and an atmospheric pressure of 44 millibars (1011.7 millibars at sea level here).
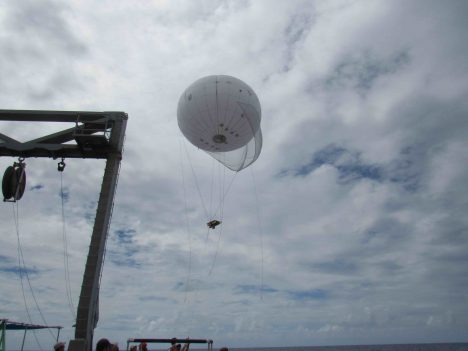
The Lighter Than Air Infrared System, just after launch.
To study sea surface temperature variation on small scales, we have deployed the Lighter-Than-Air InfraRed System (LTAIRS). LTAIRS is a large, re-usable helium-filled balloon tethered to the ship with an instrument package hanging below it. The APL team lead by Andy Jessup has suspended a camera package that images the temperature patterns on the sea surface. The LTAIRS package is deployed when there are relatively steady light winds. It is quite a drama if the LTAIRS changes height or direction rapidly. This can happen, for example, if it is launched in the heat of the day and quickly loses lift in the rapid cooling after sunset (the balloon loses lift as the helium cools). Or, if the wind shifts rapidly during a rain shower the balloon can quickly drift back over the ship bringing its tether into the ship (think tangles!). We want no drama with an expensive ($50,000 worth) camera sitting just below the balloon. However, it is oceanography and any deployed equipment is at risk of loss. Innovative observations with potential for discovery (a bonanza!) are the reward for taking and managing the risk of the balloon acrobatics. So far there are very interesting variations and patterns in surface temperature during rain events. It will take considerable post-expedition analysis to pull the whole story together, but these results look extremely promising.
For ballooning we have quite a supply of helium aboard. For many years the world’s supply of helium has been under pressure, with usage depleting national reserves of this noble gas. Recently new supplies have been discovered in Africa, but helium is another one of those resources like oil, fresh water, or fish that have come under global management for human uses. Its supply closely parallels that of natural gas from which it is separated. Conservation activities and rising cost seems the logical outcome for the long term. Helium, many other resources, will see the times of bonanza and bust as we find and use our way through the reserves and discoveries.
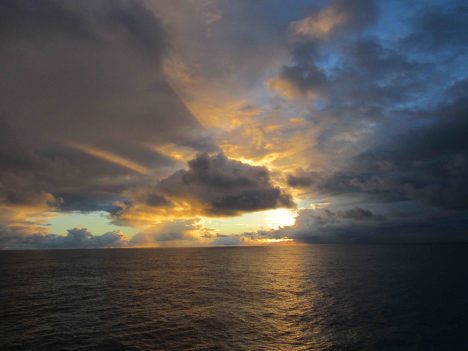
Unrelated to the balloons, but here’s a photo of a beautiful sunset at sea.
Overall, the ballooning on R/V Revelle for SPURS-2 has been very successful and highly informative – a real bonanza of scientific information. Raymond Graham will get his Masters degree puzzling over the atmospheric profiles. Andy Jessup will spend weeks glued to the computer puzzling over the patterns in the LTAIRS IR images. And every one had fun at some point in the expedition filling or launching a balloon. Very uplifting all around!
By Eric Lindstrom
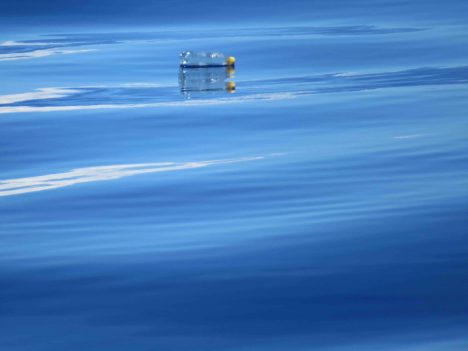
Plastic bottle floating by the ship.
A 1960’s movie classic, “The Graduate” (1967), contains a scene where the young Benjamin Braddock (Dustin Hoffman) is given advice about his future by the worldly Mr. McGuire (Walter Brooke):
Mr. McGuire: I want to say one word to you. Just one word.
Benjamin: Yes, sir.
Mr. McGuire: Are you listening?
Benjamin: Yes, I am.
Mr. McGuire: Plastics.
A report from the World Economic Forum earlier this year estimates that the weight of plastic in the ocean will equal the weigh of fish by 2050. According to the report the worldwide use of plastic has increased 20-fold in the past 50 years and is expected to double again in the next 20 years.
Ocean pollution by plastic has been worrisome for years, but the global prevalence of plastic in the ocean and the full impact of its consequences are more recently appreciated. Plastic breaks down at sea into “microplastics” that are now part of the floating plankton – the base of the food web in the ocean. So, plastic is increasingly found in the stomachs of marine organisms. Recent estimates put the amount of plastic floating in the world’s oceans at more than 5.25 trillion pieces weighing more than 268,000 metric tons. That translates to as much as 100,000 pieces per square kilometer in some areas of the ocean. This is a new ocean habitat know as the plastisphere.
The plastisphere is a new waterfront mobile home for marine microorganisms. It potentially provides a floating home for microbes to take long tours of the ocean that were heretofore impossible. The ecological implications of this new globalization of the ocean microbial biota have yet to be determined.
Zooplankton and fish consume microplastics as they forage the plankton. Scientists think that nearly every bird that feeds at sea has a burden from the plastisphere as they forage the small fish. Given the rapidly increasing tonnage of plastic joining the plastisphere and the plastisphere invasion of the marine food chain, we too will be doing battle with the plastisphere, if not already.
Marine debris is not all plastic and has many sources. However, dumping from ships at sea is NOT the major source. Dumping at sea has been highly regulated for more than 30 years. The major source of plastics and other debris in the ocean is from land sources and river runoff.
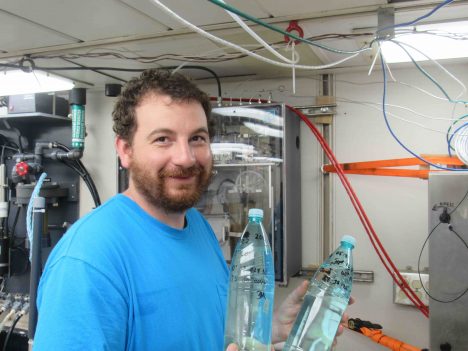
Dan Clark with two of his nearly 50 bottles of samples for investigation of ocean microplastics.
In SPURS-2 we are very far from land – 7.5 days transit by ship from the Hawaiian Islands. Yet, still, we spy plastic bottles, shoes, fishing gear, and other unidentifiable debris at the surface of the ocean every day. We also have evidence that microplastics exist here. A UV filter, part of the water intake to one of R/V Revelle’s new thermosalinograph systems (Underway Salinity Profiling System) inadvertently acts as a microplastics sampler. Floating plastics, fibers and ocean detritus accumulate in the UV filter chamber that used to sterilize the saltwater sample prior to salinity sensing. The debris in the filter must be cleaned frequently to keep the system in working order and prevent bioaccumulation in salinity sensor. This thermosalinograph system was not designed for studying ocean debris, but it is a plenty worrisome observation. Dan Clark from University of Washington’s Applied Physics Laboratory is keeping the daily samples for analysis after SPURS-2. This a nice example of citizen science undertaken through the curiosity and personal initiative of Dan over and above his many other duties. Now he just has to figure out how to deal with the unusual sampling protocol!
The ocean is actually quite forgiving as a disposal site for human detritus in moderation, except plastic. Organics can be recycled by marine life, wood is disposed of quickly by boring worms, metals can be corroded by seawater, but plastic cannot be dissolved or digested. It is only humans who create and produce plastic goods. It is only humans who can dispose of plastic properly. Plastic MUST be recycled or disposed in landfills. Plastic has no business being in the ocean. We can only hope that the plastisphere we have created can be tamed and that it does not spawn deadly new microbes by virtue of its existence.
So, next time you are using a plastic good, make sure its afterlife is not in the plastisphere of the ocean. Benjamin’s retort to Mr. McGuire should have been “Yes. Mr. McGuire. Plastics are the future. If we can find proper ways to dispose of them!”
By Eric Lindstrom
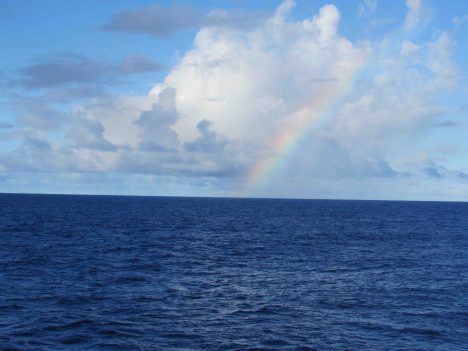
Blue sea and sky, with a nice rainbow.
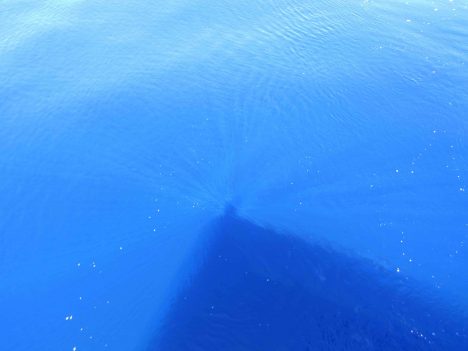
The beauty of sea and sky in the open ocean of the tropics is a wonder to behold. There seemingly are an infinite number of ways to mix the sun, clouds, water, wind, and stars into poetry and science. For today I choose only a tiny slice of this infinite variety: Today is all about the blue.
Blue is the fundamental background of the sea and sky in the tropical oceanic regions of the Earth. The preferential scattering of blue light in the full spectrum of visible light from the sun accounts for the blue sky. Most open-ocean regions have remarkably clear water, which when illuminated by the sun also takes on a deep blue hue. Other visible light is absorbed quickly in the sea and it remains for the blue to be scattered back and illuminate modest depths.
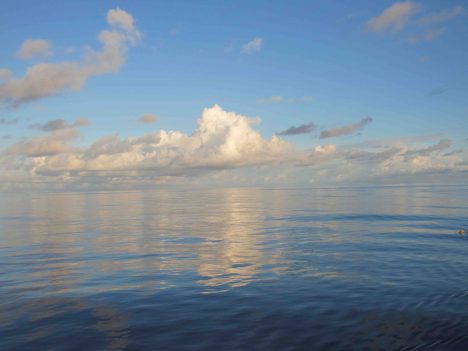
Sea and sky on a very calm day.
While clear seawater is blue, if particles are introduced to the water such as floating microscopic marine organisms (plankton) or silt and mud, it can be transformed shades of green, red, and brown. However, clear blue seawater does not indicate the absence of life: Blue ocean water is still a sea of life with submicroscopic picoplankton and marine viruses making a life in the chemical soup that is seawater.
Oceanographers like Carol Anne Clayson from Woods Hole Oceanographic Institution use a special instrument, the HOBI a-Sphere Spectrophotometer, to measure upper ocean absorption of light. The instrument uses an internal light source to measure absorption characteristics as it is lowered from the ship. This measurement is critical to estimating the transfer of radiant heat energy across the air-sea interface. Here in the SPURS-2 field site, the water is so clear that sunlight penetrates well below the well-mixed surface layer and is lost to typical energy budgeting exercises. So, the question of how much energy is lost in such calculations is a big question (considering the vast extent of this very clear blue ocean) when climate studies demand a careful accounting of heat flows to and from the ocean.
Blue ocean, with sun rays around Eric’s shadow.
It is often true and hard to imagine that those days when sea and sky are blue and the harsh tropical sun sees no cloud are when the atmosphere is feasting on its fuel from the ocean, water vapor, through the process of evaporation. We all know evaporation from the ocean is invisible, but I would use poetic license and say that evaporation is really blue! It is a clear dry wind over a warm ocean (e.g. trade winds in the tropics) that fills the atmosphere with the moisture that accounts for most of our rain. Like yesterday, when it was clear blue sky from horizon to horizon with a gentle wind leaving the deep blue ocean without a single whitecap, it is all blue and it is bonanza for evaporation.
Raymond Graham and Jim Edson from University of Connecticut (whose color brand is navy blue!) are making careful measurements of both evaporation and precipitation during SPURS-2. Despite our focus on salinity and the role of rain in forming the eastern tropical Pacific fresh pool, we must completely account for all the moisture that flows between atmosphere and ocean. The rain is visible and tangible. The evaporation is invisible but critical to the moisture budget. They are also profiling the temperature and moisture through the atmosphere using instruments on balloons (learn more about this topic in a later blog post!).
The R/V Revelle blue meets ocean blue.
Blue is the color of our daily lives in R/V Revelle. The ship is blue. The crew’s t-shirts are blue. The ocean is blue. The sky is blue. The rods and cones on our retina normally get a color workout every day. Out here, some of our retinal cells are getting a six-week vacation. The 2 percent of our cone cells tuned to blue light are getting no rest at all. Maybe that is why the colors of land (greens and reds) look so vivid that first day back ashore? Or maybe, being back ashore just makes an oceanographer blue!
By Eric Lindstrom
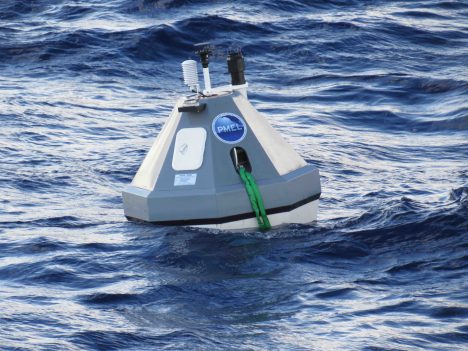
One of the two buoys from the NOAA Pacific Marine Environmental Laboratory used during SPURS-2.
SPURS-2 is basic research seeking to improve our fundamental understanding of the surface salinity of the ocean. How does the salt content of the top layer of the ocean vary, and why? However, the question of today’s blog is: How should such work be supported?
While NASA is the prime investor in SPURS (so we make the most of our salinity measurements from space), significant components are made from the National Oceanic and Atmospheric Administration (NOAA) and the National Science Foundation (NSF). And much of the oceanographic equipment on the used on the ship has origins in work supported by the Office of Naval Research (ONR). All these government agencies (NASA, NOAA, NSF, and ONR are also known in DC circles as “the 4 Ns”) working together on the ocean – how does that work? Many of the people on the ship are from universities but supported by grants from these federal agencies. Wherever you peek at oceanography, you will find national governments behind the curtain….
If there was any doubt in your mind about whether oceanography should be an enterprise supported by U.S. federal tax dollars, this blog post is for you. I would like to provide you with several compelling lines of reasoning – the federal case for oceanography.
One line of reasoning is that such research is a public good. This, roughly, is something that has a broad group of beneficiaries and few identifiable investors that can make it happen. All taxpayers, together through government, support public goods. There are public goods that we can easily relate to –national defense, weather forecasts, national parks, and interstate highways, just to mention a few–, and I would add oceanography to the list. Understanding how the ocean works has broad benefits in the areas of weather and climate prediction, ecosystem services, national security, transportation, recreation, and public health. There are few individuals or companies that can meet the challenge of fulfilling the need, but the necessity for the public good is great. The federal government is the enterprise to support the needed research. Private industry can certainly build on the knowledge of the ocean, but the generation of knowledge is required first.
Modern global oceanography really grew up out of the war effort in the 1940s. That is when submarine warfare, amphibious landings, and search and rescue led to sizable government investments in understanding the ocean’s physical, chemical, and biological characteristics, including specific like the waves and tides on landing beaches. Of course, navies for centuries have been on the leading edge of oceanographic knowledge generation but it was the continuation of the work after the war that led to the civilian oceanography community we have today in the United States. The U.S. Office of Naval Research was important in setting up the Ocean Sciences section at the National Science Foundation. The National Oceanic and Atmospheric Administration formed in 1970 to consolidate weather, coastal, and fisheries services that have a far deeper history in government. NASA formed in 1958 to organize space technologies that would later gain favor in viewing the ocean from low Earth orbit.
James Watkins, a former Chief of Naval Operations and Secretary of the Department of Energy, was an articulate advocate of the case for oceanography having a significant role in winning the Cold War. He thought the US supremacy of the seas certainly had been critical in victory.
Another line of reasoning and a corollary to oceanography being a public good is the advent if the Law of the Sea in 1982. This legislation extended the reach of sovereign nations well out into the sea by declaration of 200-nautical-mile Exclusive Economic Zones. Governments, almost overnight, had new territory (beyond prior 12 nautical mile political boundaries) with marine resources to explore, characterize, and manage. Many countries responded to this challenge with comparable expansions in marine research and capabilities such as new research vessels and ocean surveillance.
If the Law of the Sea compelled oceanography through national self-interest, international cooperation is also compelling the federal case for oceanography. The fact that the ocean occupies 71 percent of the Earth surface suggests the need for many nations to work together to understand the whole of the ocean. In fact, that is the case. The 4 N’s are central to a number of joint international accomplishments in recent decades. The World Ocean Circulation Experiment, the Joint Global Ocean Flux Study, and the World Climate Research Program have deepened our knowledge of the ocean through the collaborative work of these US agencies working with international partners. There is strong coordination internationally through the Intergovernmental Oceanographic Commission and its sponsorship of the Global Ocean Observing System. SPURS-2, as with many other expeditions focusing on ocean processes, is led by one national agency (in this case NASA) with contributions from the others. Audrey Hasson is aboard R/V Revelle from the French space agency CNES. NASA works closely with many international space agencies on the view of the ocean from space. NOAA collaborates with many international partners on the in situ ocean monitoring networks of the Global Ocean Observing System.
There you have my quick summary of the federal case for oceanography – public good, Law of the Sea, and international collaboration – all compel a strong federal government role in ocean research and observation.
