A few paths in life are short and direct; more of them are long and winding.
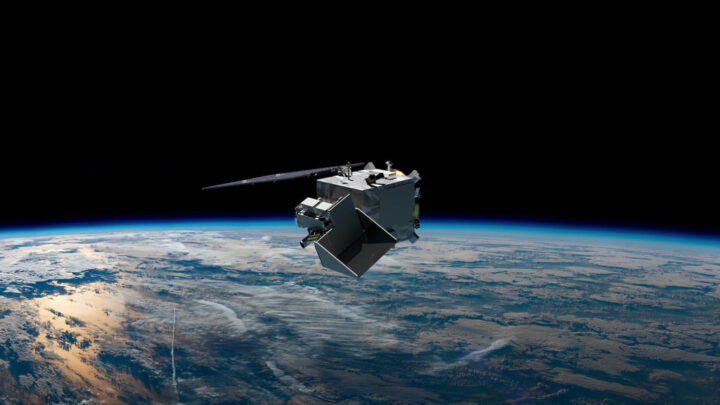
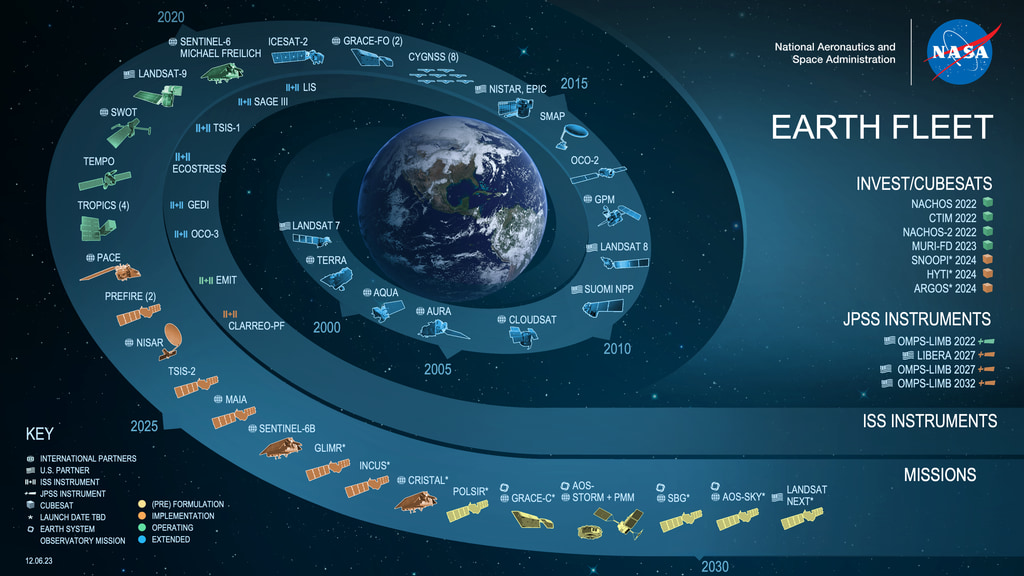
This week, a SpaceX Falcon 9 rocket will launch from Cape Canaveral Space Force Station carrying the PACE satellite, short for Plankton, Aerosol, Cloud ocean Ecosystem. Once in orbit 676 kilometers (420 miles) above our planet, the newest addition to NASA’s fleet of Earth-observers will look at the oceans and land surfaces in more than 100 wavelengths of light from the infrared through the visible spectrum and into the ultraviolet. It will also examine tiny particles in the air by looking at how light is reflected and scattered (using a method like looking through polarized sunglasses).
The combination of measurements from the new satellite will give scientists and citizens a finely detailed look at life near the ocean surface, the composition and abundance of aerosols (such as dust, wildfire smoke, pollution, and sea salt) in the atmosphere, and how both influence and are affected by climate change.
For NASA and the ocean science community, the PACE launch will be the culmination of 9 or 46 years of work, depending on when you start counting. For me, it will be the culmination of something that started in 1950.
“There is a greater than 50 percent chance I will burst into tears at the launch,” said Jeremy Werdell, a satellite oceanographer at NASA’s Goddard Space Flight Center since 1999 and project scientist for PACE since 2015. “We are standing on the shoulders of previous missions and the people who led them. And it has been a long and remarkable journey.”
NASA’s first attempt at measuring ocean color dates back to the Coastal Zone Color Scanner (CZCS) instrument, which flew on the Nimbus 7 satellite from 1978-1986. In 1997, the agency launched the Sea-viewing Wide Field-of-view Sensor on the OrbView-2 satellite. SeaWiFS collected ocean data until 2010 and fundamentally changed our understanding of phytoplankton—microscopic, floating, plant-like organisms that are the grass of the sea. That sensor is an ancestor of the new Ocean Color Instrument (OCI) on PACE.
Other instruments and teams have observed the colors of the ocean. The Moderate Resolution Imaging Spectroradiometer (MODIS) instruments on NASA’s Terra and Aqua satellites have been flying since 2000 and 2002, complementing and extending the record started by SeaWiFS. More recently, the Visible Infrared Imaging Radiometer Suite (VIIRS) instruments on the Suomi-NPP, NOAA-20, and NOAA-21 satellites have provided a broad view of ocean color. And several other instruments — like the Hyperspectral Imager for the Coastal Ocean (which flew on the space station), HawkEye (on the SeaHawk CubeSat), and the Ocean Radiometer for Carbon Assessment (which was flown on NASA research planes) — helped researchers test new ways to look at the sea.
For atmospheric scientists, the path to PACE also traces back across decades. In the late 1970s, the Advanced Very High Resolution Radiometer (AVHRR) provided some of the first looks at aerosol optical depth, a measure of how much dust and particles were floating in our skies. Later scientists began measuring such particles daily and around the world with the Multi-angle Imaging SpectroRadiometer and MODIS instruments on Terra. The OMI instrument on the Aura satellite, and its successor OMPS on Suomi-NPP, provided other unique views of aerosols. A HARP instrument flew on a CubeSat from 2019-2022 and provided a direct test of the technology that now flies on PACE as HARP2.
The origin of PACE itself sort of started around 2007. NASA and other federal agencies asked the U.S. National Research Council to study and suggest new tools and measurements for studying Earth from space. Their report (known as a “decadal survey“) recommended a mission that ultimately led to the A(erosol) and C(loud) components of the PACE mission. The inspiration for new ocean color sensors then arose from a NASA climate initiative proposed in 2010.
By 2012, NASA scientists and engineers were starting to sketch out rough ideas for PACE, and the wider science community dug into the details in 2014. By 2015, NASA Goddard started hiring for a new mission—including Jeremy Werdell—and by 2016, the agency had announced the formal development of a PACE mission.
Between that moment in 2016—known as Key Decision Point A—and this week’s launch there have been thousands of hours of work by hundreds of people…including many months working through a global pandemic…and the methodical, thoughtful testing of every idea, every design, and every part.
For me, the road to the PACE launch has also been long.
I have spent 21 years of my life working for NASA, and yet this will be my first launch. I feel blessed to spend my days working with incredibly talented, visionary, and smart people. This launch feels like the culmination of a lifetime geeking out on Earth and space science. Several threads of my life will all tie together this week.
In 1950, a 7th grader in Newark, New Jersey, won an essay contest by writing about a trip to the Moon. My father was fascinated by science fiction—he still is—and by journalism. He followed America’s developing space program with interest and, in 1969, his youngest son was born two weeks after the Apollo 11 Moon landing. Though no one can remember clearly, I like to say my parents named me for Michael Collins, who quietly orbited the Moon for 21 hours while Neil Armstrong and Buzz Aldrin made the headlines below. (My mother often reminded me that she went through a similar 20+ painstaking hours of labor waiting for me to show up.)
On my first job as a magazine writer, I wrote in 1992 about the Mission to Planet Earth—first an international conference, then an early name for what became NASA’s Earth Observing System. I visited NASA’s Jet Propulsion Laboratory in 1994 to research my graduate thesis and by 1997 I had joined NASA Goddard, where I stayed for five years writing about space weather and space physics.
But then I traded one institution of exploration for another, leaving to write about ocean science for Woods Hole Oceanographic Institution (WHOI). It was during those years on Cape Cod that I learned a boatload about phytoplankton and harmful algae. I spent 11 days at sea in 2005 on the research vessel Oceanus, helping scientists gather water samples to track a pesky, toxic phytoplankton called Alexandrium fundyense. After decades visiting the ocean, I was living by it and learning about it daily.
I rejoined NASA in 2008 and eventually joined Earth Observatory. Circumstances and generous colleagues allowed me to keep living by the sea, and so I brought my love of the ocean into my reporting. I also passed that love of the ocean and space to my children: Two have become marine biologists who study plankton, and one is an aerospace engineer working on satellites.
After so many years of my life intersecting with NASA and the sea, it just feels right that my first rocket launch should be a satellite that will bring us new eyes on Planet Ocean.
It doesn’t take a lot of technology to see that the ocean is blue. And when it comes to the blueness of the ocean, it doesn’t get much more blue than where I am. I’m sitting on the research vessel Nathaniel B. Palmer—the largest icebreaker that supports the United States Antarctic Program—on an oceanographic expedition across the South Pacific Ocean, my current home, office, and laboratory. On this voyage, however, the Palmer has broken no ice.
Our Global Ocean Ship-based Hydrographic Investigations Program (GO-SHIP) P06 campaign departed Sydney, Australia, on July 3, successfully ending the first leg of this journey on August 16 in Papeete, French Polynesia (Tahiti). This is where our team from NASA Goddard Space Flight Center (Scott Freeman, Michael Novak, and I) joined dozens of other scientists, graduate students, marine technicians, officers and crew members, for the second and final leg that will end in the port of Valparaiso, Chile, on September 30. The GO-SHIP program is part of the long history of international programs that have criss-crossed the major ocean basins, gathering fundamental hydrographic data that support our ever-growing understanding of the global ocean and its role in regulating the Earth’s climate, and of the physical and chemical processes that determine the distribution and abundance of marine life. This latter topic regarding the ecology of the ocean is what brings our Goddard team along for the ride.
The P06 ship track, for the most part, follows along 32.5° of latitude south. That route places our course just south of the center of the South Pacific Gyre—the largest of the five major oceanic gyres, which form part the global system of ocean circulation. The Gyre—on average—holds the clearest, bluest ocean waters of any other ocean basin. This blueness is the macroscopic expression of its dearth of ocean life. We have seen nary a fish nor other ships since we departed Tahiti—this is not a major shipping route. Oceanic gyres are often called the deserts of the sea. On land, desert landscapes are limited in their capacity to support life by the availability of water. Here, lack of water is not the issue. Water, however, is at least the co-conspirator in keeping life from flourishing. Physics, as it turns out, is what holds the key to this barren waterscape.
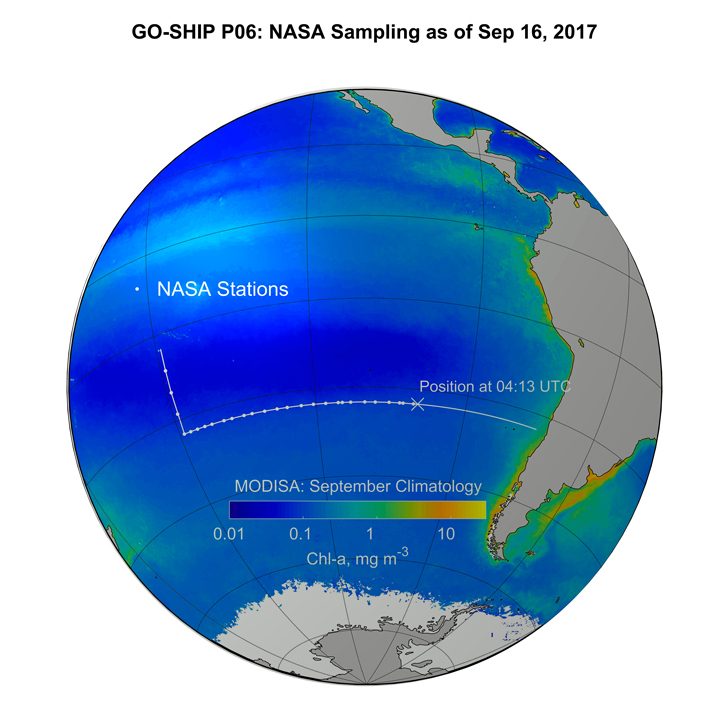
This map (above) shows the MODIS chlorophyll climatology with the ship track superimposed.
Due to the physics of fluids on a rotating sphere, such as our planet, the upper ocean currents slowly rotate counterclockwise around the edges of the center of the Gyre–as a proper Southern Hemisphere gyre should—and a fraction of that flow is deflected inward, towards its center. With water flowing towards the center from all directions, literally piling up and bulging the surface of the ocean–albeit, by just a few centimeters across thousands of miles–gravity pushes down on this pile of water. This relentless downward push puts a lock on life. The pioneers of life in the ocean, the tiny microscopic plants, known as phytoplankton, which drift in the currents, and grow on a steady mineral diet of carbon dioxide, nitrogen and phosphorus, and a dash of iron—and expel oxygen gas as a by-product, to the great benefit of life on Earth—must obtain most of their material sustenance from the ocean below. Layers of denser water trap the nitrogen and phosphorus-rich water at depth, keeping it too far down, where not enough light can reach it to spark the engine of photosynthesis that allows plants to grow.
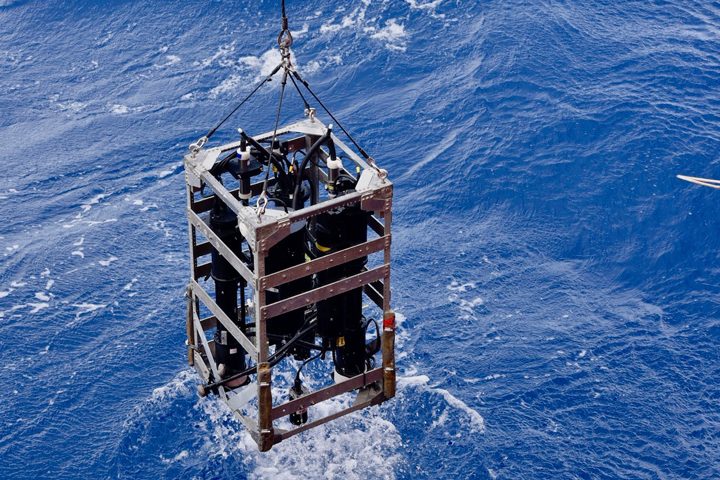
Why are we here and where does NASA come into this story? Since the late 1970s, NASA has pursued—experimentally at first, and now as a sustained program—measuring the color of the oceans from Earth-orbiting satellites as a means to quantify the abundance of microscopic plant life. Microbiology from space, in a way. Formally, though, we call it “ocean color remote sensing.” Whizzing by at altitudes of several hundred miles, atop of the atmosphere, bound to polar orbits that allow satellites to scan the entire surface of the globe every couple of days, carrying instrument payloads of meticulously engineered spectro-radiometers—cameras capable of measuring the quantity and quality, or color, of the light that reaches its sensors. This is where our work aboard the R/V Palmer comes into the story. The data the satellites beam down from orbit do not directly measure how much plant life there is in the ocean. Satellite instruments give us digital signals that relate to the amount of light that reached their sensors. It is up to us to translate—to calibrate—those signals into meaningful, and accurate, measurements of plant life—or temperature, salinity, sediment load, sea level height, wind and sea surface roughness, or any other of the many environmental or geophysical variables satellite sensors can help us detect at the surface of the ocean. To properly calibrate a satellite sensor and validate its data products, we must obtain field measurements of the highest possible quality. That is what our team from NASA Goddard is here to do.
Around midday, typically the time of the ocean color satellite flying over our location, we perform our measurements and collect samples. We measure the optical properties of the water with our instruments to compare what we see from the R/V Palmer to what the satellites measure from their orbit above Earth’s atmosphere. At the same time that we perform our battery of optical measurements, we also collect phytoplankton samples to estimate their abundance, species composition as well as the concentration of chlorophyll-a, the green pigment common to most photosynthesizing organisms like plants, including phytoplankton. By collecting these two types of measurements at once, light and microscopic plant abundance, we are able to build the mathematical relationships that make the validation of the satellite data products possible.
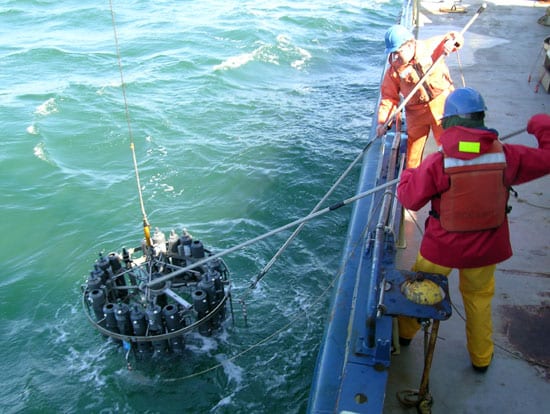
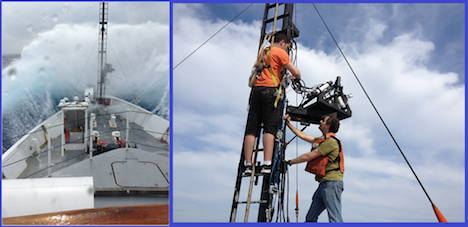
The optical instrument being lowered into the South Pacific Ocean. Credit: Lena Schulze/FSU
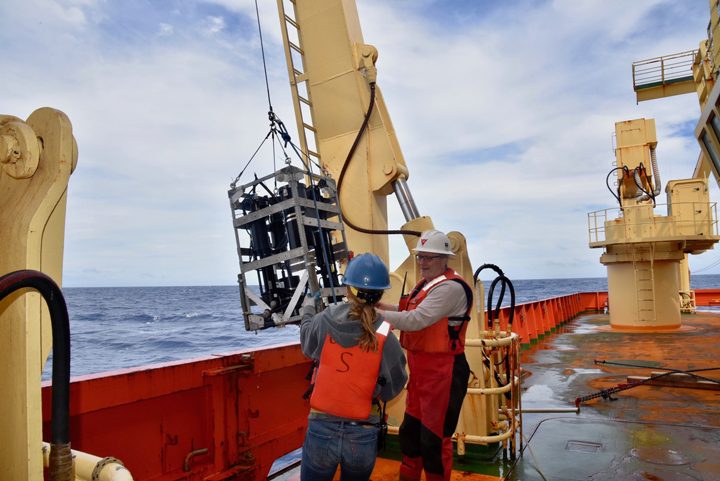
Scott Freeman of NASA works with a R/V Nathaniel Palmer crew member to prepare an instrument for deployment over the side of the ship to collect opHcal measurements. Credit: Lena Schulze/FSU
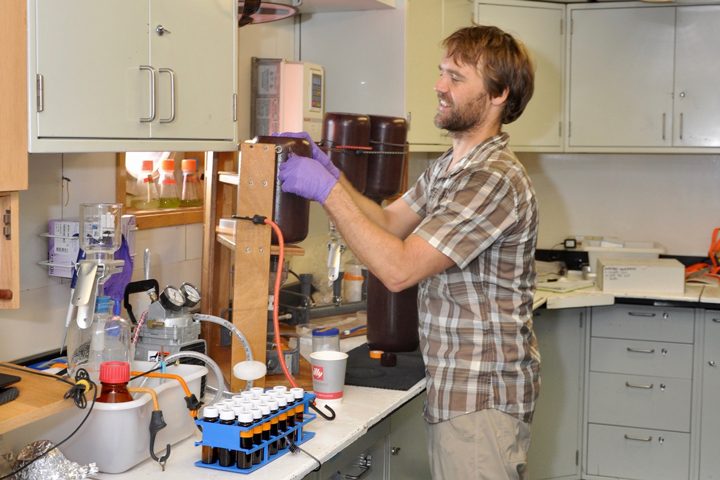
Mike Novack of NASA studies the optical and biological characteristics of seawater samples in the ship’s laboratory. Credit: Joaquin Chavez/NASA
The waters of the South Pacific Gyre are an ideal location for gathering validation quality data, perhaps one the most desirable to do so, because there are few complicating factors and sources of uncertainty that blur the connection we want to establish between the color of the water and phytoplankton life abundance. Our measurements will extend NASA’s ocean chlorophyll-a dataset to some of the lowest values on Earth. The water here is blue; in fact, it’s the bluest ocean water on Earth.
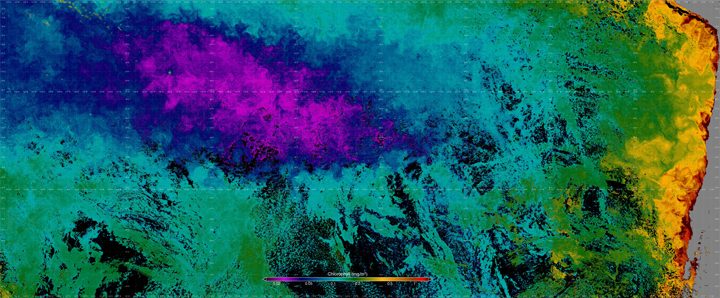
This false-color image is a composite, assembled from data acquired by the the Visible Infrared Imaging Radiometer Suite (VIIRS) on the Suomi NPP satellite between September 10-17, 2017. Yellow represents areas with the highest chlorophyll concentrations and purples are the lowest. Credit: Norman Kuring/NASA
By Eric Lindstrom
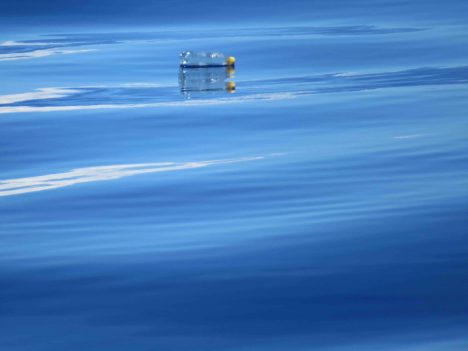
Plastic bottle floating by the ship.
A 1960’s movie classic, “The Graduate” (1967), contains a scene where the young Benjamin Braddock (Dustin Hoffman) is given advice about his future by the worldly Mr. McGuire (Walter Brooke):
Mr. McGuire: I want to say one word to you. Just one word.
Benjamin: Yes, sir.
Mr. McGuire: Are you listening?
Benjamin: Yes, I am.
Mr. McGuire: Plastics.
A report from the World Economic Forum earlier this year estimates that the weight of plastic in the ocean will equal the weigh of fish by 2050. According to the report the worldwide use of plastic has increased 20-fold in the past 50 years and is expected to double again in the next 20 years.
Ocean pollution by plastic has been worrisome for years, but the global prevalence of plastic in the ocean and the full impact of its consequences are more recently appreciated. Plastic breaks down at sea into “microplastics” that are now part of the floating plankton – the base of the food web in the ocean. So, plastic is increasingly found in the stomachs of marine organisms. Recent estimates put the amount of plastic floating in the world’s oceans at more than 5.25 trillion pieces weighing more than 268,000 metric tons. That translates to as much as 100,000 pieces per square kilometer in some areas of the ocean. This is a new ocean habitat know as the plastisphere.
The plastisphere is a new waterfront mobile home for marine microorganisms. It potentially provides a floating home for microbes to take long tours of the ocean that were heretofore impossible. The ecological implications of this new globalization of the ocean microbial biota have yet to be determined.
Zooplankton and fish consume microplastics as they forage the plankton. Scientists think that nearly every bird that feeds at sea has a burden from the plastisphere as they forage the small fish. Given the rapidly increasing tonnage of plastic joining the plastisphere and the plastisphere invasion of the marine food chain, we too will be doing battle with the plastisphere, if not already.
Marine debris is not all plastic and has many sources. However, dumping from ships at sea is NOT the major source. Dumping at sea has been highly regulated for more than 30 years. The major source of plastics and other debris in the ocean is from land sources and river runoff.
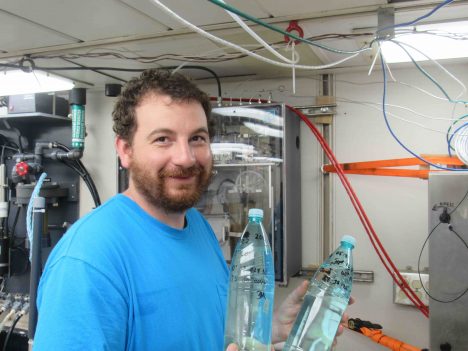
Dan Clark with two of his nearly 50 bottles of samples for investigation of ocean microplastics.
In SPURS-2 we are very far from land – 7.5 days transit by ship from the Hawaiian Islands. Yet, still, we spy plastic bottles, shoes, fishing gear, and other unidentifiable debris at the surface of the ocean every day. We also have evidence that microplastics exist here. A UV filter, part of the water intake to one of R/V Revelle’s new thermosalinograph systems (Underway Salinity Profiling System) inadvertently acts as a microplastics sampler. Floating plastics, fibers and ocean detritus accumulate in the UV filter chamber that used to sterilize the saltwater sample prior to salinity sensing. The debris in the filter must be cleaned frequently to keep the system in working order and prevent bioaccumulation in salinity sensor. This thermosalinograph system was not designed for studying ocean debris, but it is a plenty worrisome observation. Dan Clark from University of Washington’s Applied Physics Laboratory is keeping the daily samples for analysis after SPURS-2. This a nice example of citizen science undertaken through the curiosity and personal initiative of Dan over and above his many other duties. Now he just has to figure out how to deal with the unusual sampling protocol!
The ocean is actually quite forgiving as a disposal site for human detritus in moderation, except plastic. Organics can be recycled by marine life, wood is disposed of quickly by boring worms, metals can be corroded by seawater, but plastic cannot be dissolved or digested. It is only humans who create and produce plastic goods. It is only humans who can dispose of plastic properly. Plastic MUST be recycled or disposed in landfills. Plastic has no business being in the ocean. We can only hope that the plastisphere we have created can be tamed and that it does not spawn deadly new microbes by virtue of its existence.
So, next time you are using a plastic good, make sure its afterlife is not in the plastisphere of the ocean. Benjamin’s retort to Mr. McGuire should have been “Yes. Mr. McGuire. Plastics are the future. If we can find proper ways to dispose of them!”
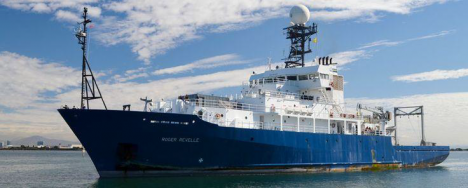
The R/V Revelle.
By Eric Lindstrom
I am writing this while on a plane headed toward Honolulu to join the Research Vessel (R/V) Roger Revelle for six weeks at sea in the Pacific Ocean. It feels great to be heading to sea again. This NASA field campaign will last more than a year, with intense shipboard work near the beginning and end of the year. A web of sensors will be deployed to monitor one oceanic region over an entire year.
As Physical Oceanography Program Scientist at NASA Headquarters for nearly 20 years, my primary job is supporting our satellite missions related to measuring physical characteristics of the ocean (principally, temperature, salinity, sea level, and winds) and supporting the oceanographers that generate knowledge from such data. True understanding requires our fully appreciating the variations of the satellite data in the context of ocean physics. And that requires getting out there and getting wet from time to time!
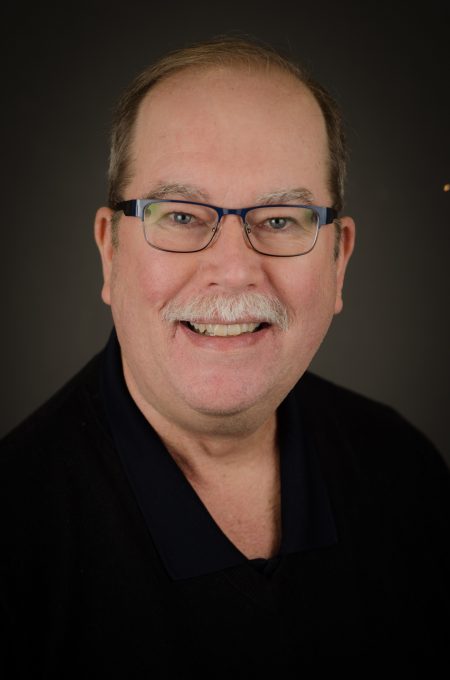
Your blogger, Eric Lindstrom.
R/V Revelle (home port: Scripps Institution of Oceanography, San Diego, California) leaves Honolulu on 13 August 2016 and returns to Honolulu on 23 September. The central location of the field work is about 8 days voyage southwest of Hawaii at 10N, 125W. Details of the expedition plans are available here. I hope to bring you a steady stream of expedition blog posts between now and the end of September 2016, including why NASA is focusing attention on this particular spot in the open ocean.
Since NASA’s launch in June 2011 of the Aquarius instrument to measure ocean surface salinity from space, the agency has embarked on field campaigns to understand surface salinity in great detail. This work has illuminated new ways of thinking about the ocean’s role in the global water cycle. Our field campaign, dubbed Salinity Processes in the Upper Ocean Regional Study-2 or SPURS-2, is the latest work to link the remote sensing of salinity with all the oceanic and atmospheric processes that control its variation.
The ocean is the primary source of moisture for the atmosphere. Evaporation of water from the sea surface leaves the ocean saltier (more saline). Precipitation over the ocean leaves the ocean fresher (less saline). The global pattern of average salinity at the sea surface approximately represents the balance of evaporation and precipitation at any locale (other factors such as river runoff, ice melt, and ocean motion and mixing complicate the picture). Many details of the interaction between ocean and atmosphere that lead to moisture transfer and signatures in ocean salinity are poorly understood. SPURS-2 is particularly focused on how, in one of the rainiest places on Earth, rainwater enters and impacts the ocean. Through this blog during the coming month, you will hear more about how and why oceanographers focus on such a problem.
The first SPURS campaign, which took place in the North Atlantic Ocean in 2012-2013, focused on the study of ocean processes where evaporation dominates the salinity of the surface ocean. I blogged during the September 2012 work from R/V Knorr. Among other things, we learned that surface salinity variations in that part of the world can be directly connected with precipitation patterns over the nearby continents. I’ll discuss that scientific finding and others in this blog over the coming month.
At the opposite extreme from SPURS-1, SPURS-2 focuses on an oceanic regime where precipitation dominates the salinity characteristics of the surface ocean. The two extremes call for significantly different approaches to measuring and studying the upper ocean. We will uses many of the same tools from SPURS-1 (instrumented moorings, profiling floats, surface drifters, and gliders) but deployed in new and novel ways.
The crew and scientific party on R/V Revelle will be more than 50 in all. As you read future blog entries you will get some sense of what its like for such a group to work closely together for six weeks in the confined space of an oceanographic research vessel. Seasickness? Food? Watches? Sleep? Drama? Boredom? Sea life? You’ll find out soon and get a sense of how some oceanographers go about their work, what technologies are involved, what is discovered, and how all this impacts lives, including yours, and what you might experience if you were aboard.
Update: The R/V Endeavor returned from sea on Aug. 6, concluding the fieldwork component of the 2014 SABOR experiment.
As mentioned in the previous blog (“A Vast Ocean Teeming with Life”) ending this cruise is not an easy thing to do. Especially if you experienced the majesty of the crystalline blue water in the open ocean as well as the magnificence of the wildlife surrounding it for the very first time. I am currently coursing my third year as a PhD student in the Electrical Engineering Department of The City College of New York (CCNY). I work as a research assistant for a small department in the Optical Remote Sensing Lab called Coastal and Oceanic waters group. We may look like a group of cool guys going out for fishing (as it seems on the left side of the picture), however, we are a team who works hand to hand together (depicted on the right side of the picture … why does the right side always seem right?)
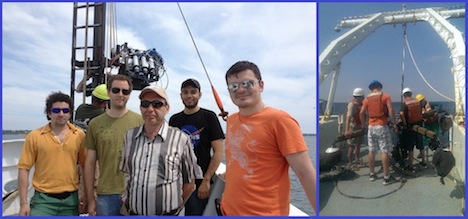
“Cool guys” aka Coastal and Oceanic waters group, members of the ORS Lab at The City College of New York (CCNY). Courtesy of Lynne Butler
My research consists of using polarization properties developed as the light field propagates through the water body and use this information to characterize and retrieve water constituents and inherent optical properties (also called IOP’s) from polarimetric measurements. The basic idea is that as light propagates through the water it experiences significant attenuation due to absorption by water and suspended/dissolved matter as well as scattering by water and suspended particulates. These effects, both absorption and scattering, result in signal degradation of the radiance captured by sensors in our instruments. The additional information obtained when using polarization properties of underwater light propagation can provide a better understanding of this propagation and methods for improving image quality and increase underwater visibility … wait! (at this point you may be asking yourself).
So how can this have a real contribution to the goals and objectives pursuit by the SABOR (Ship-Aircraft Bio-Optical Research Campaign) cruise? Well, the answer could be very simple. The ocean is too big and in-situ measurements are too expensive to cover the entire water mass on Earth. Having this in mind, it is very clear that we need to adopt another cost-effective approach and that is the reason why we use satellite observations to account for many changes that take place in the ocean and coastal waters. Satellites provide very useful information when properly calibrated. As you may already know, sensors deteriorate over time and satellites go out of commission. However, polarization features are preserved even when the sensors may have experienced normal degradation and knowledge of this features can contribute in the development of future technologies to be used in satellites when more accurate and reliable information is to be acquired. Some living and manmade objects in water have partially polarized surfaces, whose properties can be advantageous in the context of target camouflage or, conversely, for easier detection. Such is the case for underwater polarimetric images taken to detect harmful algal blooms (red tides) or to assess the health of marine life and coral reefs which are of significant scientific and technical interest.
The main challenge faced by these images is that of improving (increasing) the visibility for ecosystems near and beyond the mesophotic depth zone. Data collected in the form of images, videos and radiance was acquired using a green-band full-Stokes polarimetric video camera and measurements of each Stokes vector components were collected as a function of the Sun’s azimuth angles. These measurements are then compared with satellite observations and model using a radiative transfer code for the atmosphere-ocean system combined with the simple imaging algorithm. The main purpose of this task is to validate satellite observations and develop algorithms that improve and correct these observations when needed.

But seriously… Are you playing video games? Courtesy of Lynne Butler and Ivona Cetinic
It always looks like I am playing video games but in order to have very accurate information it is advisable to position the instrument at a certain orientation with respect to the Sun’s azimuth angle. The instrument depicted here is called Polarimeter and as Robert Foster suggested in his blog it has a very boring name, so we are still in search of a cool code name after someone suggested (unsuccessfully, and I am glad for this) to call this instrument Carlos. A real issue came across when they were thinking to put Carlos in the water … an idea that I didn’t share. The polarimeter, let’s forget about Carlos for a moment, is a set of Hyperspectral Radiance sensors with polarizers oriented in the vertical, horizontal and 45° from a reference axis. This sensors can capture light coming from any point in the water body thanks to a combination of a step motor which can be programed to stop in any sequence of angles in the range of 0 – 360° (from vertically up to vertically down) and a pair of thrusters (or propellers) which can rotate in the azimuthal direction (both clockwise and counter-clockwise). This scenario allows for vitually a 3-D range of hyperspectral measurements. Pretty cool, huh? The set of bouys at each corner allows us to have a very stable system and prevent the instrument from going very deep down in the case that cables and safety line get cut.
When things go like they do in the left image, we always have to do the right thing. Courtesy of crew members and Ivona Cetinic
Very far from what most of us have probably experienced in a cruise or fishing trip, the ocean is not always calm. In our twenty plus days in the ship, we came across a system which was playing very rough against the R/V Endeavor. Fortunately for us, this cruise was under the supervision of very talented and experienced people. I am not talking only about the captain, but also his outstanding crew members, chief scientist and marine technician. Although we have some minor difficulties (… you should know by now that sea water and electronics will never be good friends) we fixed them as soon as the storm was gone. It is not that Robert and I are playing as firefighters rescuing a dispaired kitten from a tall tree.
I want to end my vision of this field campaign with a summary of the awesome marine wildlife that somehow approach to us to say hello, some species more shy than others, to this group of scientists which were part of NASA-SABOR. As depicted in the picture (left-to-right and top-to-bottom), one of the first appearences was that of a seagull. It doesn’t look that shy since it preferred posing for us on top of the Polarimetric Lidar (owned and operated by scientist from NRL). Very intelligent creature this particular one, the others were just swimming in the waters and preparing to be a snack for a hungry shark as depicted in the image in the top center. Another interesting character which showed up near the surface was previously mentioned by Matthew Brown from Oregon State University in the previous blog post and it was a species of blueish salp with very long tentacles. The next creature is a very friendly dolphin which pretended racing us so we could take very amazing pictures. Dolphins always so adorable, appearing in pods and jumping out of the water around the research vessel or just posing underwater in front of the polarimeter! The last living character was a very shy sperm whale. Always keeping the distance but letting us know it was present leaping out of the water at most 300 feet from the ship!

Wildlife in action. Courtesy of crew members, Courtney Kearney and Ivona Cetinic
These past three weeks in the R/V Endeavor had been very amazing although intense. Waking up and knowing that you are far from home, your friends and family may sound questionable but understanding that you are in front of one the most wonderful and powerful sources of life is a priceless experience not all of us can witness. That is why I am writting this blog and I hope you have enjoyed reading all our blogs and could have a taste of what is like being in the sea for three weeks!
