I’m writing this post on our last day in St. Mary’s, Alaska. This tiny village of about 560 inhabitants had its surroundings ravaged by two large tundra fires in the summer of 2022. The East Fork fire was the second largest tundra fire in Alaska in over 40 years and the biggest in Southwest Alaska. These events were historic, and I could start this post by writing about the intense and productive three weeks of work we had here. However, this whole project started much earlier.
I started this Ph.D. with plans to do field work in Siberia. However, halfway through, due to the pandemic and geopolitical issues, I saw all those plans slip through my fingers. Despite being from a country with among the greatest biodiversity in the world (Brazil), the arctic-boreal environments have always fascinated me. So in the winter of last year, when I came across these fires while analyzing satellite images, I knew this was a unique opportunity to pack my bags and finally be in the tundra. I remember showing the first satellite images and data of these fires to my supervisor, Dr. Sander Veraverbeke, and he confirmed that these fires were indeed scientifically very interesting and logistically feasible for our expedition. From then on, a long process of preparation began.
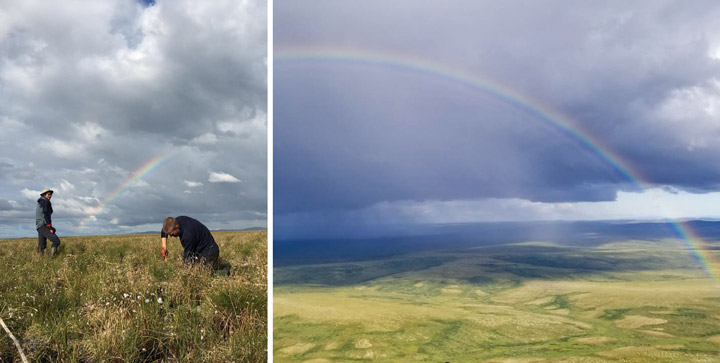
As this field campaign is part of my Ph.D. project, I was responsible for planning both the scientific and logistical aspects. Now, reflecting after the final day of sampling, it is incredibly rewarding to see that the planning has paid off. We sampled 11 days by boat along the Andreafsky River sampling the East Fork fire and another five days by helicopter sampling the Apoon Pass fire. Our main goal was to estimate the carbon combustion from these fires, that is, the area-normalized emissions in grams of carbon per square meter. Field measurements are the prime way to accurately quantify carbon combustion. To do it, we collected soil samples and estimated the burn depth of the soil organic layer. It is crucial to advance the quantification of tundra fire carbon combustion and understanding its environmental drivers.
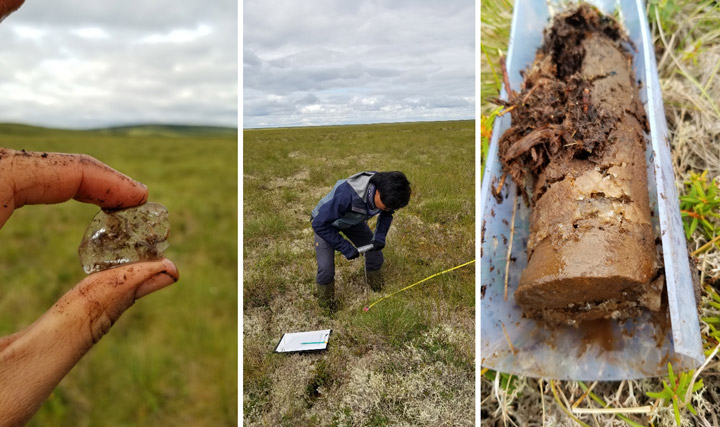
In addition to carbon emissions, another key point of our expedition is to understand the effects of fires on permafrost. Previous research has shown that fires in the boreal forest increase the thaw depth of the active layer above permafrost, which can lead to permafrost degradation. We are curious to investigate this mechanism in the tundra, even more so now that we have found ice-rich permafrost during our fieldwork.
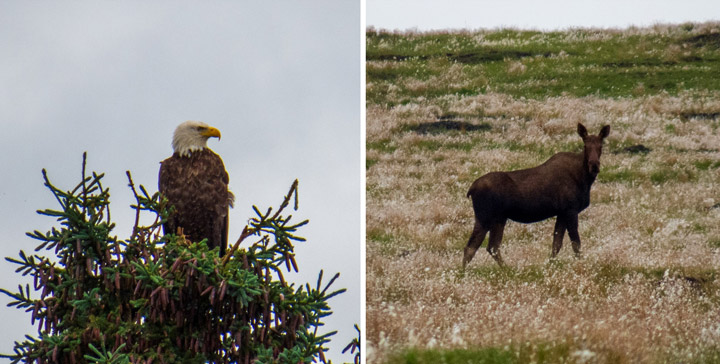
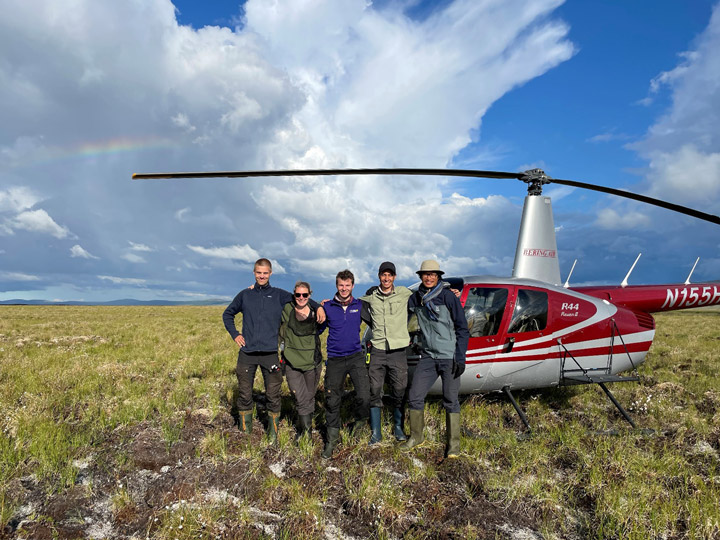
But it was not just the work that was amazing during this campaign. The tundra landscape was always breathtaking. Both from above with the helicopter and along the river from the boat. We were presented with a stunning rainbow on our first day using the helicopter. Wildlife was always around: moose, bears, beavers, eagles, geese, and countless other bird species.
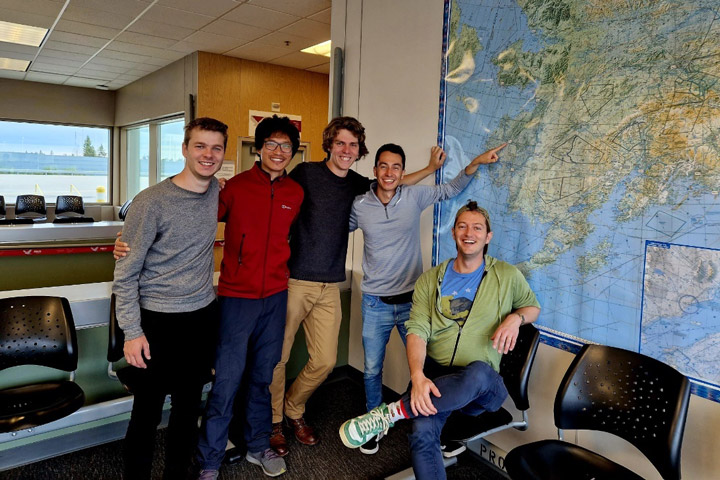
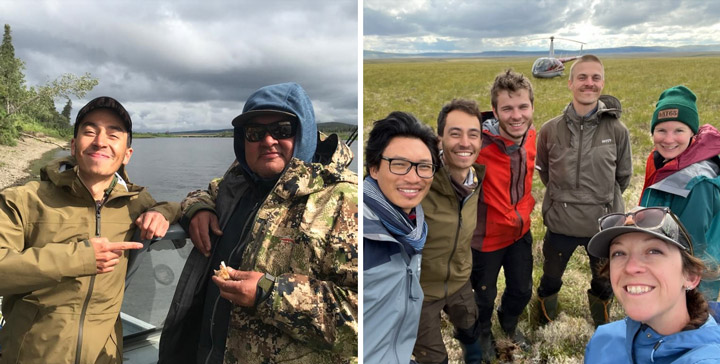
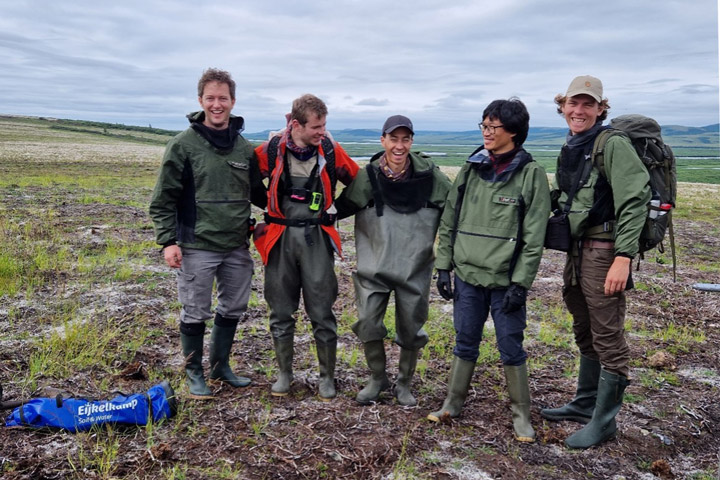
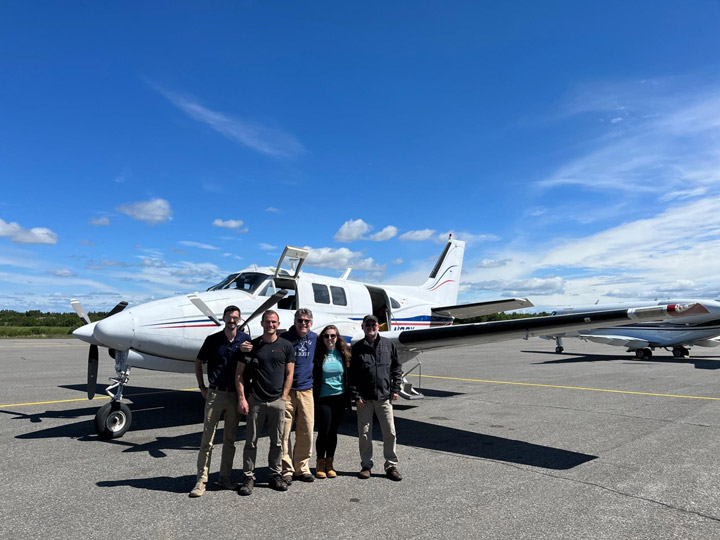
Lucas Ribeiro Diaz, Max van Gerrevink, Rebecca Scholten, Sonam Wangchuk, Thomas Janssen, Thomas Hessilt, and Sander Veraverbeke were part of this field expedition. Our team is part of the Climate & Ecosystems Change research group at the Vrije Universiteit Amsterdam. However, the success of this campaign would not have been possible without the help of our boat driver, David ‘Matty’ Beans, and our helicopter pilot, Savanna Paulsen. We are also grateful to the city of St. Mary’s and its people for warmly welcoming us during these weeks. Finally, Dr. Lisa Saperstein from the U.S. Fish and Wildlife Service in Alaska has provided tremendous help when we were organizing our campaign.
45 plots, 1,383 tussocks measured, 255 soil samples, 495 thaw depth measurements—numbers like these make us believe that we have just concluded a field campaign on some of the most densely sampled tundra fires in the history of science. Now, we have three more weeks of work ahead of us at the USGS soil laboratory in Anchorage. With lots of ideas in my head, I’m excited to see the new findings this valuable data can reveal!
I have just finished writing this post and I realize that perhaps it is too personal. But it could not be otherwise. Our science often blends in with who we are, our dreams and expectations. I leave St. Mary’s feeling fulfilled, I think I have always dreamed of being here. I leave the tundra sure that moments like this are the reason I decided to embark on this journey of doing research.
This tundra fires field expedition is part of FireIce (Fire in the land of ice: climatic drivers & feedbacks). FireIce is a Consolidator project funded by the European Research Council. FireIce is affiliated with NASA ABoVE. This blog post was written by Lucas Ribeiro Diaz, a Ph.D. student at Vrije Universiteit Amsterdam, studying arctic-boreal fires by combining field and remote sensing approaches.
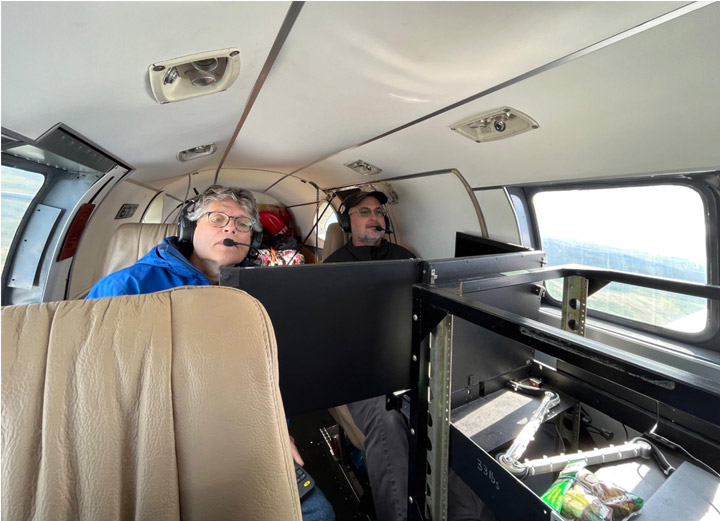
Just like the undulating terrain of the tussocky tundra we traverse, our days also take unexpected twists and turns. After a beautiful last day of sampling the East Fork fire scar along the Andreafsky River, where three moose visited us and delivered a personal goodbye, we were all excited for our first day of sampling the Apoon Pass fire scar via helicopter. But our spirits were momentarily dampened by news of Savanna, our pilot flying in from Nome, getting stuck in a thunderstorm on her way to our base in St. Mary’s, Alaska. Her arrival, delayed until early afternoon, was just the prelude to a challenge-laden morning.
Further issues emerged with our satellite communications device, requiring transatlantic collaboration with our colleagues in Amsterdam (many thanks to Thomas for his unwavering support!) These obstacles left us momentarily uncertain about the feasibility of flying at all that day. Miraculously, by 2 p.m., the looming cumulus of problems and bad weather began to disperse, and by 2:30 p.m., with a renewed sense of purpose, we embarked on our mission to sample the second fire of our field campaign.
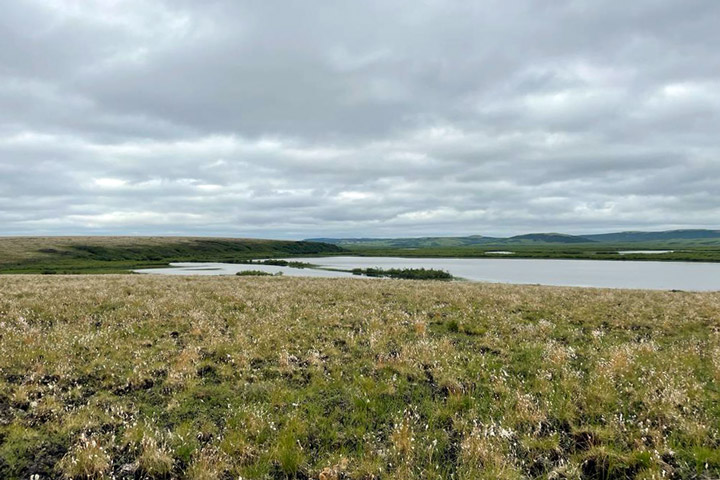
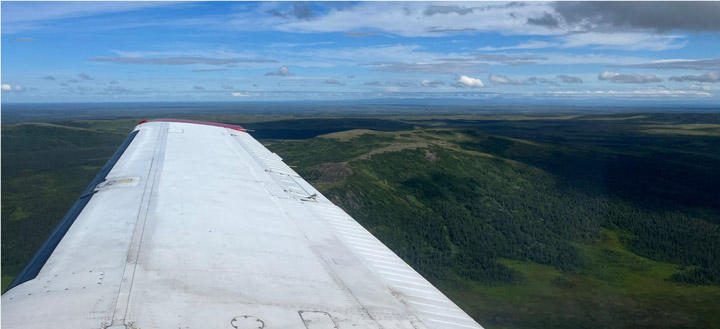
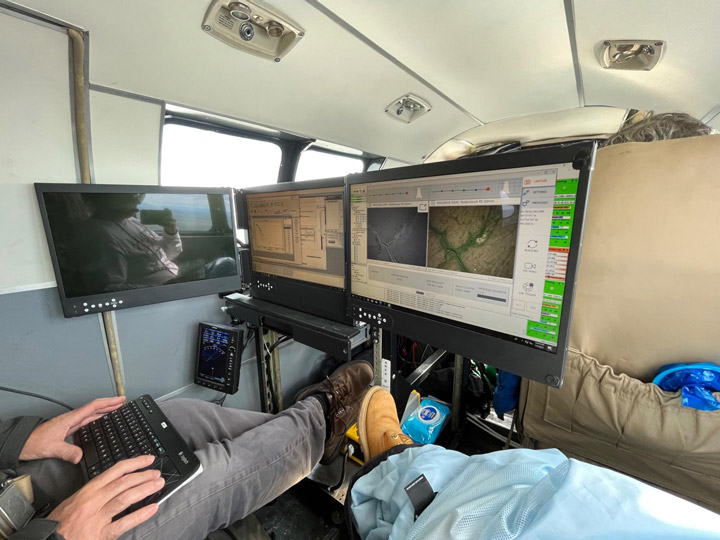
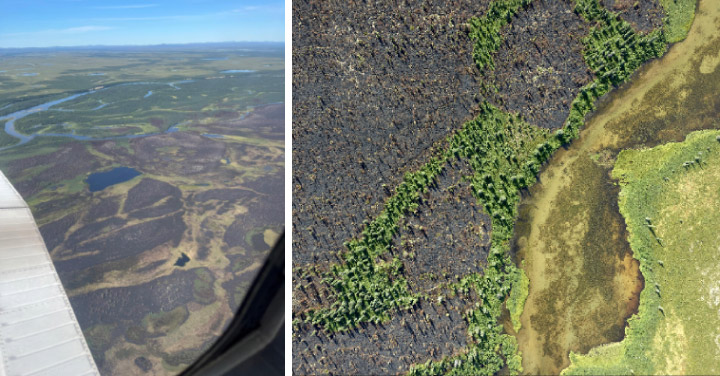
The flight itself proved to be a standout experience, treating us to a breathtaking panorama over the hilly tundra that we had sampled along the Andreafsky River in the preceding days. The Apoon Pass fire scar, though not far from the East Fork fire, is geographically quite different, as it is located in very flat lowland terrain. Flying over the last crests of the hill range provided a captivating sight of the vast lowlands extending in all directions.
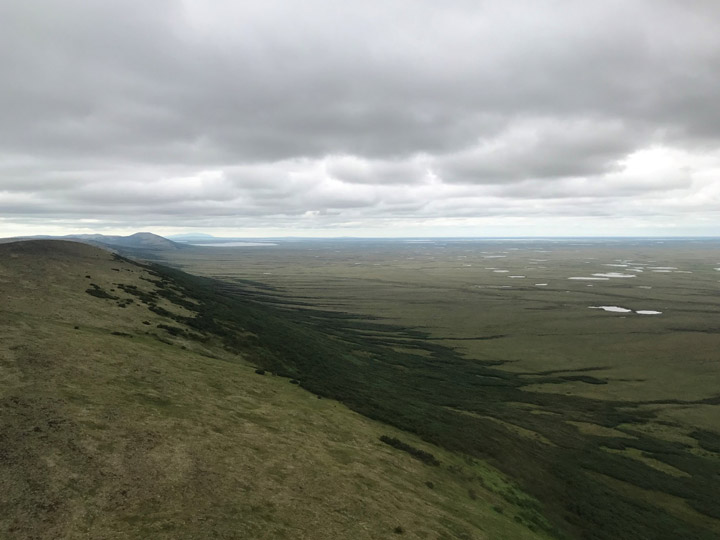
To our surprise, we were only able to spot the difference between burned and unburned tundra when descending to a relatively low altitude. This observation, together with the satellite imagery prepared by our campaign lead Lucas, led us to an initial conjecture that fire severity would be lower than what we had previously seen.
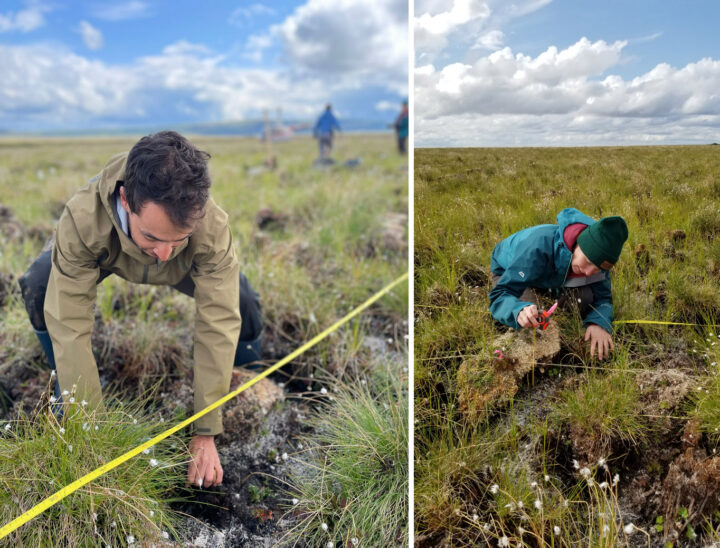
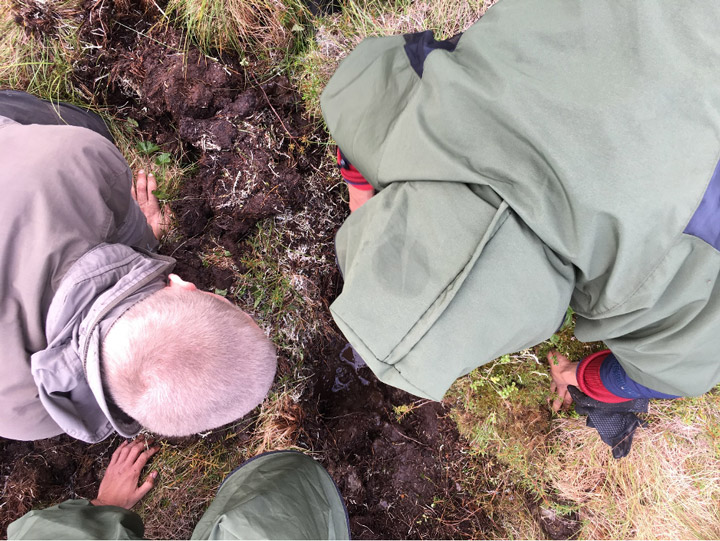
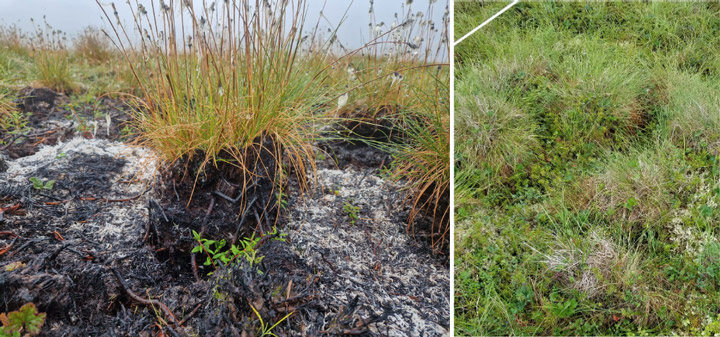
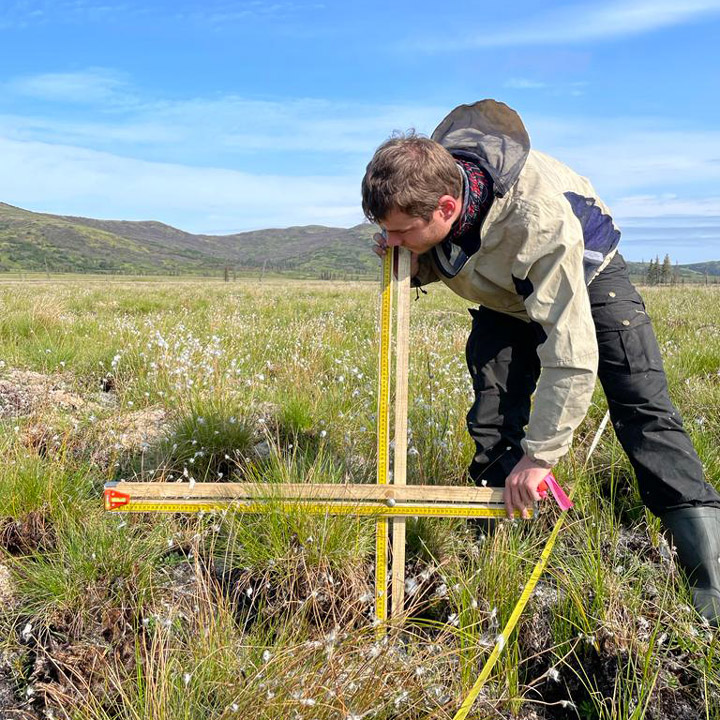
To systematically assess fire severity and carbon emissions in our plots, we are following protocols established by Mack et al. (2011) and Moubarak et al. (2023) for tundra fires in Alaska. We use two independent methods to estimate the burn depth based on the height of tussocks and Sphagnum (peat moss) patches in our plots. For the tussock-based method, we compare the height of tussocks that survived the fire with the height of tussocks in unburned locations. This gives us an estimate how much duff and other organic material has been combusted. For the Sphagnum-based method, we connect different moss patches of similar height with a thread and measure the distance from the thread to the surface at 25-centimeter intervals. This will give us an overview of the variability in burn depth within our sampling locations.
These two measurements will allow us to quantify the amount of carbon combusted per plot, which we can relate to the satellite imagery, as well as to the thickness of the active layer we are measuring at each plot to assess how the fire is affecting the permafrost.
In the end, to our surprise, our first helicopter day turned into one of the best sampling days we had during the campaign so far. We were gifted with beautiful, sunny weather until 9 p.m., and sampled even more plots than we had initially expected. We have now become a well-oiled machine, capable of sampling a plot within a mere hour and a half. Having the helicopter with us at all times offered an invaluable advantage—the ability to swiftly transport parts of our team to nearby sampling sites. After having returned to our base, we are excited for another day in the beautiful tussock tundra of southwestern Alaska—keeping our fingers crossed for another couple of days of good weather!
In 2022, severe lightning ignited many fires in Alaska. Notably, several exceptionally large fires burned in the tundra of Southwest Alaska, an ecosystem that is traditionally less prone to fire. While our understanding of the carbon emissions of boreal forest fires in Alaska and Canada has strongly advanced in recent years thanks to the work of several teams within NASA’s Arctic-boreal Vulnerability Experiment (ABoVE), the impacts of these tundra fires on the ecosystem’s carbon balance and permafrost has remained less well known.
Our Climate and Ecosystems Change research group from the Vrije Universiteit Amsterdam in the Netherlands is currently in Southwest Alaska to fill these critical knowledge gaps. Our team received tremendous help of Dr. Lisa Saperstein from the Alaska Fish and Wildlife Service in organizing the campaign. Lisa will also start a field campaign in the same fires in the next few days and we plan to pool our datasets to maximize synergies between our efforts.
The 2022 East Fork and the Apoon Pass fires together burned more than 100,000 hectares (380 square miles) of primarily tundra landscapes in Southwest Alaska. They were among the largest tundra fires on record for the region.
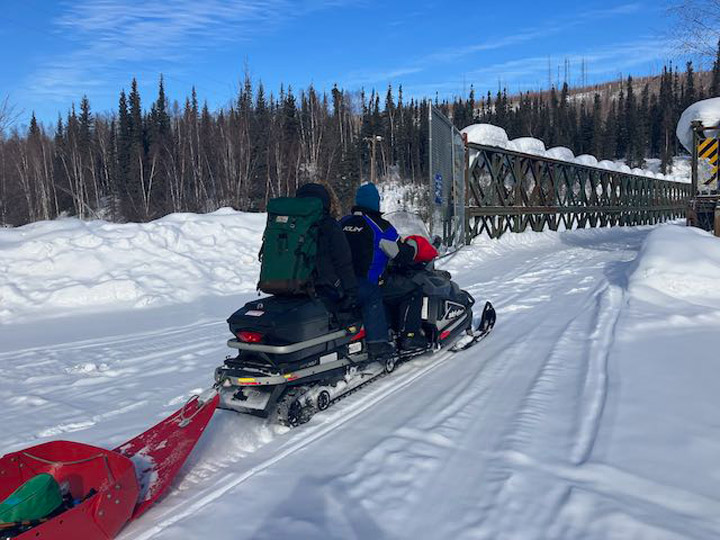
Our basecamp is the village of St. Mary’s, located just west of the East Fork fire on the Andreafsky River. For the first part of our campaign, we are taking a boat upstream to access the fire scar. We are looking for burned tussock tundra sites, where we can measure the effects of the fire on the vegetation, soils, and permafrost in our plots. We are also sampling unburned tundra sites, which provide us a reference of the conditions without fire disturbance. During the last part of our campaign we will access sites in the remote Apoon Pass fire by helicopter.
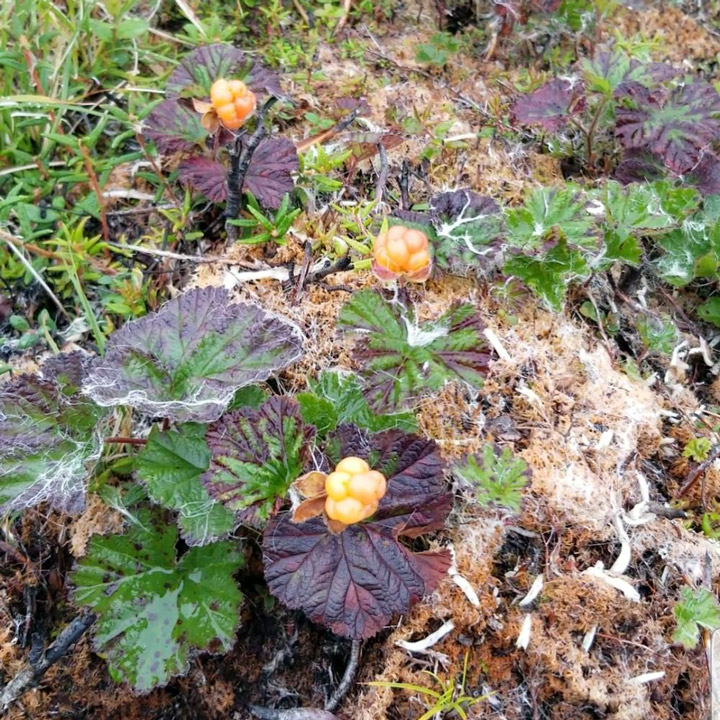
The local community heavily relies on the landscape for subsistence activities, like hunting and berry picking. Our boat driver, Matty Beans, is native to the area and is extremely helpful in bringing us to the right places. A large concern of the community is how the fire has effected the abundance of berries in the burned tundra. Our preliminary observations indicate that the cloudberries, locally also called salmonberries, were abundantly present in the burned sites. However, this was not the case yet for blueberries.
So far, we have been extremely lucky with mostly dry weather and only a little bit of rain. However, the dry weather has affected the water levels in the Andreafsky River. We came across collapsed river banks and exposed sand banks in the river. Our boat driver has switched to his jet boat so that we can continue on, even in more shallow parts of the river. The weather is changing though, with rain coming in for several days. This is good for the water levels, but the colder and rainy weather may make our sampling efforts more challenging.
After seven days and 19 plots of sampling, we are now taking a well-deserved rest day. I used this rest day to write this blog and digitize some datasheets. Over the next four days, we will continue sampling along the river and then use a helicopter to access the Apoon Pass fire site for more sampling.
This field expedition is part of FireIce (Fire in the land of ice: climatic drivers & feedbacks). FireIce is a Consolidator project funded by the European Research Council. FireIce is affiliated with NASA ABoVE.
The boreal forest is Earth’s northernmost forest. It circles the Earth at high latitudes, covering large parts of Russia, Canada, Scandinavia, and Alaska. These forests are some of the largest intact forests on Earth. They store a large amount of carbon—as much as (if not more than) is stored in tropical forests. The trees use photosynthesis to grow, and in the process, they take in carbon dioxide from the atmosphere. Carbon dioxide is an important greenhouse gas and a driver of global climate change, which is why it is vital to understand the rates of the transfer and storage of carbon between the atmosphere and the boreal forest.
Due to their vast area and remoteness, boreal forests are difficult to monitor from the ground. Data from satellites provide the means for observing these forests’ condition and detecting change across wide areas. In our project, “Clarifying Linkages Between Canopy Solar Induced Fluorescence (SIF) and Physiological Function for High Latitude Vegetation,” our team from University of Maryland Baltimore County, NASA’s Goddard Space Flight Center, and the University of Texas El Paso is working to develop advanced approaches to using satellite data to describe boreal forest productivity and detect stress responses. Our project is part of the NASA Terrestrial Ecology program’s Arctic-Boreal Vulnerability Experiment (ABoVE), a large-scale field study in Alaska and western Canada, whose overall goals are to make use of NASA technology to gain a better understanding of ecosystems at high latitudes, their responses to environmental change, and the effects of those changes.
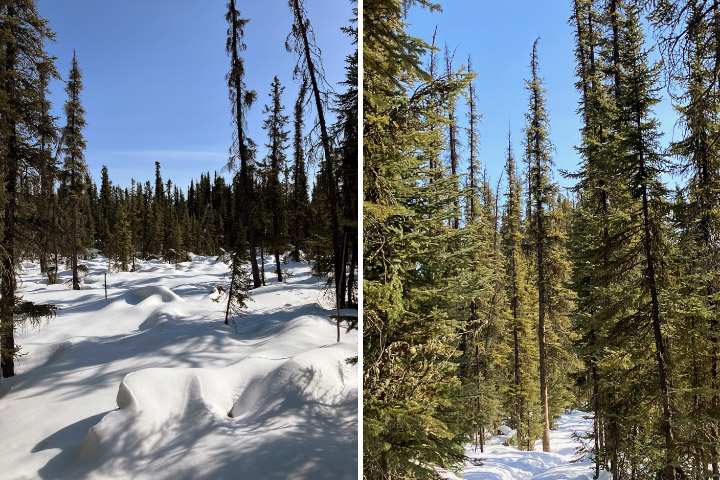
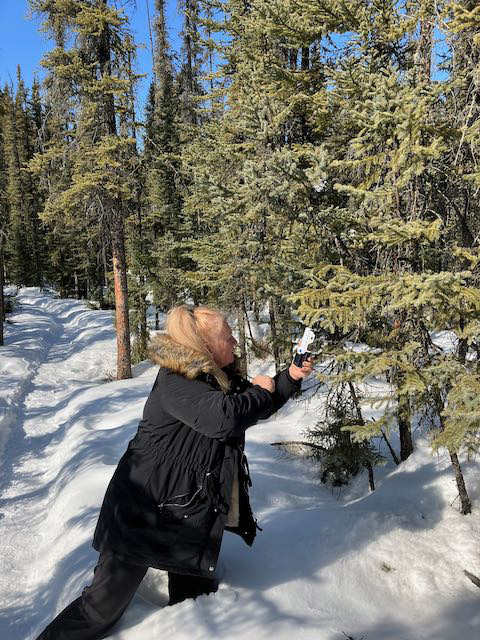
A large proportion of the trees in the boreal forest are conifers, such as spruce trees (images above). These trees keep their green needles all year long. This makes it hard to determine when they start photosynthesizing in the spring, compared to deciduous trees, like oaks, where we can clearly see the growth of new green leaves in the spring.
The timing of the start of the growing season is key to determining the overall productivity of the forest and can be a useful predictor of possible stress events later in the summer. So, one of the goals of our project is to find ways to use light to detect when these evergreens “turn on” photosynthesis in the spring and actively start taking up carbon from the atmosphere.
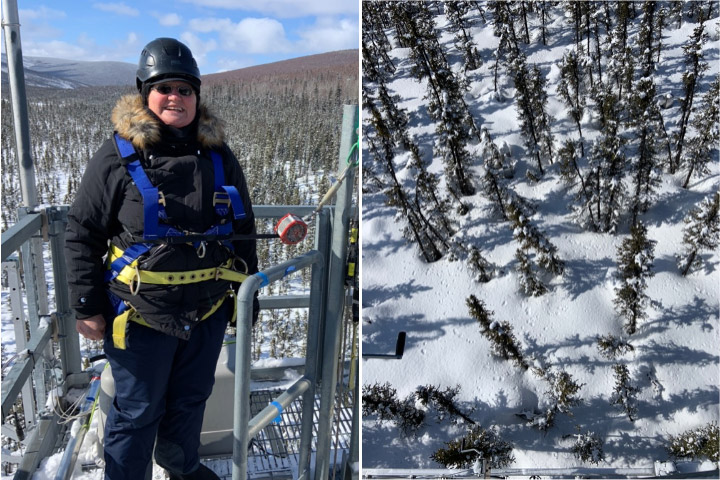
This brought team members to Fairbanks, Alaska, right in the heart of the boreal forest. We arrived with our instruments in April 2023 to observe the very start of the boreal growing season. Our instruments use different methods to detect the onset and rate of photosynthetic activity in plants. One method we are using to identify photosynthetic activity in the evergreens is based on light that is actually emitted from the trees. Plants absorb light to power photosynthesis, but in the process of photosynthesis some of that light energy is radiated out from the plant; this is called chlorophyll fluorescence. This fluoresced light is very dim, which is why we don’t see plants glowing, but we can use sensitive instruments to measure fluorescence at leaf and canopy scales, which can even be done with instruments on satellites from space.
A second method is to detect very subtle changes in the color of the needles that are related to changes in the pigments in the leaves. Pigments such as chlorophyll, which makes leaves green, and carotenoids, which cause the yellow color of leaves in the fall, control potential rates of photosynthesis as well as provide protection to the leaves when stressed. These color changes are also subtle enough that we don’t see them with our naked eyes, but our instruments can measure and detect these pigment changes.
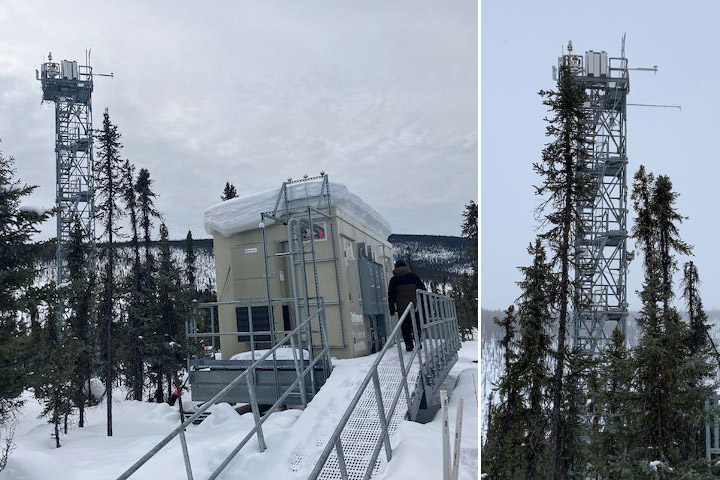
Instruments that are already on the flux tower measure the transfer of heat, moisture, and carbon dioxide between the atmosphere and the forest (images below).
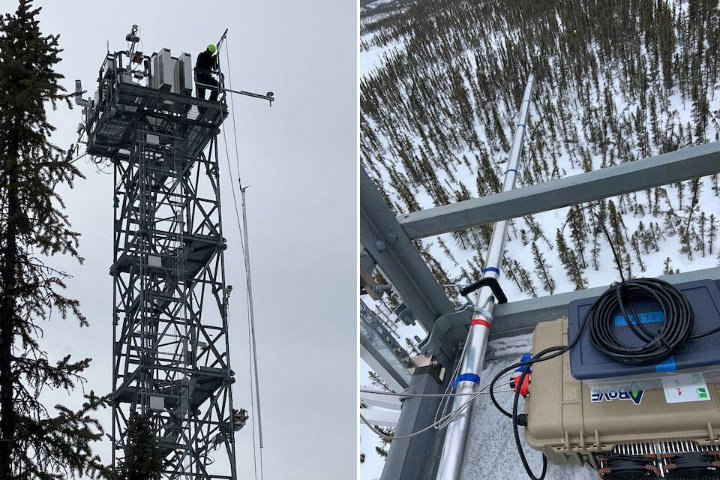
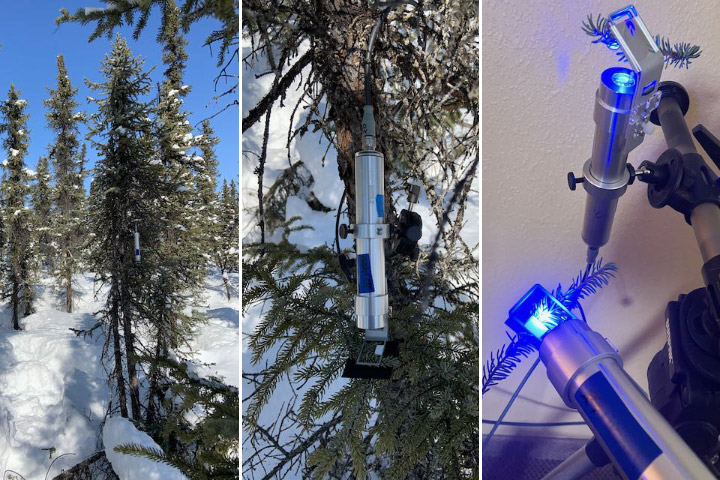
With the help of Jeb Timm, a NEON tower lead technician, we mounted our FLoX (Fluorescence Box) on the top of the tower. The FLoX looks down on the forest and measures the reflected light and solar induced chlorophyll fluorescence every few minutes continuously through the growing season (images below). FLoX measurements are similar to the data satellites provide, but with far more detail.
From the flux data we can determine photosynthesis rates and compare them with our fluorescence and reflectance measurements for relating the remotely sensed optical measurements to forest productivity. The continuous measurements allow us to examine the effects of varying light levels, moisture, and temperatures on the forest.
Near the flux tower we also put our MONITORING-PAM (MoniPAM) instruments whose probes actively illuminate individual spruce shoots with controlled pulses of light to measure fluorescence and photosynthetic processes at the leaf level (images below).
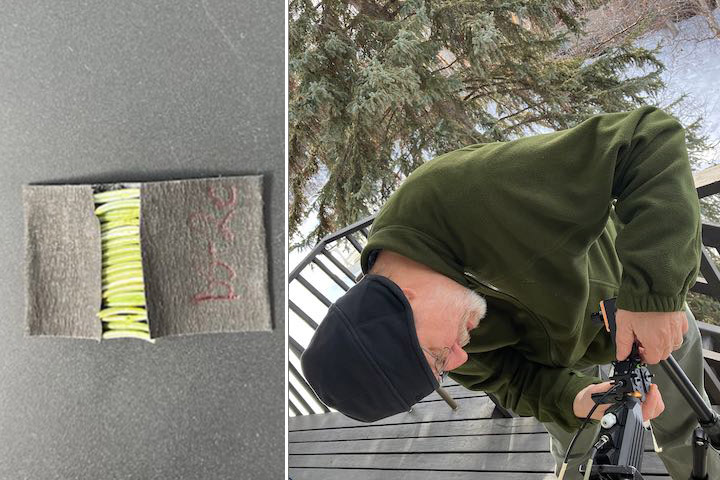
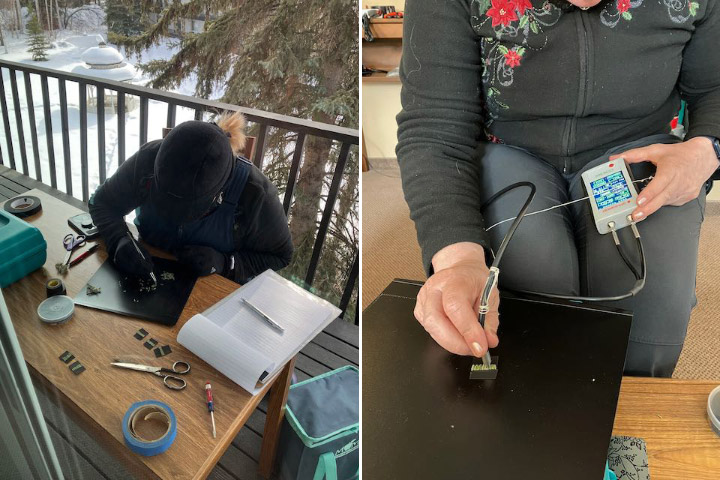
Besides setting up our instruments to catch the start of the growing season, we were hoping to be around when the spruce started to photosynthesize. This would allow us to test if we could detect the onset of photosynthesis through changes in needle reflectance due to changing pigment pools and/or fluorescence measured using a special leaf clip. To get consistent measurements using the same amount of needles, we had to pull off the individual tiny needles then line them up to make a solid mat to measure. And because photosynthesis and fluorescence are temperature sensitive, we had to make our measurements at the temperature the needles experience, so we worked on the deck outside in the cold (images below). The deck looked out on a big white spruce that was full of busy red squirrels who chattered and scolded us while we made our measurements.
Unfortunately, the temperatures mostly stayed below freezing the entire time we were there, so we didn’t get a chance to measure needles as they became photosynthetically active.
While we were there, there was also a NASA funded study of snow called SnowEx. In this part of the SnowEx study, researchers were studying changes in snow characteristics during the thaw period. The SnowEx field team made measurements of the snow on the ground, and NASA flew the Airborne Visible-Infrared Imaging Spectrometer – Next Generation (AVIRIS-NG) imaging system on an airplane, collecting high resolution canopy spectroscopy measurements. We plan to make use of the airplane imagery in our study to see if we can identify changes in tree reflectance (which is noise to the snow scientists) indicating the start of photosynthesis.
We will return in late July to collect measurements during the period of peak summer forest productivity.
In loving memory of Larry Corp.
Goddard’s LiDAR, Hyperspectral, & Thermal Imager (G-LiHT) is an airborne instrument designed to map the composition of forested landscapes.
The G-LiHT instrument has a number of sensors that each serve a specific purpose. There are two LiDAR sensors that produce a series of LiDAR-derived forest structure metrics including a canopy height model, surface model, and digital terrain model. These models allow us to measure tree height and biomass volume.
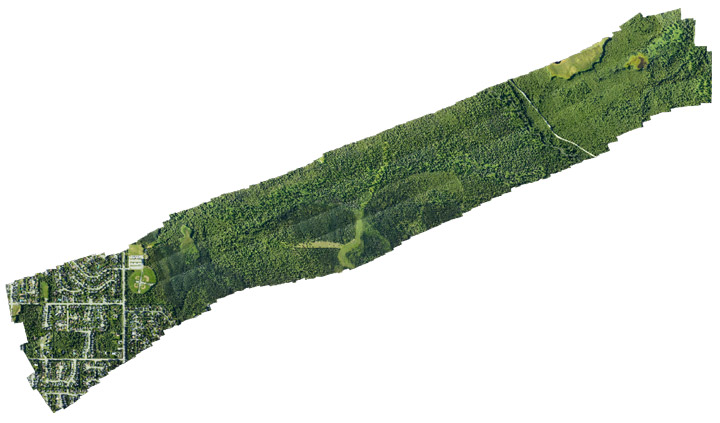
Additionally, there are two cameras: one visible and one near-infrared (NIR). The visible and NIR bands acquired by the two cameras are paired to produce 4-band imagery. The 3-centimeter resolution photos taken by these cameras are aligned to build orthomosaics, which allow us to visually observe and identify changes in forest composition.
G-LiHT also has a hyperspectral sensor to acquire spectral information at a coarser resolution. These data can be used to identify vegetation composition and measure photosynthetic function as well as calculate vegetation indices at a fine spectral scale of 1 meter using radiometrically calibrated surface reflectance data.
The thermal sensor measures radiant surface temperature which allows us to create 3D temperature profiles derived from structure-for-motion. Thermal data provides us with information on the functional aspects of forest canopies. As photosynthetic function is related to evapotranspiration, we can observe that hotter canopies are more stressed relative to surrounding canopies.
The G-LiHT airborne mission supports multiple groups including the U.S. Forest Service (USFS), the USFS Geospatial Technology and Applications Center (GTAC), and the University of Alaska Anchorage.
The USFS is creating a forest inventory for the state of Alaska, and G-LiHT measurements collected over Forest Inventory and Analysis (FIA) plots are a cost-effective method of forest inventory. G-LiHT data will also help to improve regional estimates of aboveground forest biomass and terrestrial ecosystem carbon stocks. GTAC uses G-LiHT data measurements for algorithm development. USFS Geospatial Technology and Applications Center will use G-LiHT data acquired over FIA- and GTAC-measured ground plots and between these plots to map forest characteristics on federally managed lands, including forest type, biomass, vegetation structure, tree and shrub cover, and more. Data will also be used to guide future inventory efforts in coastal Alaska using methods developed for interior Alaska.
This field campaign also acquired repeat data over Fairbanks, Alaska, to measure changes in permafrost.
G-LiHT image data was reacquired over spruce beetle monitoring transects stretching from the Kenai Peninsula in the south to Denali National Park in the north. These transects were last measured on the ground and with G-LiHT in 2018, during the peak of a spruce beetle outbreak, and changes in vegetation structure and spectral reflectance will be used to evaluate the long-term mortality and growth of these forests.
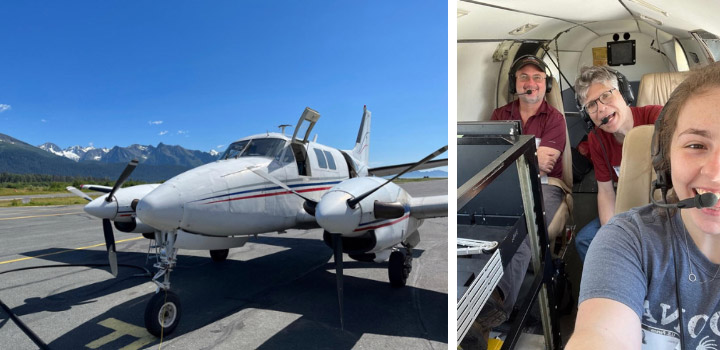
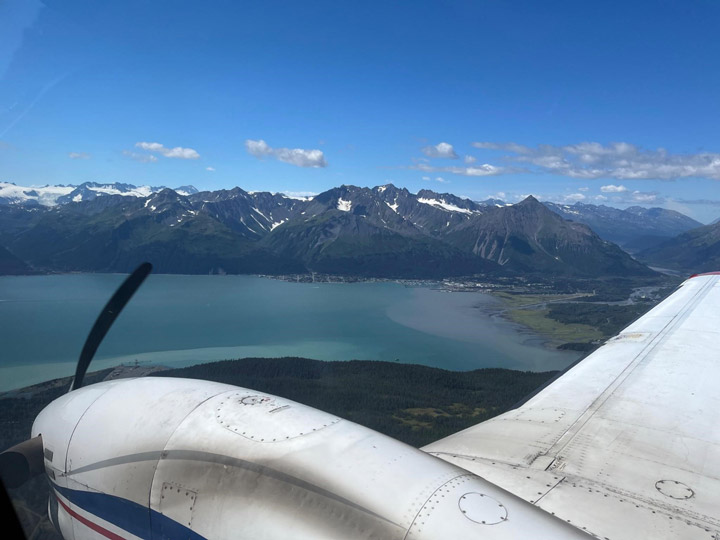
Our Alaskan field campaign started with an integrative test flight in June. Our team of three loaded up G-LiHT into a vehicle much too small and drove to Dynamic Aviation in Bridgewater, Virginia. We spent the first day installing the instrument into a 1960s King Air A90.
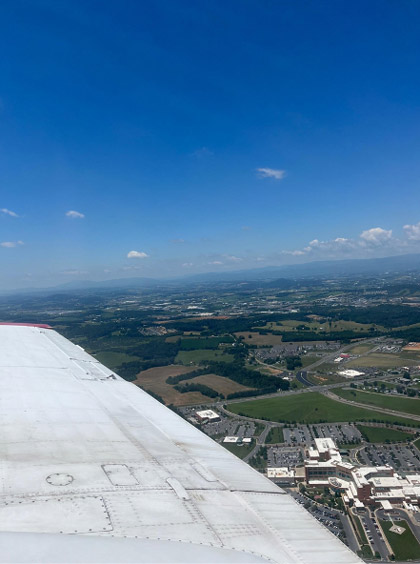
The second day was all about flying. We needed to make sure G-LiHT didn’t interfere with any of the aircraft’s systems. Additionally, the functional test flight over Harrisonburg, Virginia, allowed us to verify that G-LiHT was functioning properly. We flew in a grid pattern over the city which allowed us to geospatially align the data products from all of G-LiHT’s sensors.
The integrative test flight was a success. We installed G-LiHT properly with no issues and obtained the information we needed. Once we received the thumbs up to proceed with our campaign, the pilots loaded up the plane with supplies and headed out to Kodiak, where we would meet them the following week.
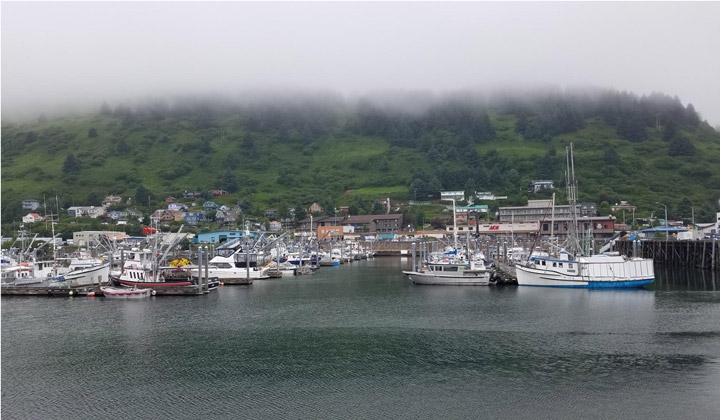
Our plan for the field campaign was to arrive in Kodiak, Alaska on July 6 and stay until the end of the month. We chose Kodiak as our hub because it was a convenient location to our flight lines. Unfortunately, despite the ideal location, poor weather prevented us from flying for the first three days of the campaign.
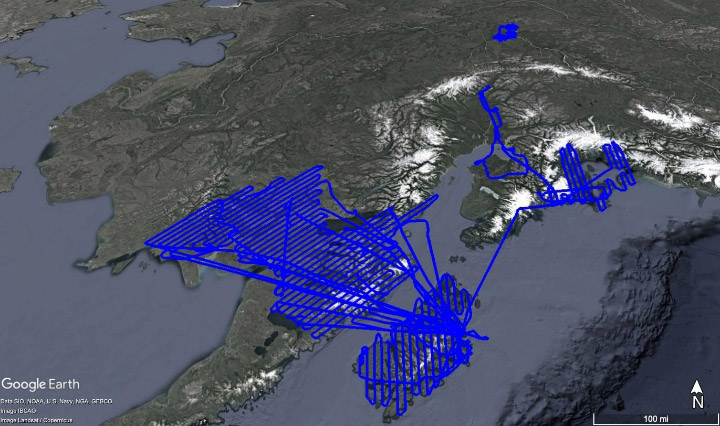
Once we were finally able to get in the air, we collected data over the forests near Iliamna.
Most of our days consisted of our team meeting in the hotel for breakfast at 8 a.m., discussing weather and flight plans for the day, and then driving to the airport to prepare the plane and G-LiHT for flying. Depending on how many flight lines we were able to complete, we often stopped in King Salmon or Iliamna to refuel the plane and then went back out to fly more lines before returning to Kodiak.
Our group was interested in measuring the effects of forest fires on vegetation in the Dillingham region. There were several burned areas to the west of the Nuyakuk River and east of Cook Inlet.
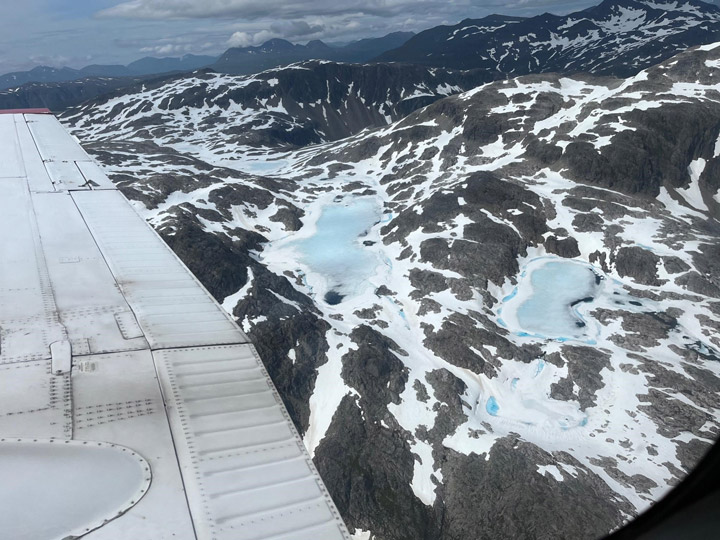
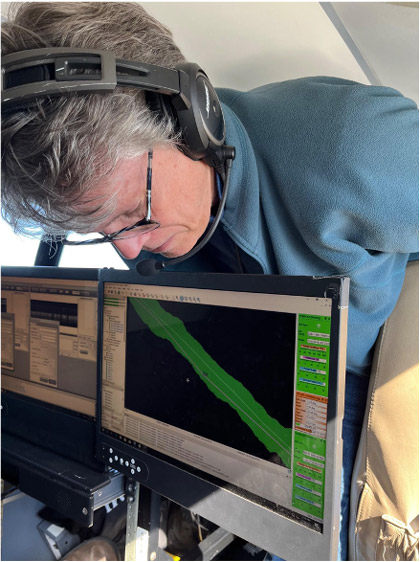
Toward the end of the campaign, we decided to transit to Fairbanks because the weather over the rest of our other flight lines didn’t look promising. If there were clouds below the plane at 1,100 feet, they would obstruct the instrument’s view and cast shadows on our data. We had to closely monitor the weather every morning. Additionally, we were unable to fly in rain or smoke as it would adversely affect the LiDAR sensors’ data returns.
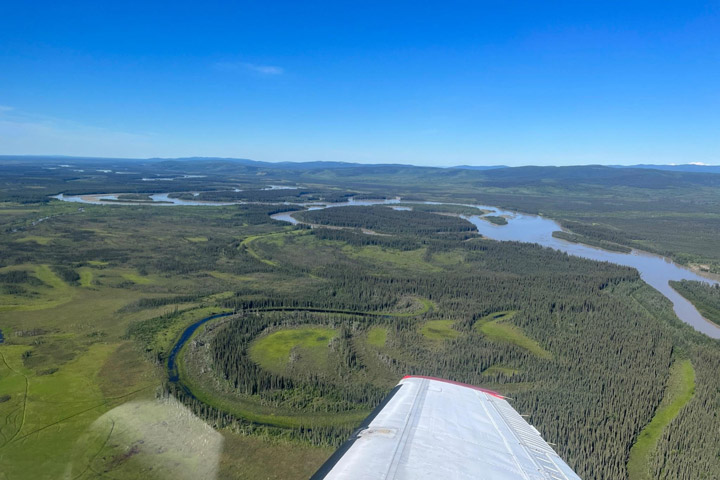
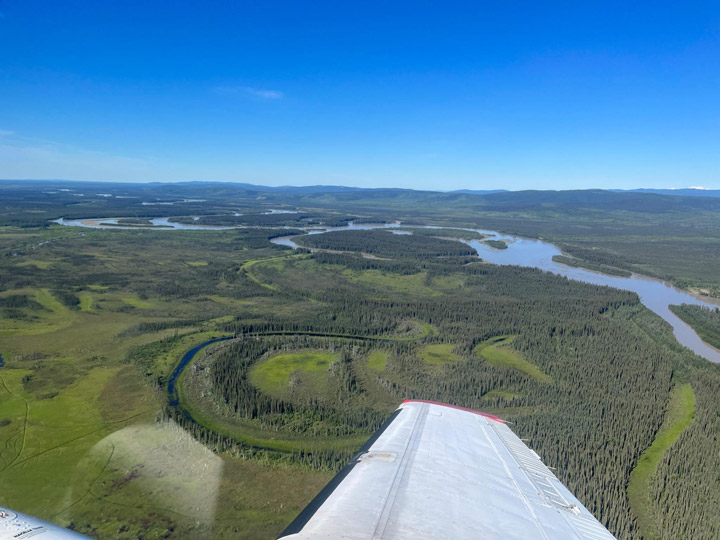
One geological feature we saw extensively in the southwest was the oxbow lake. Also called cut-off lakes, these lakes have formed when meandering rivers erode at points of inflection because of sediments flowing along them to the point where two parts of the river will join together, creating a new straight part of the river—essentially “cutting off” the curved lake piece. This created an oxbow lake. Once the lake has fully dried out, it becomes a meander scar. We noted the difference in vegetation growing back within the oxbow lakes and meander scars and how this differs from surrounding vegetation patterns.
We had only planned to spend one night in Fairbanks, then transit back to Kodiak the following day. However, the weather had other plans for us. We ended up having to fly to Anchorage the following day because of extremely low cloud ceilings in Kodiak that made it too dangerous to land there. It worked out in the end, and the team was able to see more of beautiful Alaska and collect data over Anchorage and the Chugach region. It just goes to show how quickly things can change during a field campaign.
We collected data in the Campbell Creek region west of Anchorage. The data include visible and near-infrared photos which were composited into 4-band high-resolution orthomosaics and used to visually observe and identify changes in forest composition.
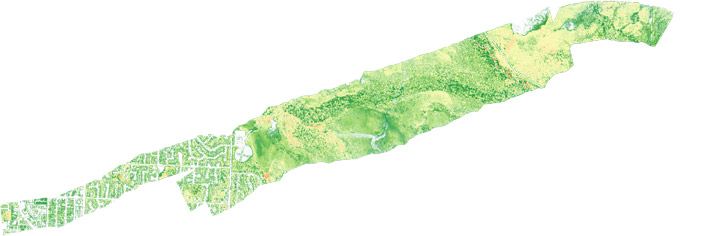
In addition to the high-resolution orthomosaics produced from the G-LiHT’s near-infrared and visible cameras, LiDAR data was processed to create various 1-meter resolution forest structure metrics including Digital Terrain Model (DTM), Digital Surface Model (DSM) and Canopy Height Model (CHM). These metrics are used to measure tree height and biomass volume. The CHM raster below was created by subtracting the DTM from the DSM.

After collecting data in Anchorage and the Chugach region of Alaska, the team flew back to Kodiak and finished data acquisition in the southwest.
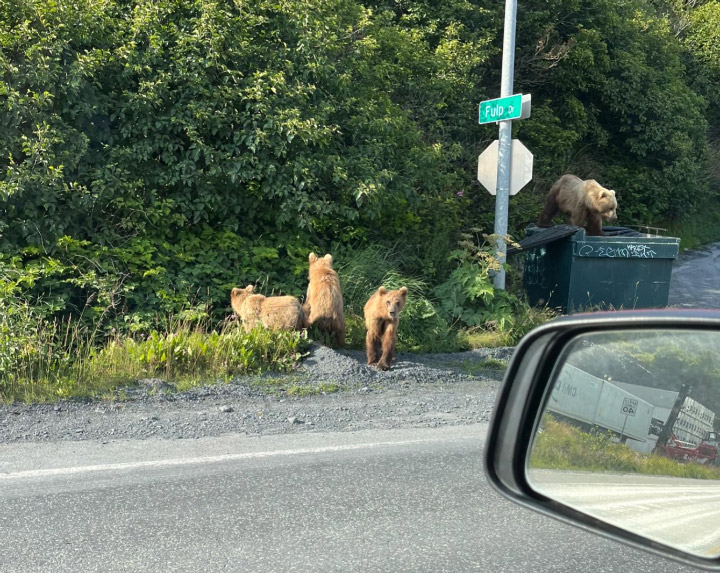
And of course it wouldn’t be Alaska without some wildlife. The day before leaving Kodiak, I got to see not just one bear—but a family of four! Cars were honking to scare the bears out of the road, but luckily I had enough time to snap a picture before the bears ran off into the woods. It was the perfect end to an exciting field campaign.