
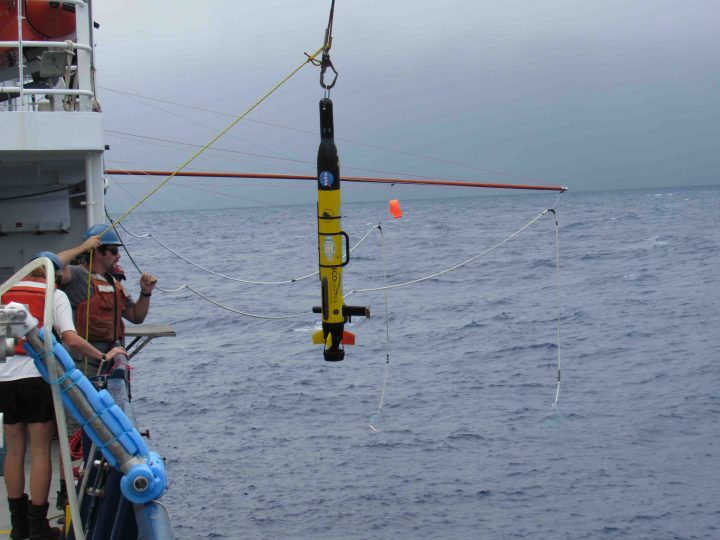
Ecomapper with the salinity snakes.
As the Program Manager at NASA Headquarters responsible for our satellite mission (Aquarius) dedicated to measuring the surface salinity of the ocean, I set in motion some work to better understand and measure surface salinity directly, at sea. Even as Aquarius ended in 2015, its role has been filled by another mission (SMAP), so the intense study of surface salinity and what it tells us about the water cycle on Earth continues. These missions, their NASA program manager, and the community of science have spun off a new “cottage industry” (as space missions often do).
The central question motivating the industry is, “who can provide NASA with actual sea-truth on the sea surface salinity?” Buried in the answers to that question is the growth of new technology and some very challenging field work!
SPURS-2 is the apogee of this new industry. Aboard Revelle, we have all manner of ways to sample the upper-most layer of the ocean, away from the disturbances of the ship. The objective is to see “the things we see from space” but could not observe before with older oceanographic technology.
Julian Schanze.
Before proceeding, you need a super-short physical oceanography lesson. The upper ocean is mixed by the wind. This “mixed layer” may be quite deep – hundreds of meters – for example, under winter storms with weak insolation by the sun. The mixed layer may be quite shallow or non-existent when there in little or no wind, and when there is heating or fresh water input at the surface. Wind over much of the ocean is sufficient to keep the upper 5-10m mixed.
Thus, for much of the ocean the “sea truth” for surface salinity is the same as having a salinity in the mixed layer. Argo floats, of which there is a standing flotilla of around 4000 in the ocean, measure salinity in the upper ocean between 2000m depth and about 5 m depth. They shut-off in the last five meters before they surface, to transmit their data, in order to protect their sensitive salinity-measuring cell against the bio-films on the ocean surface. So, they provide a great estimate of surface salinity everywhere in the ocean where the mixed layer is greater than about 5 meters. That is a very large portion of the ocean! Argo is the workhorse for calibrating salinity missions against “sea-truth.” But it leaves us with some unanswered questions.
What remains is what has spawned our small cottage industry. We can see from space that there are significant areas of the tropics where surface salinity is much less than indicated by Argo maps of “surface salinity” (really 5 m salinity). What is really going on there and why isn’t the Argo system working for us? What was discovered is that in these particularly rainy parts of the planet (mostly the Intertropical Convergence Zone), where their are low winds, the salinity of the upper ocean is lowered by rainfall quite dramatically and that fresh water can ride upon the salty water below quite well until wind picks up to mix it down. From space one can see a variable and dynamic “East Pacific Fresh Pool” that rides atop the ocean regularly monitored by Argo. The same phenomenon happens with large river plumes that reach the open ocean (such as the Amazon, Congo, or Mississippi) where satellite salinity is measured.
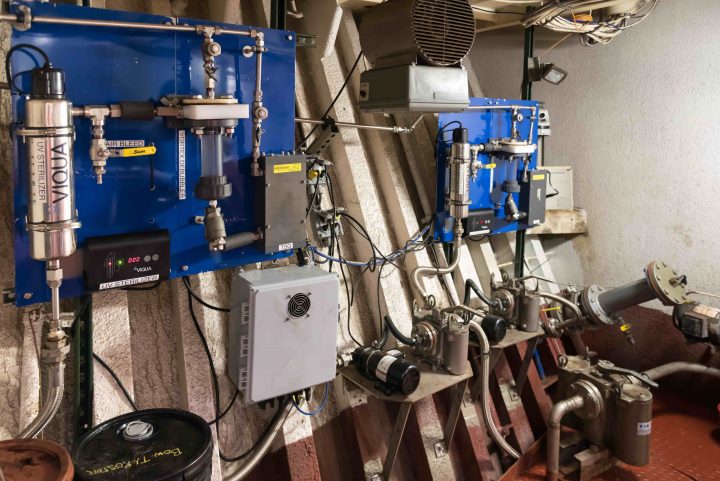
The thermosalinography system in the bow of Revelle. (Photo by J Schanze).
The “cottage industry” has manufactured ways to measure and monitor the phenomenon of this “fresh pool” with shipboard and autonomous platform technology. For examining fresh “puddles” and the larger fresh “pool”, the Revelle has “extra” salinity sensors in its bow to measure at 2m, 3m, and 5m depths. Julian Schanze has added on an outboard boom “the salinity snake” to catch and measure water from the surface. The UW APL team led by Kyla Drushka has the Surface Salinity Profiler to measure salinity at many levels from the surface to 1 m depth. A WaveGlider has been outfitted with a salinity “rake” to measure salinity at 10 levels in the upper 1 m. Ecomapper can be set on a mission to profile the upper few meters of the ocean for hours at a time. Finally, this issue has also spawned new Argo floats that measure salinity in the upper 5 m without compromising there “deeper” mission. SPURS-2 is the expedition to the East Pacific Fresh Pool that assembles all these good works of the “measure salinity in the upper 5 m of the ocean for NASA” scientific community.
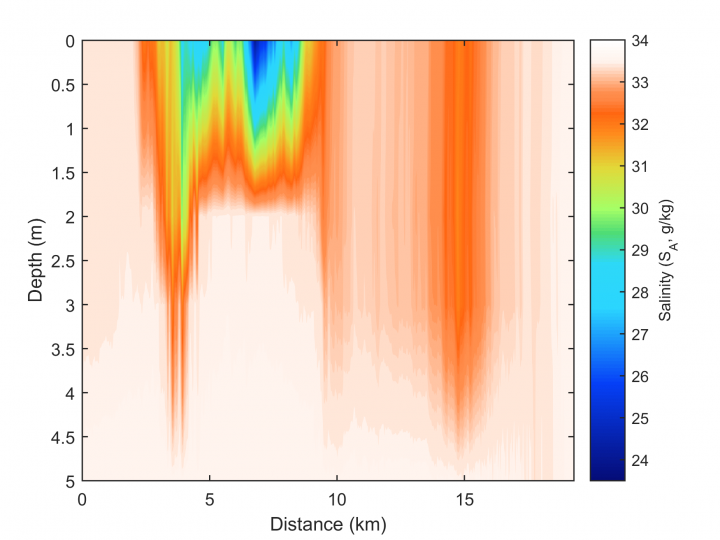
Julian has prepared a plot showing salinity in the upper 5 m during one of the rain events sampled by Revelle. It shows one a plot of salinity (in color) versus depth in top 5 m and distance along track. The event or “puddle” has low salinity in just the upper 2 m or so, spread over about 5 km of distance. These are exactly the kind of features that would be missed by a standard Argo float but show up in satellite data.
We return to shore with a data set rich in information about the workings of rain, surface salinity, stratification of salinity in the upper ocean, and upper-ocean mixing. From its analysis we will better understand the east Pacific as seen from space and know how to validate the salinity products from Aquarius and SMAP for these special areas. Ultimately these results help us understand the ocean’s role in the global water cycle. Not bad for a cottage industry spun off from the space program.
Tags: ocean salinity, oceanography, SPURS, SPURS2
If I’m interpreting correctly, there are times when the ocean surface contains pools of “fresh water” because the saline water below the surface has not been stirred-up by winds. Interesting.