Sea Sweep gently surfs
Generating aerosol
On the Atlantic
While some aboard the Atlantis are fighting bubbles with rigor (see September 1, 2017 post), the atmospheric chemists on the bow of the ship are busy generating them. Not the same ones that the biologists were battling in the earlier post, but new ones that mimic the production of sea spray aerosol by waves in the ocean.
To do this, we deploy a clever aerosol generator alongside the ship that we call Sea Sweep. The Sea Sweep injects clean air into the surface layer of the ocean to create many bubbles that pop and produce sea spray aerosol. We suck that aerosol up to take a multitude of samples and measurements for both our own group and other researchers as part of the NAAMES project.
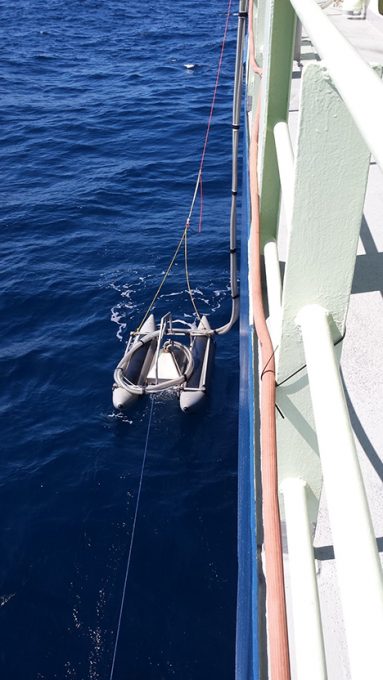
The NOAA/Pacific Marine Environmental Laboratory (PMEL) Sea Sweep on the port side of the R/V Atlantis during bubble/aerosol generation.
Last night, just as we were getting ready to take a subset of our samples, we noticed our aerosol counts drop dramatically (from ~1,000 down to 100..then down to 10!). Upon investigation, it turned out our air compressor had a broken belt. Alas, we did not have a spare one with us (you can be sure we will have at least two next cruise!). Thankfully, the ship was able to provide us with a suitable substitute and we were able to get back to generating our bubbles with only a little hiccup. We are very grateful to the crew of the R/V Atlantis!
Written by Lucia Upchurch and Derek Coffman
University of Washington Joint Institute for the Study of the Atmosphere and Ocean
NOAA Pacific Marine Environmental Laboratory
A Light Puzzle
Today we were able to finish our first official station of NAAMES 3! Our group, the UCSB Optics team, saw a whirlwind of activity as we deployed half a dozen different instruments to begin to characterize all the different ways that light interacts with the ocean. You could call us the most superficial of teams, where we only care what things look like, but we do really care about what things look like!
Our goal is to model how light behaves in response to all the different biological, chemical, and physical things that all the other teams here at NAAMES are measuring so that we can move these models to ocean-monitoring satellites so they can tell us what might be happening in the global ocean. In a nutshell, we do math with colors!
The underwater light field is like a giant puzzle, with all the pieces coming together in a unique way. You can actually begin to measure one set of pieces, the apparent optics, with your eyes. This is what the ocean apparently looks like based on all the things in it and how it is lit up by the sun. If you have ever gone scuba diving or looked at underwater photos, you’ve probably noticed how blue everything looks. Where did all the red go? Based on optical properties, different colors of light disappear at different rates as you go deeper. We can model how quickly certain colors disappear relative to others to get an idea of things like how much plankton or dirt or dissolved materials are actually in the water!
On the other side, we have the inherent optical properties, those that are inherently there no matter how bright or dark it is outside. People sometimes wonder why I’m out at 3AM and 11PM making casts in the middle of the night for optics, and it’s because we’re still getting great data! The instruments that measure the inherent properties are literally the flashiest ones we have. Our IOP (Inherent Optical Property) Package is basically a disco ball of lights. One instrument on the package works by flashing a very specific color of light out at the water and then recording what “bounces” back at the sensor. Another fires a laser and records how much that laser bends based on the size of the microscopic particles in the water. Yes, we fire bendy lasers. I love optics.
All in all, each instrument gives us a different piece of the puzzle. Once we get enough pieces of the underwater light field, we’ll be able to more effectively look at the oceans from satellites and get a sense of what’s happening globally in the ocean at a moment’s notice. We’ll shine some light on Earth’s final frontier.
Written by James Allen
Sampling at the bow: measuring ocean-atmosphere exchange
One of the main objectives in the NAAMES mission is to understand what gases and particles present in the surface ocean get into the atmosphere and influence clouds and climate. To help answer this question, our group measures gases present in both the ocean and atmosphere, as well as the rate at which the gases are exchanged- that is, how quickly they go into or go out of the ocean.
To do this, we need to observe the natural wind motions and gas concentrations with as small an influence from the ship as possible. The ship disturbs the natural wind field and can also be a source of gases and particles (especially from its exhaust stack). So we go up and out! We install the inlet on the forward mast, which minimizes these impacts from the ship itself. This is where we can get the air most representative of the North Atlantic environment while on board.
So before leaving the dock we lower the forward mast, climb on, and install long sampling inlet tubes. Then, before departing, we raise the mast and run the other end of the tubes back to a mass spectrometer which is running in a container van just aft of the mast. Then (assuming everything is working!) we continuously draw in air and measure two gases (dimethylsulfide and acetone). By simultaneously monitoring the 3D wind direction, we can find out how much of these two gases are entering the atmosphere from the ocean.
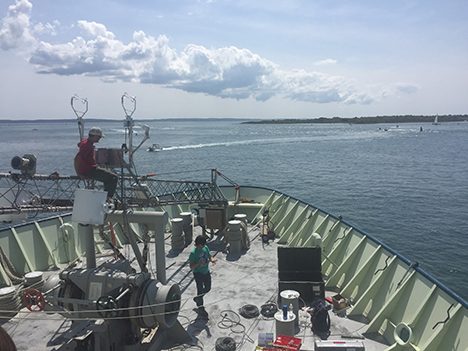
Jack Porter on top of the forward mast installing aerosol sampling inlet. Photo credit: Brian VerWey
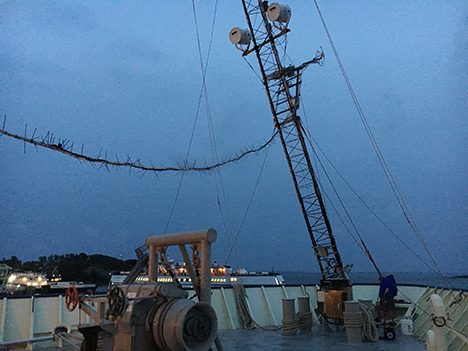
Group leader Tom Bell cranking up the mast before departure
as the Martha’s Vineyard ferry passes. The spiny line leading to the left
is a bundle of thoroughly cable-tied inlet tubes and electrical cables
that go from the mast back to the instrument van.
Written by Mike Lawler
The Royal Treatment
It can be tough saying goodbye to your loved ones as they sail off for a month at sea in the great, wide unknown. And perhaps some of you are concerned about the conditions we might be exposed to – which tropical storms will we collide with, what crazy hours will we be working, and what state of malnourishment will we return in? For the time being, we seem to have dodged the first tropical storm bullet (phew), and while I can’t promise that your loved ones are getting enough sleep at night, I can promise that their stomachs are very well tended to (perhaps a little too well…).
We are certainly getting the royal treatment here aboard the R/V Atlantis, complete with a five-star restaurant catering to our every need. For dinner the other night, we had “lemon, garlic, butter-crumbed scallops” and last night, it was “maple glazed salmon with steamed red potatoes and chives” on offer (and that was only one of the available options)! Now I don’t know about you, but my home-cooked meals don’t come within a cat’s whisker of the caliber of cuisine we receive on the boat. Despite this being my third NAAMES cruise, I am still finding new and exciting foods to try (sometimes in the snack tray, sometimes the meals themselves). The first day at breakfast, I tried a lychee, which screams “do not eat me” from its prickly red outside and isn’t any more inviting on its slimy inside, but it tastes pretty good. The second day, I needed something dry and salty to relieve my churning stomach and resorted to a pack of Fritos (yes, if you hadn’t picked up on it, I’m not from around here) – Fritos are not something I recommend to eat daily, but they get the thumbs up from a sea-sick stomach! Yesterday, I was super excited to try a Chaco taco… I shouldn’t have been! At the risk of insulting fond childhood memories for some, the waffle taco was reminiscent of a damp piece of sweet, chewy cardboard. It’s only redeeming feature was the ice cream. But still, I will continue to relish the new flavors I am lucky enough to experience on board the Atlantis. I wonder what new and exciting foods are in store for us today…
R/V Atlantis Meal Plan
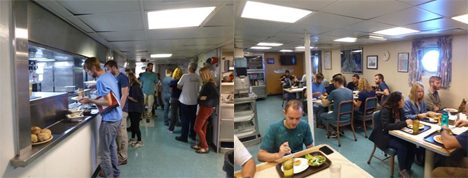
Dinner in the mess hall of the R/V Atlantis
Breakfast is by far my favorite meal! Not only does it top off a stunning sunrise (well, most days), but it begins the flurry of activity in the science labs, and as always, tastes delicious! The array of fruits, yoghurts, and cooked delights enlightens our taste buds and prepares us for the day ahead. And boy are we are going to need it as we finish transiting to our first station this evening. We expect to deploy our first CTD at 1:30 am tomorrow and life will be all hustle and bustle and strange sleep cycles for the next fortnight. But I can assure you that we will be well-fueled and rearing to go!
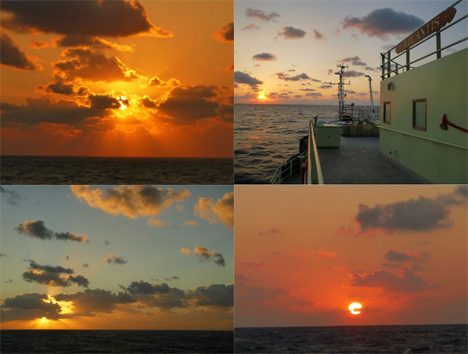
Just a few of the many beautiful sunsets on board the R/V Atlantis
Wish us luck!
Cleo Davie-Martin
P.S. Today, it turns out it was zucchini/banana muffins at breakfast and crab cakes for lunch!
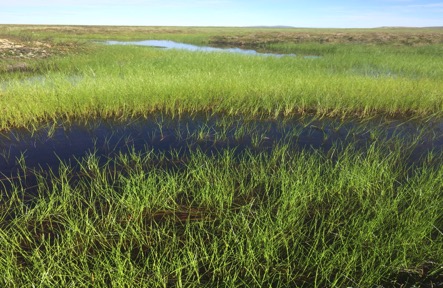
Arctic landscapes (shown above) hold our planet’s largest pool of soil carbon, which has been stored for thousands of years in frozen ground known as permafrost. This large store of carbon is now susceptible to release into the atmosphere as greenhouse gases, as the once frozen ground begins to warm. Scientists with the NASA Arctic Boreal Vulnerability Experiment (ABoVE) are currently working to find out how the Arctic carbon pool is responding to climate change and whether the Arctic is acting as a carbon sink or carbon source. Photo by Jennifer Watts.
To improve our understanding of how large stores of soil carbon and Arctic vegetation are responding to climate change, a team of scientists participating in the NASA Arctic Boreal Vulnerability Experiment (ABoVE) recently gathered in Alaska to take part in a remote field campaign. Team members were Jennifer Watts (University of Montana; Woods Hole Research Center), Kyle Arndt and Andrea Fenner (San Diego State University), and Stephen Shirley (University of Montana). The objective of this campaign was to install a network of soil moisture and temperature sensors within the footprint of an eddy covariance flux (EC) tower located in Ivotuk, Alaska (Ivo-US, N 68.49 W -155.75). The EC tower measures carbon flux, or the direction and magnitude of carbon dioxide (CO2) and methane (CH4) gasses carried in turbulent surface winds, rolling across a roughly 1-km swath of land. These data are used to characterize and model ecological processes such as vegetation productivity, soil decomposition and respiration, and the net land-atmosphere carbon flux over Arctic/boreal regions.
This story documents our journey above the Arctic Circle and provides a description of our daily life while working in the Alaskan tundra.
Tuesday July 18, 2017 (Day 1)
Waking up early for a busy day of planning and packing, we departed our dorm rooms at the University of Alaska, Fairbanks and headed for the ABoVE Logistics Office to meet Logistics Coordinator Sarah Sackett. Sarah assisted us with gathering camping equipment and gave us a detailed tour of the field kitchen, shelter, and bear safety supplies. The day was spent packing equipment into drybags and Action Packers, and ensuring that we had all of the tools necessary to perform our work in Ivotuk.
Jennifer Watts and Kyle Arndt plan the installation of the soil moisture sensors. Photo by Stephen Shirley.
That afternoon, we went to the store to buy our camp food: Thai noodles, taco and grilled cheese supplies, pancake mix… the list goes on but needless to say we were going to eat well. We arrived back to the office late in the evening, just in time for dinner. All of the NASA ABoVE project members currently in Fairbanks had come to meet at the Logistics Office for a barbeque, and we didn’t want to miss out on the food and company. After enjoying a great evening, and focusing on final packing, we went to our dorms to get some rest and prepare for our early morning expedition to Ivotuk.
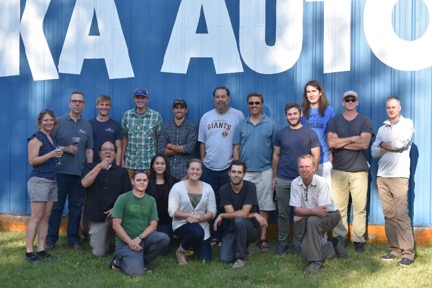
NASA ABoVE science team members gather for a photo at a 2017 Field Campaign cookout in Fairbanks. Photo by Charles Miller/NASA.
Wednesday July 19, 2017 (Day 2)
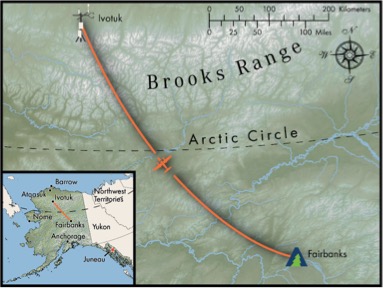
A map of our path from Fairbanks to Ivotuk. Photo by Stephen Shirley.
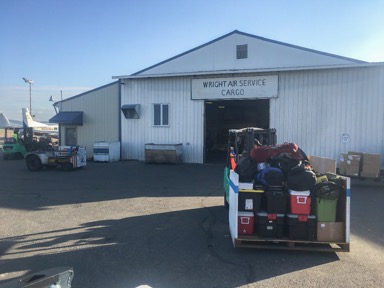
With a truck full of equipment, we departed the ABoVE Logistics Office for Wright Air Service in Fairbanks. Our dual engine Piper Chieftain could accommodate a maximum cargo weight of 1,400 lbs, including personnel and equipment. First we weighed ourselves and then our gear, which amounted to 200 lbs. over the weight limit. After dumping out all of our water, a spare GPS mapping unit, and some EC tower calibration equipment, we were able to board the plane.
Weighing our field and camping equipment to ensure that the plane wasn’t too heavy to take off. Photo by Stephen Shirley/NTSG.
Kyle Arndt, Stephen Shirley and Andrea Fenner, ready to fly to Ivotuk. Photo by Jennifer Watts.
We arrived in Ivotuk just before 10:00 and were greeted by swarms of mosquitos and scattered clouds. Our first priorities were setting up the bear fence surrounding our field camp, followed by the kitchen and personal tents, and finally filtering our first batch of water (since we had dumped our drinking water earlier that day). We then unpacked field equipment and headed across the tundra to the tower.
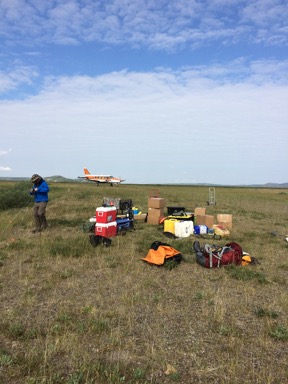
Unpacking gear upon landing in Ivotuk as our plane prepares to leave. Photo by Jennifer Watts.
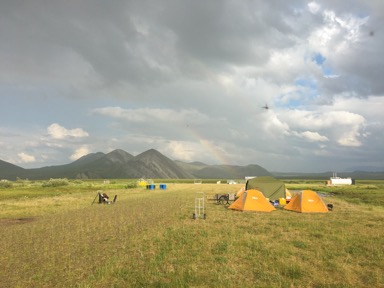
Jennifer Watts sets up a GPS base station at the corner of the landing strip (far left), under a rainbow, next to our Ivotuk campsite. Notice the flying object, one of many mosquitoes, in the foreground. Photo by Stephen Shirley.
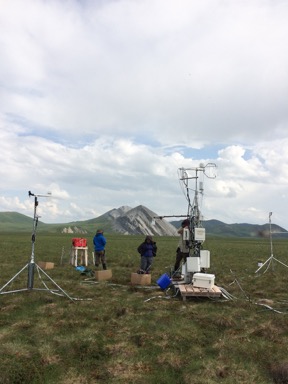
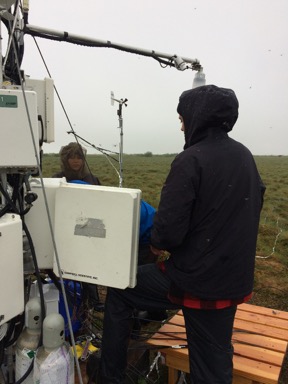
Kyle Arndt (right) makes room on the EC tower to hang the new datalogger box while Stephen Shirley and Andrea Fenner take in the scenery. Photo by Jennifer Watts.
Jennifer Watts and Andrea Fenner lay out soil moisture and temperature sensors. Photo by Stephen Shirley.
By late afternoon we had attached the datalogger box to the EC tower and were laying out the 18 soil moisture sensors of various lengths. Unravelling and walking out the 10 to 90 m cables was more challenging than anticipated. With the equipment box attached to the tower and sensors ready for installation we made our way to the power shed to charge our tools and equipment. Hungry and ready for bed, we made the rainy walk (the first of many) back to camp and tucked into our sleeping bags for the night.
Thursday July 20, 2017 (Day 3)
The majority of our Thursday was spent installing soil moisture sensors, three per site at 0-5 cm, 20 cm and 40 cm depths. Soil samples were collected for each site. We also measured the depth of the seasonally thawed soil layer overlying permafrost and the amount of water in the surface soils. Digging through frozen soil (in the rain) proved challenging. Sites with shallow thaw depths were even more work. First, we removed the thawed soil. Then we shoved out the frozen soil layer in little chunks, similar to scooping ice cream. Digging through the frozen soil for 10 cm or more took a lot of time and energy. After a late dinner, with our installation complete, we took an evening trip to the power shed to finalize the datalogger programming.
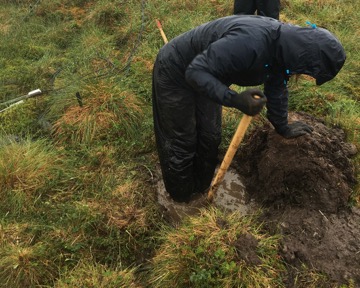
Jennifer Watts digs through frozen soil and muddy water to install soil moisture and temperature sensors. Photo by Stephen Shirley.
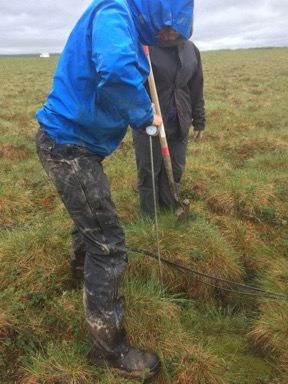
Stephen Shirley measures the active layer depth, the zone of thawed soil, above the permafrost. Photo by Jennifer Watts.
Andrea Fenner, Stephen Shirley, and Kyle Arndt run sensor cables into the datalogger box. Photo by Jennifer Watts.
Friday July 21, 2017 (Day 4)
After breakfast, we split up into groups for an independent science day. Kyle and Andrea took advantage of the sunny morning (the first since our arrival in Ivotuk) to take spectral measurements of the vegetation within the EC tower footprint. The spectral measurements are used to calculate various vegetation indices. Kyle and Andrea also collected samples of vegetation biomass to form a relationship between indices and above ground biomass. The biomass samples and spectral data may shed some light on the relationship between the plant biomass and methane fluxes emitted from the tundra.
Kyle Arndt collects vegetation biomass samples to accompany the spectral measurements. Photo by Andrea Fenner.
Jennifer and I spent our day collecting water samples from the braided tundra streams and small ponds located near the tower site. Water and gas samples were obtained at multiple locations for each water body. These samples will be analyzed for methane concentrations and isotopes to determine the amount and age of methane in the water bodies, which can be a major source of greenhouse gas emissions. The process took quite some time and we didn’t get done with the first two streams until late afternoon.
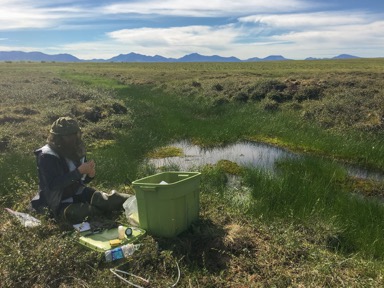
Jennifer Watts gathers water and gas samples from streams to determine methane concentrations. Photo by Stephen Shirley.
Late in the afternoon while Jennifer and I were finishing our second set of stream samples, Kyle and Andrea radioed that the cooking tent was about to fly away. Stormy weather was moving in. When I arrived at camp I saw Kyle and Andrea doing their best to hold down the tent. Our campsite was a mess. Everything had been blown around, inside and out, by the wind. We lost some time reorganizing our equipment and supplies, and securing the other tents. The rest of the evening was spent tying up loose ends on the independent projects, finishing stream samples and taking GPS points for Kyle’s measurements. After a late dinner, we made our daily trip to the power box to send emails and confirm that our flight out had been scheduled for the next day.
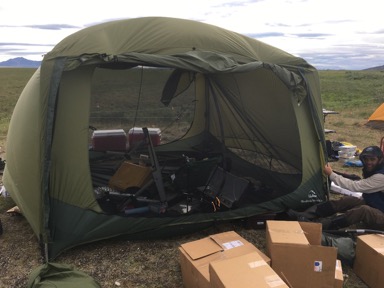
Kyle Arndt holds down the main tent after it was almost blown away by the wind; what a mess. Photo by Stephen Shirley.
Saturday July 22, 2017 (Day 4)
Sunday morning, we woke up to a wet and windy Ivotuk. To make things worse, the Ivotuk Hills and surrounding landscape were obscured by fog. After packing up science equipment, the kitchen and personal gear, we trekked across the misty tundra to the power shed to check emails and wait for updates on weather and the status of our chartered flight back to Fairbanks. We called Wright Air Service around 13:00 to report the best weather conditions that we had seen all day.
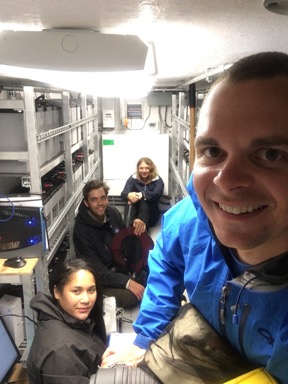
Jennifer Watts, Kyle Arndt, Andrea Fenner, and Stephen Shirley enjoying quality time in the power shed, possibly the driest place in Ivotuk. Photo by Stephen Shirley.
Our fingers were crossed that the sky would remain clear and that we wouldn’t have to spend another night in the wind and rain. Just about the time we had finished packing up our campsite, the plane arrived to take us home. The plane ride back was quiet. Everyone was tired and focused on the many tasks still ahead of us.
Stephen Shirley Jennifer Watts, Kyle Arndt and Andrea Fenner celebrating the end of the Ivotuk sensor install and the arrival of the plane to Fairbanks. Photo by Wright Air Service Pilot.
The next day would be spent downloading GPS information and preparing soil samples, taken for the calibration of our soil probes, for processing at the University of Montana. After replenishing supplies Jennifer, Kyle, and Andrea prepared to travel north to Barrow. Andrea would remain in Barrow while Jennifer and Kyle continued to Atqasuk for the next soil moisture sensor installation.
Over the course of my two weeks with the NASA ABoVE 2017 Field Campaign, I traversed the mucky tundra, dug holes through permafrost for the installation of soil moisture sensors, measured permafrost active layer and water table depths, and collected stream water samples around the Ivotuk airfield. This experience has improved my understanding of the Arctic tundra’s high spatial variability and the challenges faced when modeling its ecosystem processes at larger scales. The new measurements from the soil moisture sensor arrays installed in Ivotuk and Atqasuk this summer will help ecological modelers to quantify these small-scale differences for use in future biophysical land models.
Stephen Shirley is a senior undergraduate of Physical Geography and Research Technician at the University of Montana.
