When we think about the ocean the first reflex is to imagine the blue of a paradise tropical island or massive waves hitting remote cliffs on a stormy night. The most adventurous may think about submarines exploring the deep ocean and rovers sampling underwater volcanoes. There is something extremely fascinating that sits right “in the middle” of these two worlds and that is largely unexplored. The so-called mesopelagic extends between depths of 200 and 1,000 m below the ocean surface, between the daily lit epipelagic, where famous sea-life such as phytoplankton and dolphins live, and the dark bathypelagic, where no sun light penetrates. Being far from the ocean surface, where photosynthesis empowers epipelagic ecosystems, one would expect the mesopelagic to be relatively empty. Instead, sonar operators and scientists found out that the mesopelagic hosts an extremely rich ecosystem, so dense in life that layers of fish and zooplankton (planktonic animals that include small crustaceans (including krill), jelly-like organisms, arrow worms that feed mainly on phytoplankton) can foul sonars creating the illusion of a shallower bottom! Recent studies estimate that the mesopelagic is likely to host about 10^9 tons (yes, it’s 10 with other 8 zeros behind it) of fishes, without counting crustaceans, squids and other animals that inhabit the so-called deep scattering layer.
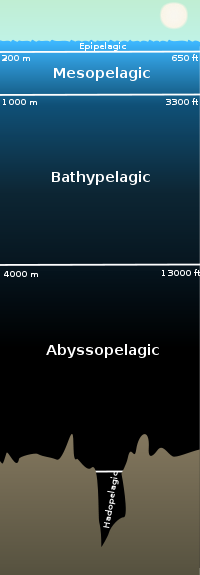
The mesopelagic is also called the “ocean twilight zone” because it is located between the epipelagic ocean, closer to the ocean surface and the deep sea, that is never reached by the light. (Credit: Wikipedia/Creative Common)
To make things even more mysterious, part of the organisms that create the deep scattering layer migrate every sunset from the deep sea to the epipelagic, where they are tought to feed on phytoplankton and are eaten by a range of ocean predators. (Some predators actually feed on them also during the day, by performing extremely deep dives in the mesopelagic). Then, when the sun rises again, they swim back to the deep ocean. This phenomenon is called diel vertical migration and is one of the largest animal migrations on Earth. Even if it involves “only” displacements of hundreds of meters, it is experienced by small (of a thumb-size and less) animals and it happens every day. I will never complain about my commute again.
Very little is known about this “world” and its interaction with the ocean epipelagic. What are mesopelagic organisms eating exactly? And how much? What do they do during the day? What triggers their migrations? How does their movement affect the cycles of different elements (especially carbon, the building blocks of life)? How are they affected by the variability in the ocean conditions at the surface? Are they distributed in the same way in different regions in the ocean? There is a lot of work to do!
During the NAAMES research voyage we are trying to learn something about the mesopelagic in the North Atlantic in different ways. Every time the ship slows down to ~ 4 knots, we put in the water our acoustic system: the echosounder. The idea is similar to the one behind a fancy fish finder, a sonar or the way bats find their dinner: our instrument sends sound towards the deep ocean and some of the signal is reflected by surfaces with different density (for example fish bladders). By measuring the time between when the sound is sent and when it is received back and the intensity of the reflected signal, we can estimate how much “stuff” is at which depth. We do that at different frequencies so that we can describe the distribution of organisms of different sizes, but unfortunately we cannot visually “see” what’s there.
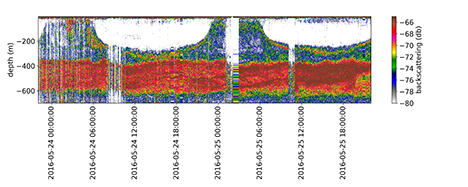
An example of the output from the echosounder from NAAMES 2 (May 2016). The x-axis shows time (in particular, the time of the day) and the y-axis shows depth. Different colors refer to the intensity of the reflected signal from different depths (i.e. red and yellow mean that there is a lot of “backscatterers”/ stuff that reflects sound, white that there is very little / nothing and blue and green represent intermediate values. This plot shows the output of the echosounder for 2 days and it’s possible to see the vertical migration of some mesopelagic organisms at sunset and sunrise.
Another tool we use to explore the mesopelagic is a net. At each station, we have a look at our echosounder and we decide at which depth we will tow our net. SSSG and crew members team up with us to put our big net at the right depth and dre the winch to tow it for a time between 40 minutes and 2 hours. When the net is brought back up to the surface it is hard not to be excited: the net is coming from the mesopelagic and we could find anything in there! After taking out our “catch” and rinsing the gear (that tends to be vaguely stinky for a while), it’s time to look at what we got: according to the location and the “layer” we targeted, so far we got a good selection of shrimp-like crustaceans, jelly-like zooplankton and a good collection of mesopelagic fish.
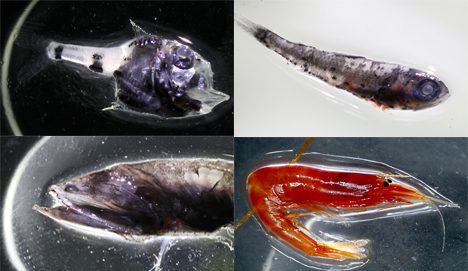
Examples of mesopelagic fish and zooplankton from our net tow.
(1- Hatchetfish, 2- Myctophid, 3- Bristlemouth, 4- A crustacean).
Photos by Stuart Halewood
It will be definitely fun and interesting to compare the results from our net-tow from different stations, with patterns in the echosounder and with the results of the “imaging team” that are taking snapshots of zooplankton at different depths during the water sampling sessions (if you are curious you can have a look here: ).
Written Alice Dellapenna
The response of cloud characteristics to increasing aerosol concentrations represents one of the largest uncertainties in our current understanding of climate change. We need to better understand the ability of aerosol particles to act as cloud condensation nuclei (CCN) under relevant atmospheric conditions. CCN activation is determined by particle size, composition, and water vapor supersaturation. Texas A&M University is gathering CCN data throughout the NAAMES III cruise. This data can be compared to data collected on the previous two cruises and can be compared to the CCN data collected by the C-130 aircraft. During NAAMES III the C-130 flight patterns were altered to provide better aerosol data that can be utilized by aerosol groups on the R/V Atlantis.
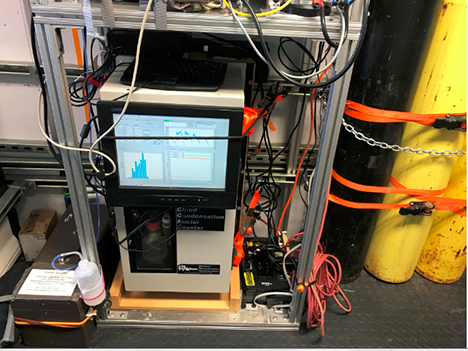
Texas A&M CCN Located in Aerosol Van on board the R/V Atlantis
In our current setup, there is a condensation particle counter (CPC) located before the CCN. The CPC detects and counts aerosol particles by first enlarging the particles. The particles come into contact with butanol and then expand to a size that is more easily detected. This setup allows us to see the total number of particles being counted compared to the number of particles that are able to activate as CCN. The data will provide information on the conditions when particles are more easily activated as CCN.
Written by Brianna Hendrickson
The Small Stuff Matters
The most important form of life in the ocean also happens to be the smallest. Phytoplankton provide the foundation of marine food webs, regulating global climate and the transport of nutrients and carbon. Phytoplankton populations fluctuate, sometimes growing high in numbers if they receive plenty of sunlight or nutrients. Other times, phytoplankton experience mortality, mainly from hungry grazers called microzooplankton (slightly larger carnivorous plankton) or from infectious viruses. As such vital components of the marine ecosystem, it is important to understand the balance between phytoplankton growth and death.
This is where we come in – our research team, which includes oceanographers from URI and UGA, are working to measure how often phytoplankton grow or die in the North Atlantic Ocean. Ultimately, we hope to link these findings of phytoplankton dynamics to larger-scale ocean and atmospheric measurements being made on the cruise.
On the cruise, we perform 24-hour incubation experiments with seawater collected from the water column. We sample the seawater the day its collected and a day later, measuring changes in the phytoplankton community using a range of instruments on board. One such instrument, the flow cytometer, allows us to count microscopic phytoplankton cells one-by-one. The flow cytometer takes up a sample and uses a laser to shine each cell as it passes by, distinguishing them based on specific size and fluorescence properties. After running a sample, we circle the populations, add some color to easily distinguish them and count the number of cells within each population. By comparing the number of cells gained or lost in a population each day, we can directly measure their growth and mortality rates!
Flow cytometry is just one technique we are employing on this cruise, but it is already helping to advance our knowledge of phytoplankton in the North Atlantic.
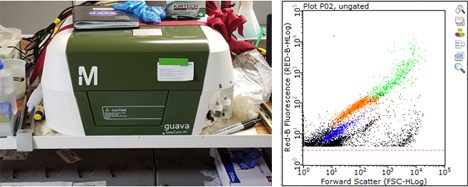
The flow cytometer we have on board the ship (left) and a typical plot (right) we see after a sample run, showing the different phytoplankton populations by color.
Written by Sean Anderson
Most of us think that our everyday lives put us under pressure, but the real pressure – in a physical sense – happens deep below the ocean surface. On Friday, most of us in the NAAMES III science teams aboard the Atlantis performed an exercise that clearly demonstrates that pressure. The ship is always buzzing with science activities, but that day there was a different buzz, as all of us took breaks from our sampling routines and, as excited as little kids, grabbed markers of multiple colors to actively decorate Styrofoam cups with our favorite motifs, all the while chewing on candies. True to oceanographic tradition, the decorated cups would then be sent down to 3000 m below the ocean surface. Due to the pressure, when the cups come back up they have shrunk to a fraction of their original size. Many of the designs on the cups were inspired by ocean creatures, or by the sunsets and sunrises and the beautiful skies that we had been admiring from the ship. Favorite sports teams were also featured, as of course were the R/V Atlantis and the NASA planes that fly above our sampling region. We take the shrunken cups home as souvenirs of our time on the ocean.
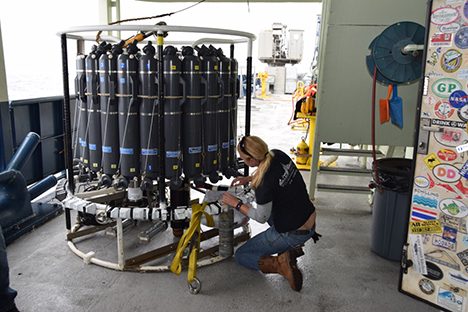
SSSG Catie attaching cups to the CTD on board the R/V Atlantis
The cups go down securely attached to a sampling package made of various sensors and water sampling bottles known as a CTD, which is cast from the ship via a winch. CTD is an essential oceanographic instrument that occupies a central place in the NAAMES field campaigns. CTD is an acronym for conductivity, temperature, and depth, which are among the primary parameters that the instrument measures and give information about the physical structure of the ocean in the vertical dimension. Attached to the CTD are also probes that measure parameters such as oxygen and fluorescence. Fluorescence is caused by the dissipation of some of the energy contained in the light absorbed by pigments, such as chlorophyll, occurring within ocean microscopic plants known as phytoplankton. A portion of the absorbed light is emitted at another (longer) wavelength, stimulating fluorescence that can be measured by the probe, providing an estimate of the concentration of the phytoplankton.
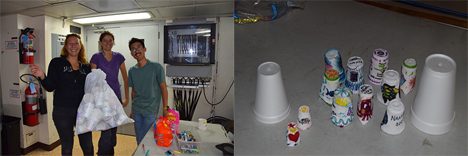
NAAMES scientists with their decorated cups (left) and the shrunken cups after going down to 3000m (right)
As the CTD is cast downwards, the data its sensors collect are displayed in real time on a computer screen, attracting many of us around the computer avidly watching vertical profiles of the ocean.
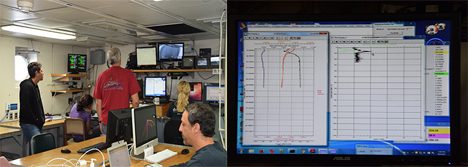
The CTD room on board the R/V Atlantis (on the left) and typical CTD profile display (on the right).
We use the information to determine which depths present interesting features that will guide our sampling. On the up cast, the CTD can then be stopped at these specific depths to collect water that provides chemical and biological samples and is also used in experiments. Even if we find decorating Styrofoam cups fun, that is when we go back to our lab with the collected water that the true fun begins.
Written by Francoise Morison
The Scripps research group focuses on aerosols, which are microscopic liquids and solids suspended in the air. Aerosols may be formed over the ocean when wave generated bubbles burst and eject particles into the atmosphere. Aerosols may also be formed from gas phase compounds released from the ocean that then react with sunlight and oxidants in the atmosphere. Aerosols are important to climate as they act as seeds for cloud droplets. The ability of water to collect on aerosols is determined by their size and chemical composition. We have several instruments housed in our sampling van that we use to determine these properties. The aerosols are sampled through an inlet that reaches 50 ft above the ocean surface.
The instrument that I work with is an Aerosol Mass Spectrometer (or AMS for short). The AMS provides information on the chemical composition of the aerosols. We typically look at a variety of organic compounds as well as nitrates, sulfates (both from sea salt and organic sulfates formed from dimethyl sulfide released by ocean biology), and other sea salt components (NaCl). The AMS can also determine the sizes of the different aerosol components.
An interesting part of the NAAMES study is linking the atmospheric aerosol measurements with the chemical and physical properties of the ocean being measured by the oceanography teams. These comparisons will help us better understand the processes contributing to aerosol formation over the oceans.
We will also be able to compare our ship-based aerosol measurements with those of the C-130 aircraft. The C-130 can enhance the range of aerosol measurements by flying an accordion shaped pattern around the ship (upwind and downwind), which will let us see how the aerosols measured by the ship change over time. The aircraft will also fly a vertical pattern, which will provide us with information on the vertical profile of the atmosphere. That information is important for understanding the heights and stability (and potential mixing) of the different sub-layers of the troposphere.
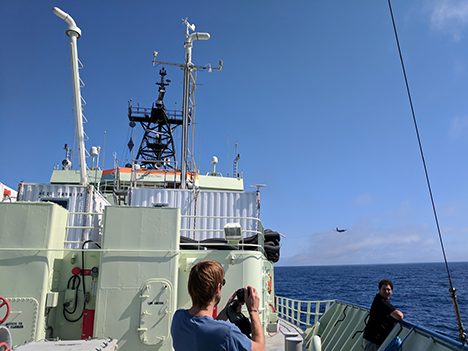
The NASA LARGE C-130H Hercules aircraft flyby of the R/V Atlantis on 9/6/2017. The aerosol sampling vans with inlets can be seen on the upper deck (Scripps van on the left, PMEL van on the right).
Written by Derek Price
