By Eric Lindstrom

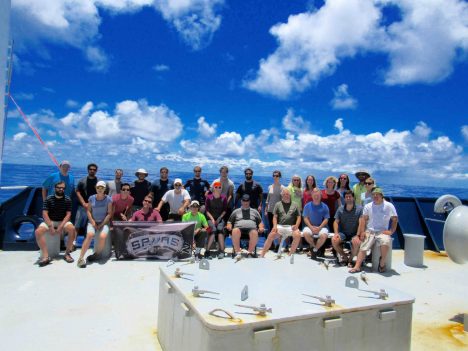
The SPURS-2 science party on the R/V Revelle.
The R/V Revelle expedition has been the opening round in a yearlong effort to understand the upper ocean physical processes in the eastern tropical Pacific. We put moorings in place to collect a time series of upper ocean measurements over the year. We launched the first round of Lagrangian drifters and floats. Lady Amber will be servicing these assets at regular intervals and launching new drifters and floats into the array.
It is with some caution and caveats that I try to summarize our findings from the last six weeks of effort. Ideas are still young and data processing is still in its early phases. Only data from shipboard measurements are complete but still require careful screening, calibration, and validation. Despite the caveats, some of our questions and challenges are much clearer now than before we left Honolulu.
The Conductivity, Temperature and Depth (CTD) work, led by Janet Sprintall, charting the variations of temperature, salinity, and oxygen in the upper ocean, revealed some quite interesting features. Janet and her team will be looking at salinity-compensated temperature inversions in the upper ocean that seem to be closely associated with the edges of the east Pacific fresh pool.
Jim Edson and Raymond Graham have a wonderful three-week time series of 80 atmospheric profiles from their radiosonde launches via weather balloons every six hours. Ray will be working these up for his MS degree research project, so I won’t steal any of his thunder. Needless to say, we all think he will have an awesome project because it is such a rich data set!
Ray also assembled all the rainfall data daily and found that during SPURS-2 we had about 10 inches of rainfall in our 3 weeks on site near 10N, 125W.

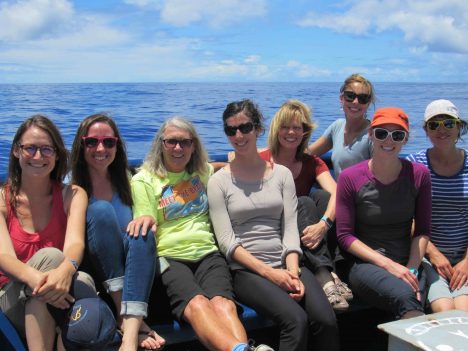
The women of SPURS-2.
Carol Anne Clayson has collected more than 1,500 air-sea flux estimates (20-minute averages) to be analyzed in conjunction with the upper ocean data sets from numerous platforms. She has already been able to run her mixed layer model using initial conditions from early in the expedition and the raw flux estimates to compare with later expedition measurements. It gives us great optimism for new discoveries out of this data set.
Michael Reynolds brought the Remote Ocean Surface Radiometer (ROSR, from Andy Jessup) and the Infrared Sea surface temperature Autonomous Radiometer (ISAR, from Carol Anne Clayson) to SPURS-2 to examine the surface skin temperature of the ocean during rainfall. Michael successfully engineered the instruments for this purpose (normally a fair weather measurement). He has put together some exciting compilations of data comparing his measurements with other temperature measurements made on the ship.
Julian Schanze from Earth & Space Research in Seattle is the man with the Salinity Snake. It has provided a virtually continuous record of the salinity in the top 2 inches of the water column. Julian has identified nearly 40 fresh lenses where salinity at the surface is significantly lower than ship intakes at 6.5 feet (2 meters), 9.8 feet (3 meters), and 16.4 feet (5 meters depth). These measurements, when further combined with the Surface Salinity Profiler data from the upper 3.3 feet (1 meter), will constitute a rich data set for analysis of fresh water lenses induced by rainfall.
Ben Hodges from Woods Hole Oceanographic Institution (WHOI) has been following the three Wavegliders deployed near the SPURS-2 central mooring. They have salinity sensors near the surface and at 19.7 feet (6 meters) depth and will be hard at work over the entire coming year. One of the Wavegliders had an experimental package of sensors on it called the salinity “Rake” with sensors at every 3.9 inches (10 centimeters) depth from the surface to 3.3 feet. The Rake, invented by Raymond Schmitt at WHOI, recorded data internally and was recovered after a few days of operation to check functionality (it has not been to sea before). The data is amazing; but it only lasted one day before mechanical failure and short circuits took it out of commission. However, that vertical resolution and the interesting features that it saw were a new peek at the ocean surface salinity that really has not been seen before. More engineering work needs to be done at home before it can be re-deployed. The team at Woods Hole will be highly motivated to get this instrument to sea again soon, based on what we saw in just one day. The Waveglider was re-deployed without the Rake.
The Surface Salinity Profiler (SSP) team led by Kyla Drushka has a very successful run with 18 deployments (not counting various tests and trials). The data is still being assembled and examined but, like the Rake measurements, the SSP focus on the top 1 m of the ocean is going to provide new insights on ocean processes. The SSP has the added benefit of microstructure probes to provide information on turbulent mixing. The biggest difference in salinity seen over 3.3 feet by SSP was 9 units!
Eric Chan had the rare opportunity to focus a study on the air-sea exchange of carbon dioxide during rain events. The simultaneous analysis of his gas exchange data with the salinity snake and meteorological data will be enlightening. Certainly the raw carbon dioxide data show the dip in pCO2 expected during rain events when the salinity drops.

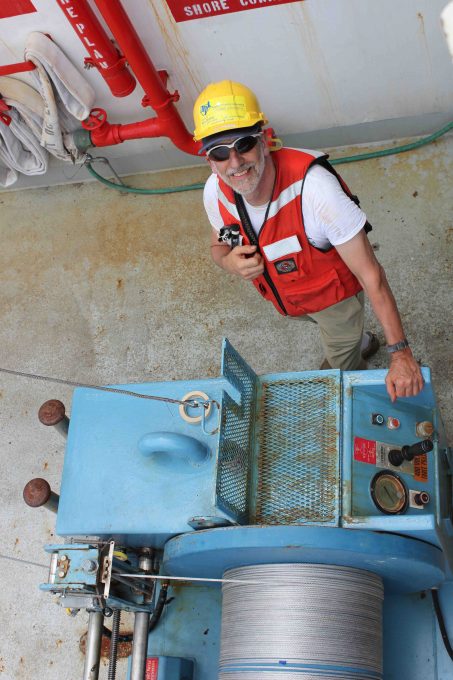
Andy Jessup, voyage chief scientist, at work.
Finally, I’d like to heap praise on our chief scientist, Andy Jessup, who managed execution of all the projects and requirements with great skill and diplomacy. The whole SPURS-2 team owes Andy a great deal for making the R/V Revelle expedition such a successful initiation of the SPURS-2 Program.
Next blog post: PORT!
Tags: climate, ocean acidification, ocean salinity, oceanography, Pacific Ocean, SPURS2, water cycle


