By Eric Lindstrom
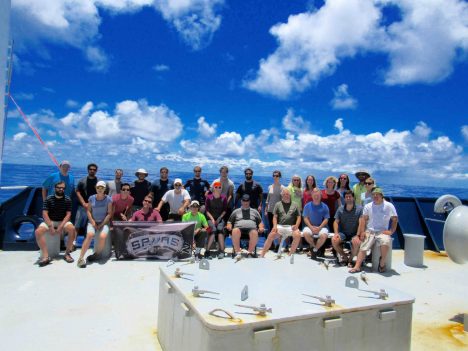
The SPURS-2 science party on the R/V Revelle.
The R/V Revelle expedition has been the opening round in a yearlong effort to understand the upper ocean physical processes in the eastern tropical Pacific. We put moorings in place to collect a time series of upper ocean measurements over the year. We launched the first round of Lagrangian drifters and floats. Lady Amber will be servicing these assets at regular intervals and launching new drifters and floats into the array.
It is with some caution and caveats that I try to summarize our findings from the last six weeks of effort. Ideas are still young and data processing is still in its early phases. Only data from shipboard measurements are complete but still require careful screening, calibration, and validation. Despite the caveats, some of our questions and challenges are much clearer now than before we left Honolulu.
The Conductivity, Temperature and Depth (CTD) work, led by Janet Sprintall, charting the variations of temperature, salinity, and oxygen in the upper ocean, revealed some quite interesting features. Janet and her team will be looking at salinity-compensated temperature inversions in the upper ocean that seem to be closely associated with the edges of the east Pacific fresh pool.
Jim Edson and Raymond Graham have a wonderful three-week time series of 80 atmospheric profiles from their radiosonde launches via weather balloons every six hours. Ray will be working these up for his MS degree research project, so I won’t steal any of his thunder. Needless to say, we all think he will have an awesome project because it is such a rich data set!
Ray also assembled all the rainfall data daily and found that during SPURS-2 we had about 10 inches of rainfall in our 3 weeks on site near 10N, 125W.
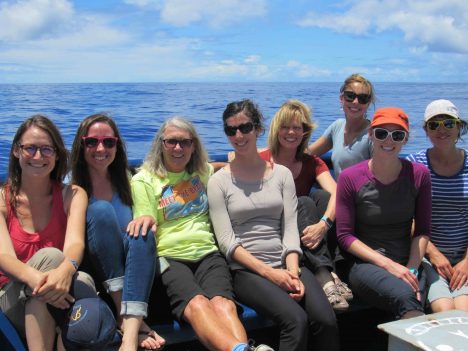
The women of SPURS-2.
Carol Anne Clayson has collected more than 1,500 air-sea flux estimates (20-minute averages) to be analyzed in conjunction with the upper ocean data sets from numerous platforms. She has already been able to run her mixed layer model using initial conditions from early in the expedition and the raw flux estimates to compare with later expedition measurements. It gives us great optimism for new discoveries out of this data set.
Michael Reynolds brought the Remote Ocean Surface Radiometer (ROSR, from Andy Jessup) and the Infrared Sea surface temperature Autonomous Radiometer (ISAR, from Carol Anne Clayson) to SPURS-2 to examine the surface skin temperature of the ocean during rainfall. Michael successfully engineered the instruments for this purpose (normally a fair weather measurement). He has put together some exciting compilations of data comparing his measurements with other temperature measurements made on the ship.
Julian Schanze from Earth & Space Research in Seattle is the man with the Salinity Snake. It has provided a virtually continuous record of the salinity in the top 2 inches of the water column. Julian has identified nearly 40 fresh lenses where salinity at the surface is significantly lower than ship intakes at 6.5 feet (2 meters), 9.8 feet (3 meters), and 16.4 feet (5 meters depth). These measurements, when further combined with the Surface Salinity Profiler data from the upper 3.3 feet (1 meter), will constitute a rich data set for analysis of fresh water lenses induced by rainfall.
Ben Hodges from Woods Hole Oceanographic Institution (WHOI) has been following the three Wavegliders deployed near the SPURS-2 central mooring. They have salinity sensors near the surface and at 19.7 feet (6 meters) depth and will be hard at work over the entire coming year. One of the Wavegliders had an experimental package of sensors on it called the salinity “Rake” with sensors at every 3.9 inches (10 centimeters) depth from the surface to 3.3 feet. The Rake, invented by Raymond Schmitt at WHOI, recorded data internally and was recovered after a few days of operation to check functionality (it has not been to sea before). The data is amazing; but it only lasted one day before mechanical failure and short circuits took it out of commission. However, that vertical resolution and the interesting features that it saw were a new peek at the ocean surface salinity that really has not been seen before. More engineering work needs to be done at home before it can be re-deployed. The team at Woods Hole will be highly motivated to get this instrument to sea again soon, based on what we saw in just one day. The Waveglider was re-deployed without the Rake.
The Surface Salinity Profiler (SSP) team led by Kyla Drushka has a very successful run with 18 deployments (not counting various tests and trials). The data is still being assembled and examined but, like the Rake measurements, the SSP focus on the top 1 m of the ocean is going to provide new insights on ocean processes. The SSP has the added benefit of microstructure probes to provide information on turbulent mixing. The biggest difference in salinity seen over 3.3 feet by SSP was 9 units!
Eric Chan had the rare opportunity to focus a study on the air-sea exchange of carbon dioxide during rain events. The simultaneous analysis of his gas exchange data with the salinity snake and meteorological data will be enlightening. Certainly the raw carbon dioxide data show the dip in pCO2 expected during rain events when the salinity drops.
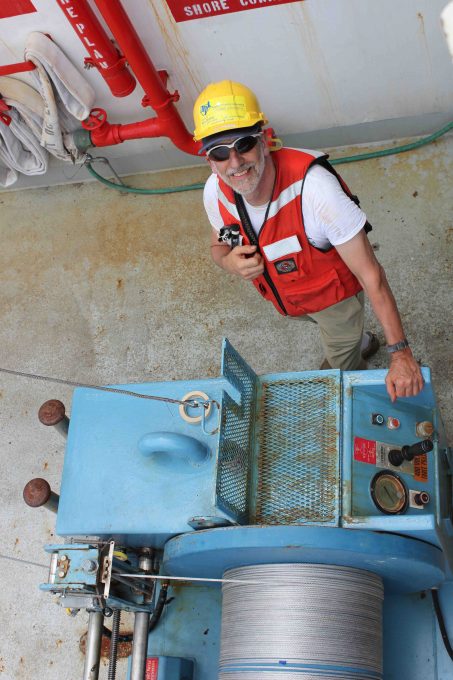
Andy Jessup, voyage chief scientist, at work.
Finally, I’d like to heap praise on our chief scientist, Andy Jessup, who managed execution of all the projects and requirements with great skill and diplomacy. The whole SPURS-2 team owes Andy a great deal for making the R/V Revelle expedition such a successful initiation of the SPURS-2 Program.
Next blog post: PORT!
By Alek Petty
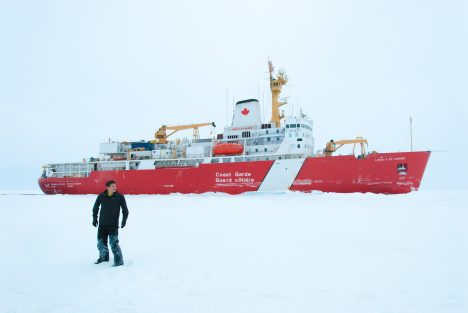
Your blogger, Alek Petty, out on the ice during the 2014 Joint Ocean Ice Study research expedition, with the Louis S. St. Laurent in the background.
Hello and welcome to my new blog. I’m Alek Petty, a sea ice scientist at NASA’s Goddard Space Flight Center, currently making my way to the northern coast of Canada (a small town called Kugluktuk) to embark on the 2016 Joint Ocean Ice Study (JOIS) – a research expedition around the Arctic Ocean’s Beaufort Gyre. The Beaufort Gyre is a slowly-rotating icy body of water north of Alaska (see map), which covers an area roughly ten times the size of Lake Michigan and stores a significant fraction of the Arctic Ocean’s freshwater.
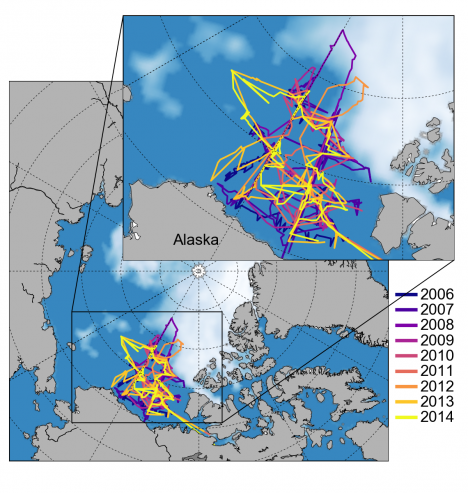
Cruise tracks from previous JOIS expeditions during 2006-2014 and the sea ice concentration around this year’s summertime minimum extent on Sept. 10 (from NSIDC).
The expedition I’m going to be on has occurred every summer since 2003 – coinciding with the Arctic annual sea ice minimum, which typically happens in September – providing us Arctic scientists with a unique opportunity to monitor this harsh, but climatically significant region. The goal of these expeditions is to better understand the Beaufort Gyre’s circulation, freshwater content, water mass properties and biota distributions. I’ve been lucky enough to be invited on my second expedition to support this year’s planned sea ice observations.
We will be taken around the Beaufort Gyre by the Louis S St. Laurent, a Canadian Coast Guard icebreaker specially designed to smash its way through the sea ice covered oceans (sea ice can be several meters thick in places). About a week ago, we observed this year’s sea ice minimum, which tied 2007 for the second lowest on record. The Arctic sea ice declines over the past decades have meant yachts and even a luxury cruise liner (with the aid of an icebreaker, they often leave that bit out in the news stories) are now navigating through the southern Arctic Ocean, including the newly opened Northwest Passage – made famous by Franklin’s failed traverse back in 1845 (when the ice was a lot thicker) and commemorated in this heartfelt tune by Canadian folk singer Stan Rogers.
While the diminished Arctic sea ice cover has made navigation easier than it used to be, especially for icebreakers, one of the primary objectives of our expedition is to deploy buoys into the ice that can collect measurements of the sea ice-atmosphere-ocean system as they drift through the Arctic Ocean (ice-tethered profilers). One of our initial goals will therefore be to search for sea ice thick enough to ensure that the ice isn’t going to melt out any time soon. One of my primary activities over the next few weeks will be to observe the extent and magnitude of sea ice freeze-up as we make our way north, the days begin to shorten, and the temperatures start to drop.
I look forward to giving you a better overview of what the trip is all about in future blog posts (we’re not just scouting for polar bears, promise), including some background to all the various scientific projects being undertaken. Stay tuned!
By Eric Lindstrom
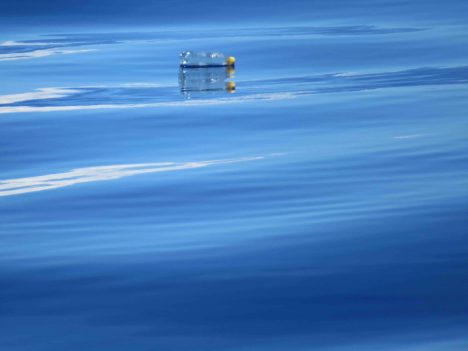
Plastic bottle floating by the ship.
A 1960’s movie classic, “The Graduate” (1967), contains a scene where the young Benjamin Braddock (Dustin Hoffman) is given advice about his future by the worldly Mr. McGuire (Walter Brooke):
Mr. McGuire: I want to say one word to you. Just one word.
Benjamin: Yes, sir.
Mr. McGuire: Are you listening?
Benjamin: Yes, I am.
Mr. McGuire: Plastics.
A report from the World Economic Forum earlier this year estimates that the weight of plastic in the ocean will equal the weigh of fish by 2050. According to the report the worldwide use of plastic has increased 20-fold in the past 50 years and is expected to double again in the next 20 years.
Ocean pollution by plastic has been worrisome for years, but the global prevalence of plastic in the ocean and the full impact of its consequences are more recently appreciated. Plastic breaks down at sea into “microplastics” that are now part of the floating plankton – the base of the food web in the ocean. So, plastic is increasingly found in the stomachs of marine organisms. Recent estimates put the amount of plastic floating in the world’s oceans at more than 5.25 trillion pieces weighing more than 268,000 metric tons. That translates to as much as 100,000 pieces per square kilometer in some areas of the ocean. This is a new ocean habitat know as the plastisphere.
The plastisphere is a new waterfront mobile home for marine microorganisms. It potentially provides a floating home for microbes to take long tours of the ocean that were heretofore impossible. The ecological implications of this new globalization of the ocean microbial biota have yet to be determined.
Zooplankton and fish consume microplastics as they forage the plankton. Scientists think that nearly every bird that feeds at sea has a burden from the plastisphere as they forage the small fish. Given the rapidly increasing tonnage of plastic joining the plastisphere and the plastisphere invasion of the marine food chain, we too will be doing battle with the plastisphere, if not already.
Marine debris is not all plastic and has many sources. However, dumping from ships at sea is NOT the major source. Dumping at sea has been highly regulated for more than 30 years. The major source of plastics and other debris in the ocean is from land sources and river runoff.
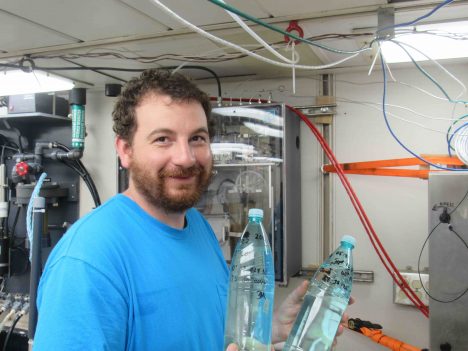
Dan Clark with two of his nearly 50 bottles of samples for investigation of ocean microplastics.
In SPURS-2 we are very far from land – 7.5 days transit by ship from the Hawaiian Islands. Yet, still, we spy plastic bottles, shoes, fishing gear, and other unidentifiable debris at the surface of the ocean every day. We also have evidence that microplastics exist here. A UV filter, part of the water intake to one of R/V Revelle’s new thermosalinograph systems (Underway Salinity Profiling System) inadvertently acts as a microplastics sampler. Floating plastics, fibers and ocean detritus accumulate in the UV filter chamber that used to sterilize the saltwater sample prior to salinity sensing. The debris in the filter must be cleaned frequently to keep the system in working order and prevent bioaccumulation in salinity sensor. This thermosalinograph system was not designed for studying ocean debris, but it is a plenty worrisome observation. Dan Clark from University of Washington’s Applied Physics Laboratory is keeping the daily samples for analysis after SPURS-2. This a nice example of citizen science undertaken through the curiosity and personal initiative of Dan over and above his many other duties. Now he just has to figure out how to deal with the unusual sampling protocol!
The ocean is actually quite forgiving as a disposal site for human detritus in moderation, except plastic. Organics can be recycled by marine life, wood is disposed of quickly by boring worms, metals can be corroded by seawater, but plastic cannot be dissolved or digested. It is only humans who create and produce plastic goods. It is only humans who can dispose of plastic properly. Plastic MUST be recycled or disposed in landfills. Plastic has no business being in the ocean. We can only hope that the plastisphere we have created can be tamed and that it does not spawn deadly new microbes by virtue of its existence.
So, next time you are using a plastic good, make sure its afterlife is not in the plastisphere of the ocean. Benjamin’s retort to Mr. McGuire should have been “Yes. Mr. McGuire. Plastics are the future. If we can find proper ways to dispose of them!”
By Eric Lindstrom
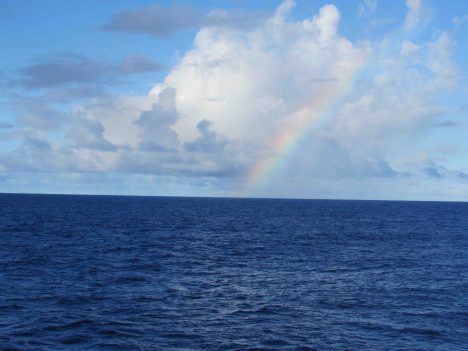
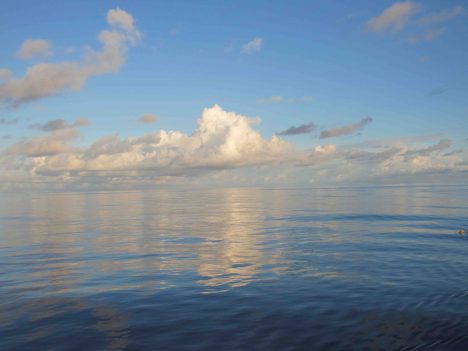
Blue sea and sky, with a nice rainbow.
The beauty of sea and sky in the open ocean of the tropics is a wonder to behold. There seemingly are an infinite number of ways to mix the sun, clouds, water, wind, and stars into poetry and science. For today I choose only a tiny slice of this infinite variety: Today is all about the blue.
Blue is the fundamental background of the sea and sky in the tropical oceanic regions of the Earth. The preferential scattering of blue light in the full spectrum of visible light from the sun accounts for the blue sky. Most open-ocean regions have remarkably clear water, which when illuminated by the sun also takes on a deep blue hue. Other visible light is absorbed quickly in the sea and it remains for the blue to be scattered back and illuminate modest depths.
Sea and sky on a very calm day.
While clear seawater is blue, if particles are introduced to the water such as floating microscopic marine organisms (plankton) or silt and mud, it can be transformed shades of green, red, and brown. However, clear blue seawater does not indicate the absence of life: Blue ocean water is still a sea of life with submicroscopic picoplankton and marine viruses making a life in the chemical soup that is seawater.
Oceanographers like Carol Anne Clayson from Woods Hole Oceanographic Institution use a special instrument, the HOBI a-Sphere Spectrophotometer, to measure upper ocean absorption of light. The instrument uses an internal light source to measure absorption characteristics as it is lowered from the ship. This measurement is critical to estimating the transfer of radiant heat energy across the air-sea interface. Here in the SPURS-2 field site, the water is so clear that sunlight penetrates well below the well-mixed surface layer and is lost to typical energy budgeting exercises. So, the question of how much energy is lost in such calculations is a big question (considering the vast extent of this very clear blue ocean) when climate studies demand a careful accounting of heat flows to and from the ocean.
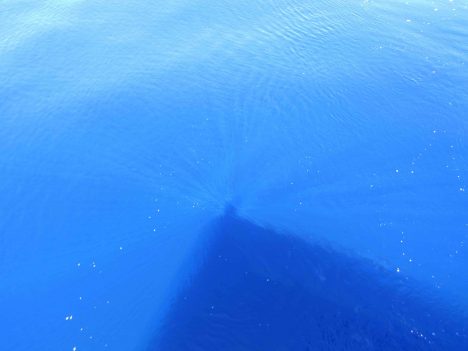
Blue ocean, with sun rays around Eric’s shadow.
It is often true and hard to imagine that those days when sea and sky are blue and the harsh tropical sun sees no cloud are when the atmosphere is feasting on its fuel from the ocean, water vapor, through the process of evaporation. We all know evaporation from the ocean is invisible, but I would use poetic license and say that evaporation is really blue! It is a clear dry wind over a warm ocean (e.g. trade winds in the tropics) that fills the atmosphere with the moisture that accounts for most of our rain. Like yesterday, when it was clear blue sky from horizon to horizon with a gentle wind leaving the deep blue ocean without a single whitecap, it is all blue and it is bonanza for evaporation.
Raymond Graham and Jim Edson from University of Connecticut (whose color brand is navy blue!) are making careful measurements of both evaporation and precipitation during SPURS-2. Despite our focus on salinity and the role of rain in forming the eastern tropical Pacific fresh pool, we must completely account for all the moisture that flows between atmosphere and ocean. The rain is visible and tangible. The evaporation is invisible but critical to the moisture budget. They are also profiling the temperature and moisture through the atmosphere using instruments on balloons (learn more about this topic in a later blog post!).
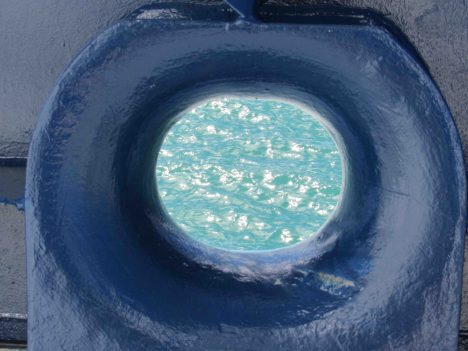
The R/V Revelle blue meets ocean blue.
Blue is the color of our daily lives in R/V Revelle. The ship is blue. The crew’s t-shirts are blue. The ocean is blue. The sky is blue. The rods and cones on our retina normally get a color workout every day. Out here, some of our retinal cells are getting a six-week vacation. The 2 percent of our cone cells tuned to blue light are getting no rest at all. Maybe that is why the colors of land (greens and reds) look so vivid that first day back ashore? Or maybe, being back ashore just makes an oceanographer blue!
By Eric Lindstrom
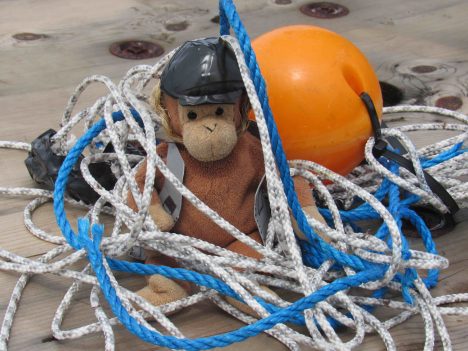
Monkey makes its own mess!
Long ago on a planet very similar to our own, oceanography was done without the Internet or regular communication with shore. It required careful planning and forecasts of the conditions to be encountered were vague at best. Executing the original plan of work for a voyage was always a good objective.
Unlike those days on that planet, the shipboard work of SPURS-2 seeks to optimize our operation as we go by depending on a “dry team” ashore for a daily flow of information. The information comes from a number of sources including satellites, in situ data (data collected in place), models, and combinations of these sources. The daily flow of information comes to us via the Internet in a “tarball.” In computing, tar is a computer software utility (originating from Tape ARchive) for collecting many files into one archive file, often referred to as a tarball. Scientists on R/V Revelle receive the daily tarball assembled by our dry team at the NASA Jet Propulsion Laboratory (in association with many SPURS-2 scientists ashore). The tarball contains files for daily weather and oceanographic analysis and a wealth of ancillary information. The tarball is information desired by the team aboard the ship, a key point that should not be overlooked in the following discourse.
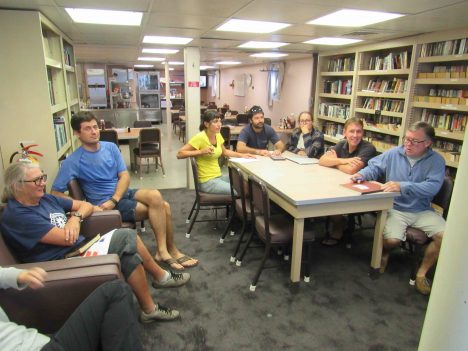
SPURS-2 planning is a daily occurrence in the R/V Revelle library. From left to right: Janet Spintall, Denis Volkov, Kyla Drushka, Ben Hodges, Audry Hasson, Julian Schanze and Jim Edson.
Well, you can see where I am going with this: a tarball is also a blob of petroleum that has been weathered after floating in the ocean, sticky marine debris from the age of oil spills. With all due respect to the efforts of the dry team, commonality of the computing and oil tarball terminology becomes all too clear when one tries to reconcile the complex flows of data from both the tarball and the vast array of instruments on the ship. The tangle of seemingly conflicting information can make you feel like you are dealing with a tarball of the sticky black variety!
The tarball does focus our attention by feeding back to us our own observations. After R/V Revelle has deployed moorings, drifters, and floats we might receive back meteorological data from the central WHOI mooring, profiles from the NOAA moorings, trajectories of surface drifters, and profiles from the Argo floats. This real information may or may not conflict with what we imagined we would see (and built our plans around). So, this tarball pushes us into consideration of whether our plans going forward need revision or remain sound.
For example, the tarball is always an implicit invitation to re-consider the planned work to take account of current or forecast conditions. Ostensibly this information enables us to make the most of our valuable ship time. However, having a constantly evolving plan of action is rough on people and their routines. Plans tend to lose their certainty.
Of course, proposals are funded and years of work are banking on our executing a planned set of measurements. However, the decisions are difficult, if we planned to collect seven days of Surface Salinity Profiler data in rainy conditions and our planned operations turn out to be south of the actual rains for the previous two weeks, do we change our plans? Or, will Mother Nature bring rain to us in the coming weeks if we simply execute the plan with which we came to sea? The tarball gives us some weather projections, satellite rain rate and cloud maps, as well as current and salinity patterns in the ocean and model forecasts to help with the decision-making. Unfortunately what seems clear and useful to those at desks thousands of miles away, can be less than clear and ultimately confusing when working on an isolated patch of ocean far from regular observation. The effort to make good use and sense of the tarball is one of the additional challenges facing modern oceanography.
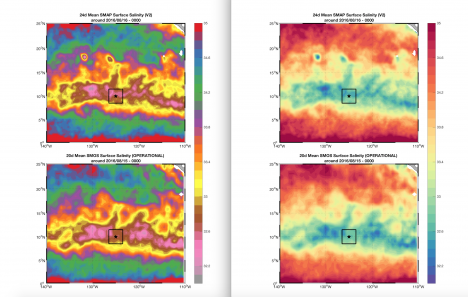
Two-panel plots of satellite salinity from the SMOS and SMAP missions. The only difference is the color scale; it is kind of a Rorschach test for oceanographers. Do you see fronts in one and not the other? Well, they are the same! What you see and interpret can be biased by how you present the information. That is another sticky mess in the tarball.
Before the tarball, seagoing oceangraphy was simpler (and more dangerous) and plans were simply to be executed. With the tarball, science is safer and more nimble and plans are malleable. I think that for us, older humans, the modern way with the tarball is more stressful. Or maybe, if you came of age with the Internet, life without the tarball is unimaginably silly and stupid. For a young oceanographer the science IS the sticky mess inside the tarball!
Whatever the reality, our information age has made a day at sea a challenge in environmental analysis. No more hoping, imagining, or guessing – it is all in the tarball if only you can figure it out!
