Ground-based weather radars are a critical component of the OLYMPEX project on the Olympic Peninsula. Situated near the coast, NASA’s NPOL radar records precipitation data over the ocean and toward the mountains. As with any scanning weather radar, the beam width and height above ground increases with distance from the radar. Therefore, even though NPOL is scanning toward the mountains, the lower portions of the Quinault Valley are being missed.
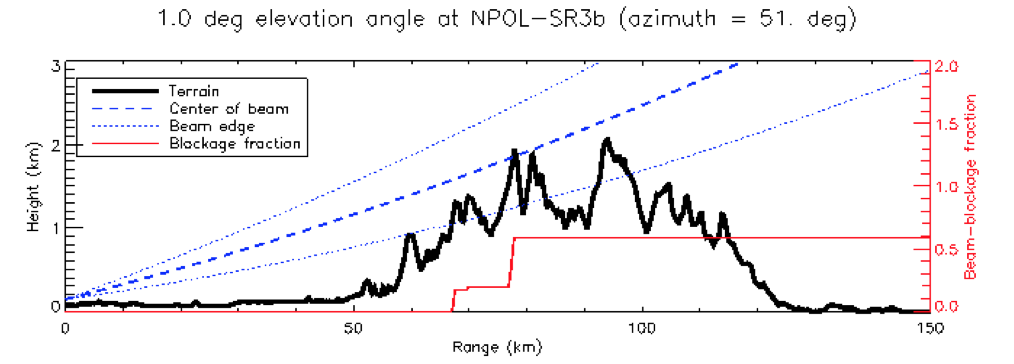
Figure showing the beam spread for a 1-degree elevation angle scan for NPOL. Terrain profile shown in black. Red line shows the percentage of the beam blocked by the terrain.
To fill in this low-level gap in data, a Doppler on Wheels (DOW) weather radar (funded through the National Science Foundation) is deployed at Lake Quinault. This mobile radar is commonly known for tracking tornadoes across the plains of the U.S., but for OLYMPEX, the radar is sitting still in a yard and scanning up the valley toward the mountains.
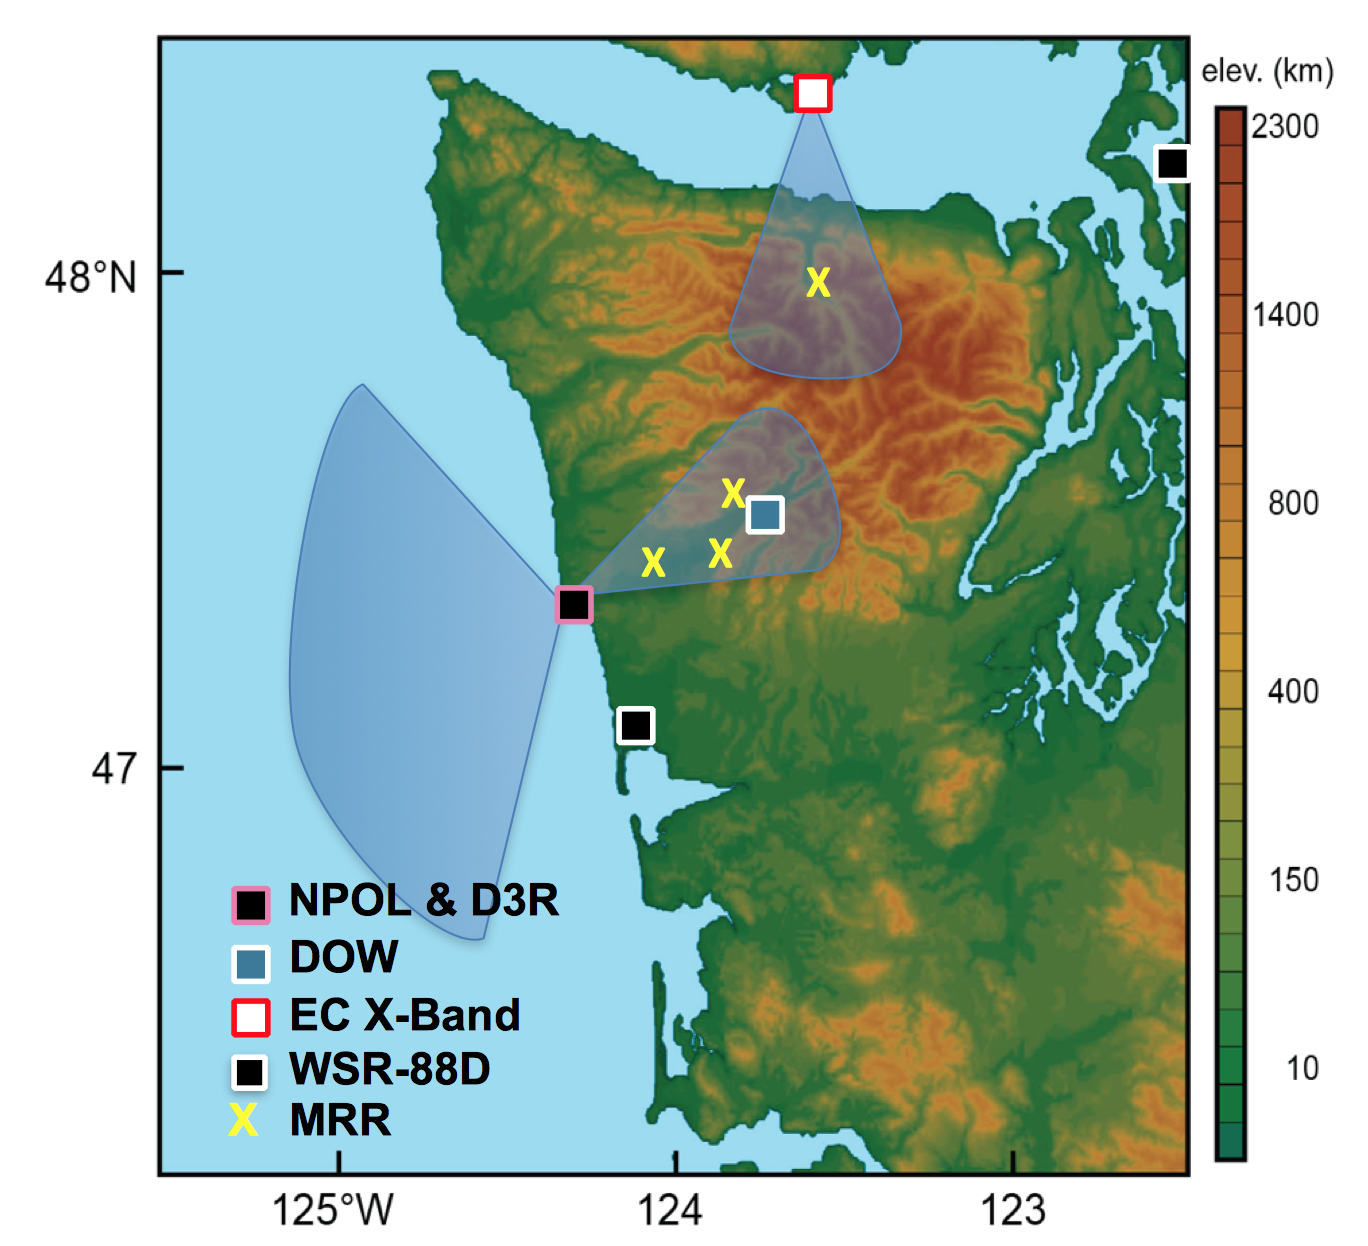
The OLYMPEX radar network showing the NPOL scanning region and the DOW location in the Quinault Valley. Environment Canada is also operating a weather for the project, scanning the northern side of the peninsula from Vancouver Island.

The Doppler on Wheels radar operating near Lake Quinault. (Photo credit: Hannah Barnes)
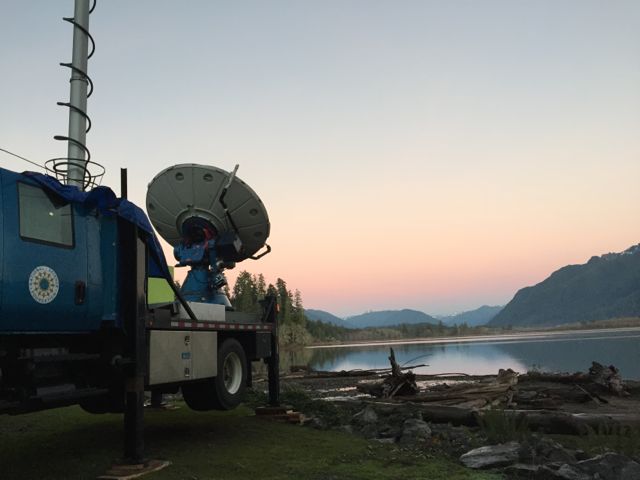
The DOW radar scans vertical slices through precipitation up the valley toward the mountains.
Inside the truck, surrounded by transmitters, antenna controls, and computers, the scientist on duty monitors the real-time data being collected, taking notes on interesting observations and making sure the quality of data is adequate. We also monitor internal and external data storage (the data is saved in several locations), make sure the radar is scanning the correct sequence, and check on other radar data to see the bigger picture beyond the valley.
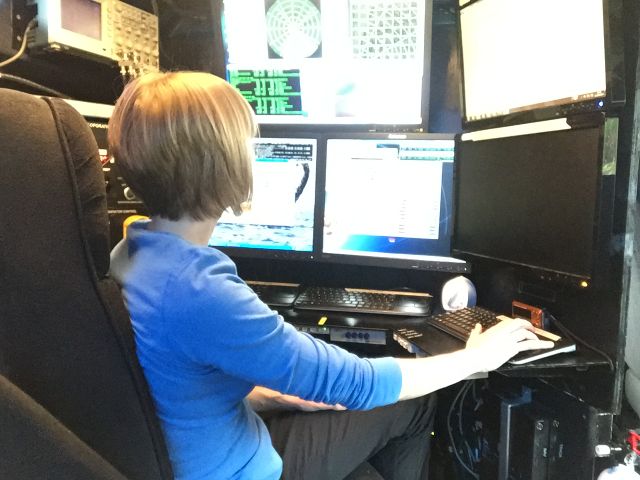
Dr. Angela Rowe (UW Research Scientist) monitoring data inside the DOW truck.
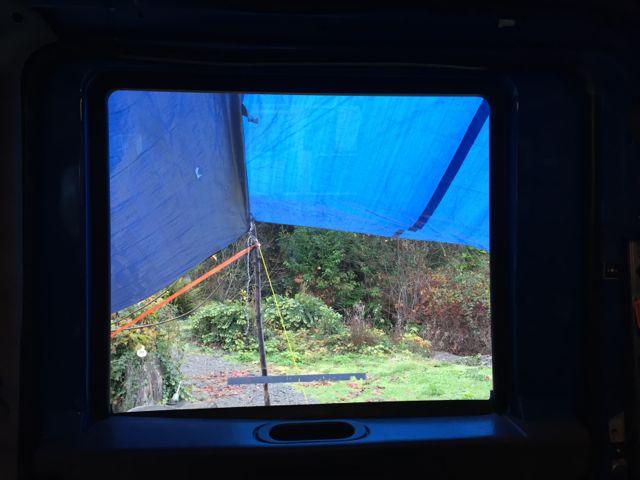
Our window to the rainforest from inside the DOW.
Here is an example of the type of data we can collect with the DOW. These images show several of the dual-polarization radar variables from a vertical slice through a precipitating storm toward the mountains. Reflectivity is the intensity that you typically associate with radar data seen on TV. In this case, weak intensities are generally observed due to the widespread light rain of this system. The higher intensity line near 2 km height is called a “brightband” and represents where the snow above is melting to form rain below. We monitor the intensity and height of this brightband scan-to-scan, storm-to-storm, and a how it changes between the radar and the mountains. The radial velocity is the Doppler portion of the radar, showing airflow towards (blues/greens) and away (reds/oranges) from the radar. In this example, most of the wind is coming from the southwest, flowing up the valley, but there’s a shallow area near the ground of down-valley flow toward the radar. This shallow down-valley flow would likely be missed by the NPOL radar near the coast, highlighting the value in having the DOW located further up the valley. The other variables shown in the bottom portion of this panel also help us understand the precipitation processes, where the brightband is seen clearly as enhanced differential reflectivity and reduced correlation coefficient.

Example of DOW radar data, showing a vertical slice through a precipitating system. Dashed arrows point to the brightband, where snow above is melting to rain below. Block arrows in the velocity image indicate the direction the air is moving.
This intriguing pattern of up- and down-valley flow has varied throughout the project, highlighting the complex influence of the local topography on the storms. We could regularly monitor this pattern on the radar, but at times, could also see the complex flow pattern by eye, as winds changing speed and direction throughout a shallow layer led to mesmerizing cloud patterns such as Kelvin-Helmholtz wave clouds.
Kelvin-Helmholtz wave clouds as viewed from the DOW site (Photo credit: Hannah Barnes)
Early in the project, a series of storms led to enough rain and snowmelt to almost have to make use of the mobile ability of the DOW. Lake Quinault rapidly rose to 14 ft, spilling into the yard and causing concern for the DOW operations.

Lake Quinault spills into the DOW yard after a major precipitation event (Photo credit: Hannah Barnes)
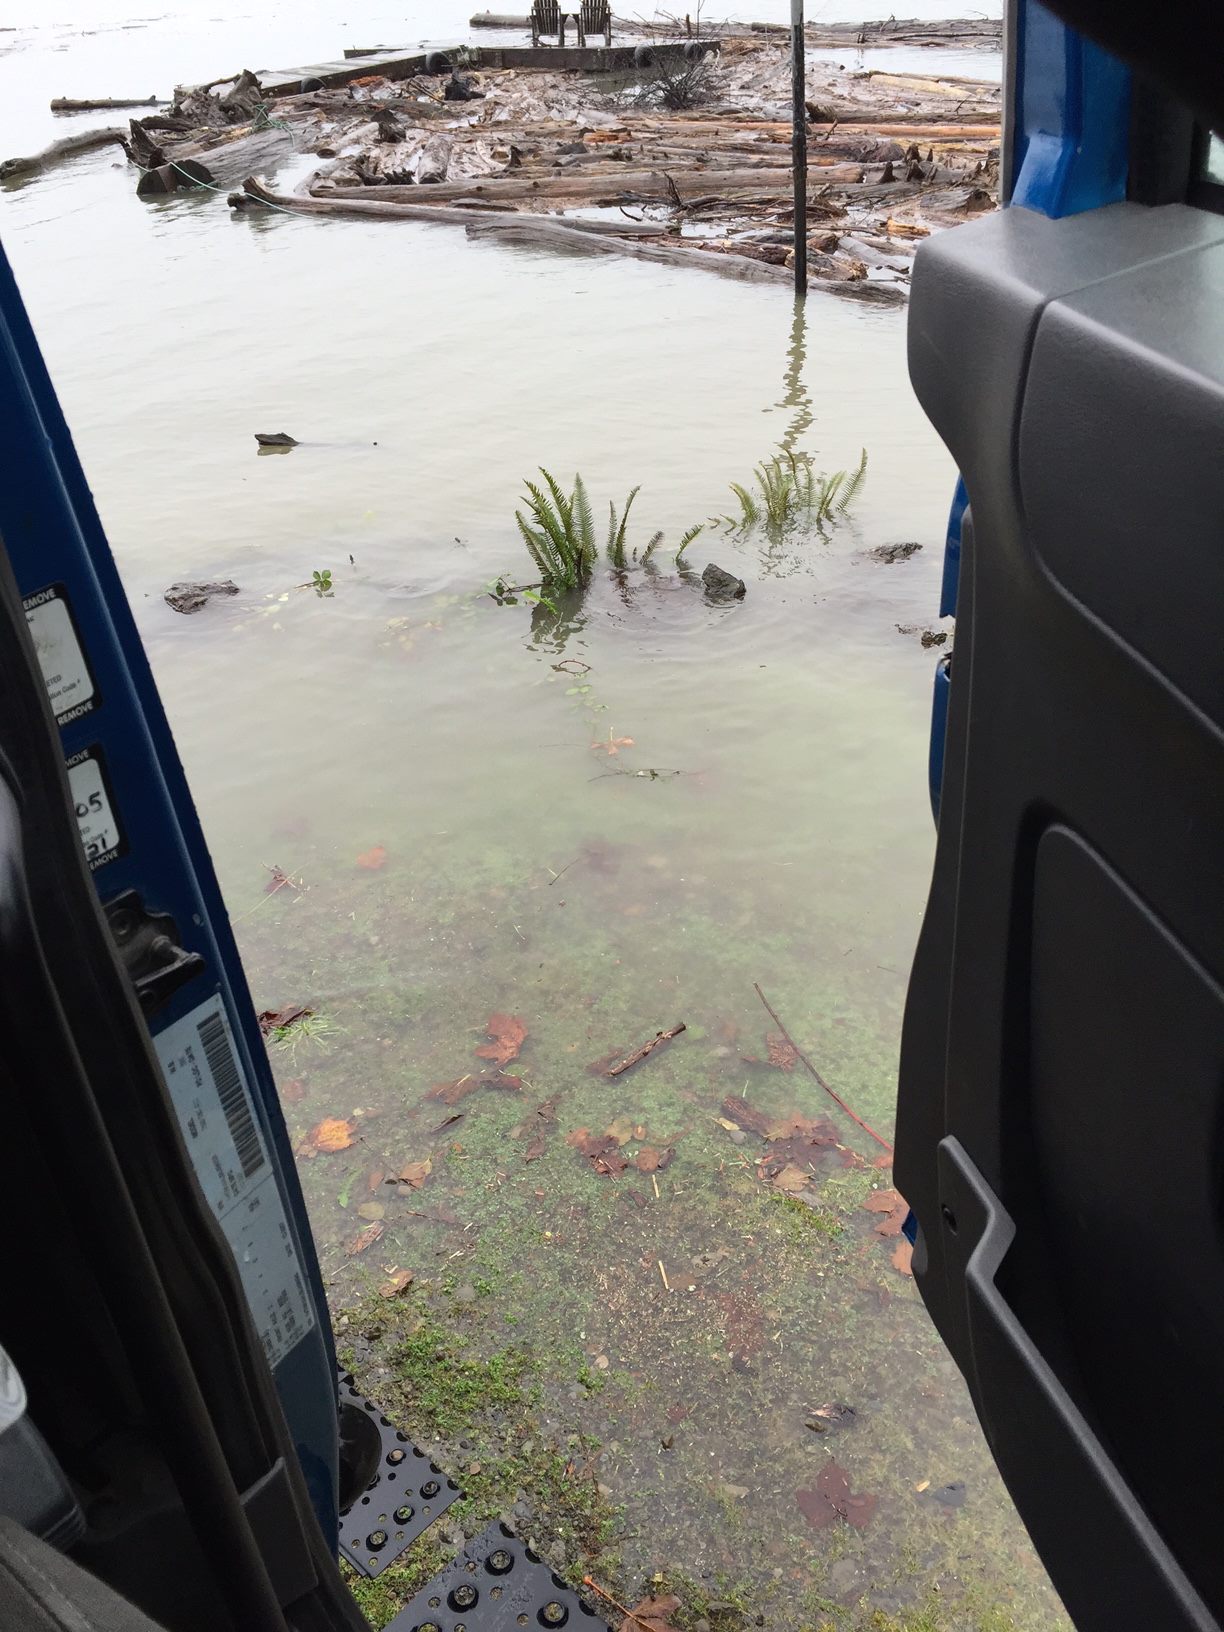
Lake Quinault knocks on the DOW door. (Photo credit: Megan Chaplin)
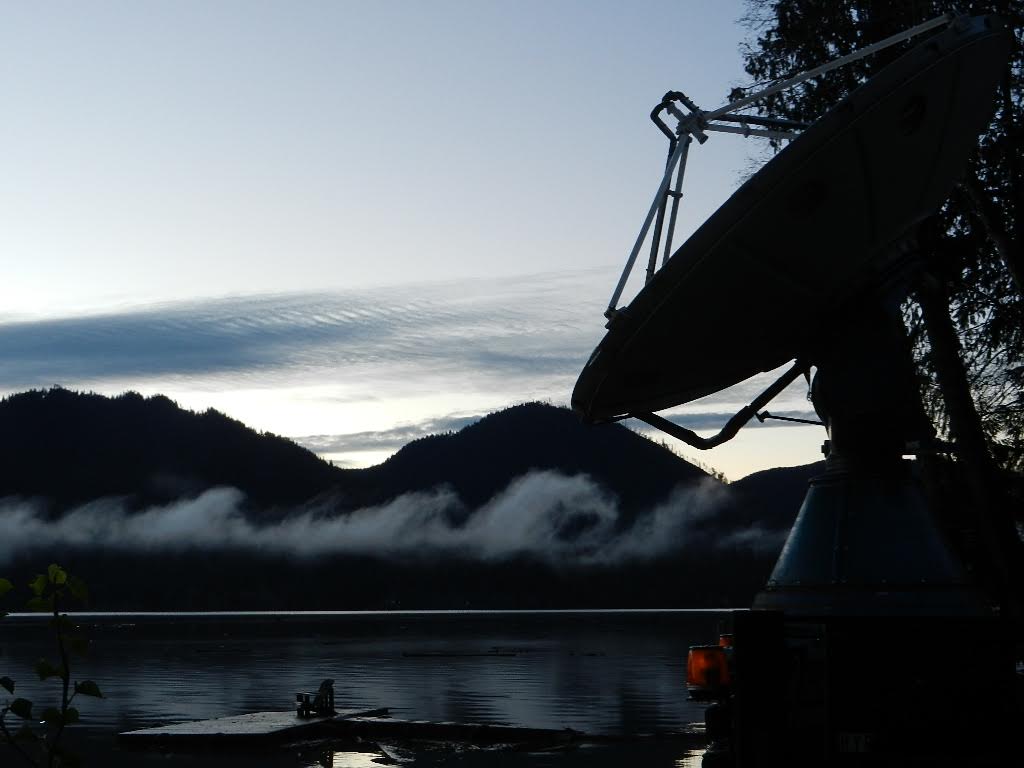
Thankfully, the precipitation stopped and the water receded before the DOW had to be moved. After this drenching start to the project, a strong high pressure system cleared the skies and halted DOW operations. The clear, calm skies led to fog formation over the relatively warmer lake, providing a beautiful view at the DOW house.
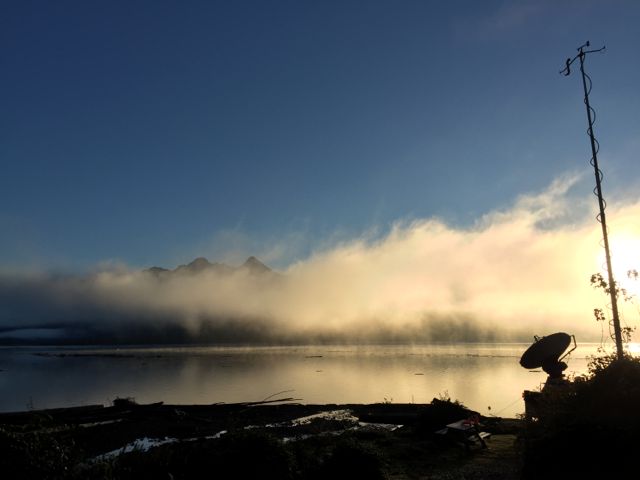
Fog over Lake Quinault as viewed from the DOW location (Photo credit: Angela Rowe)
This rain-free period allowed us to catch up on data analysis. We set up computers in the house where we could access all the data that has been collected thus far, providing us with an opportunity to dig deeper into the fascinating science of these exciting events. Plus, the view from our DOW house office isn’t so bad.
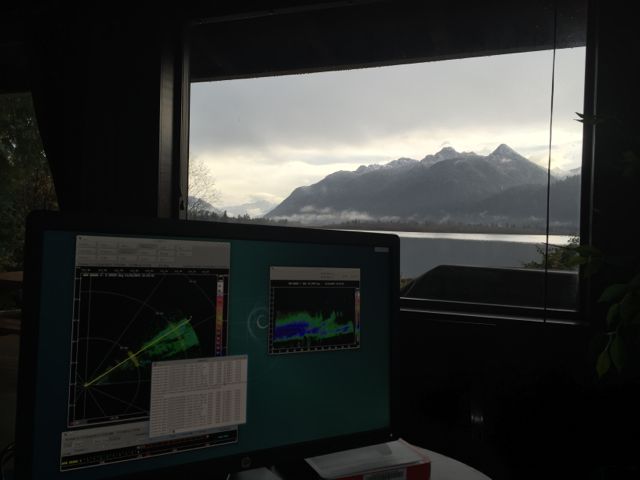
Analyzing DOW data from the DOW house office. (Photo credit: Angela Rowe)
We are so thankful for the wealth of data collected during the first few weeks of the project. And we are so thankful that the atmosphere decided to give us clear skies for Thanksgiving, allowing for the first full down day of the project. This provided many of the local participants at the UW operations center an opportunity to spend time at home with family on this holiday, while those of us at the DOW had the chance to explore the beautiful Quinault Valley.
Known as the Valley of the Rainforest Giants for the record-holding sizes of many tree species, the Quinault Rainforest reminds us of the incredible impact the large amounts of precipitation has on the area. After spending several days staring intently at computer screens, it was refreshing to gaze in wonder at the giant trees, to feel their mossy coats, to smell the fresh air and wet ground, to listen to the river and streams flowing through the valley, and to give thanks for the rain and snow we are studying that allows this beautiful place to exist.
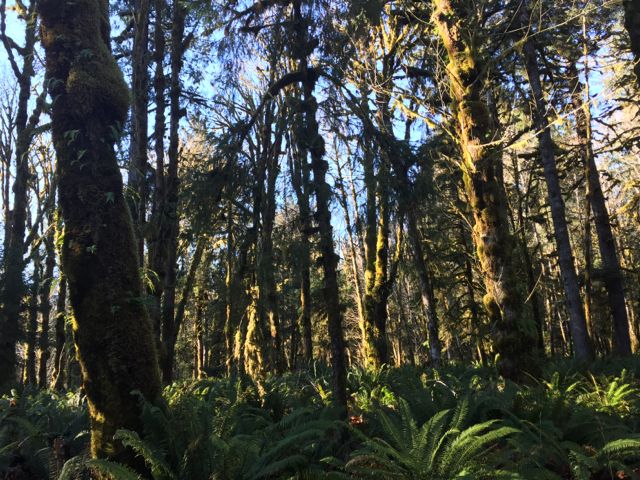
Quinault Rainforest on Thanksgiving Day (Photo credit: Angela Rowe)

Quinault Rainforest (Photo credit: Angela Rowe)
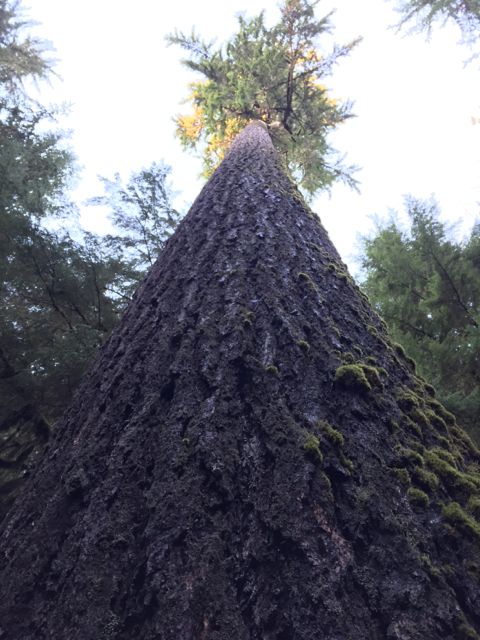
Large Douglas fir tree in the Quinault Rainforest (Photo credit: Angela Rowe)

Frosty fungus of the Quinault Rainforest (Photo credit: Angela Rowe)

Frosty fern in the Quinault Rainforest (Photo credit: Angela Rowe)
After this welcome break, the rain has thankfully returned. The DOW continues to collect fascinating data in the Quinault Valley and the forests of the valley continue to inspire awe.
Happy (belated) Thanksgiving from the DOW crew.
By Christine Dow
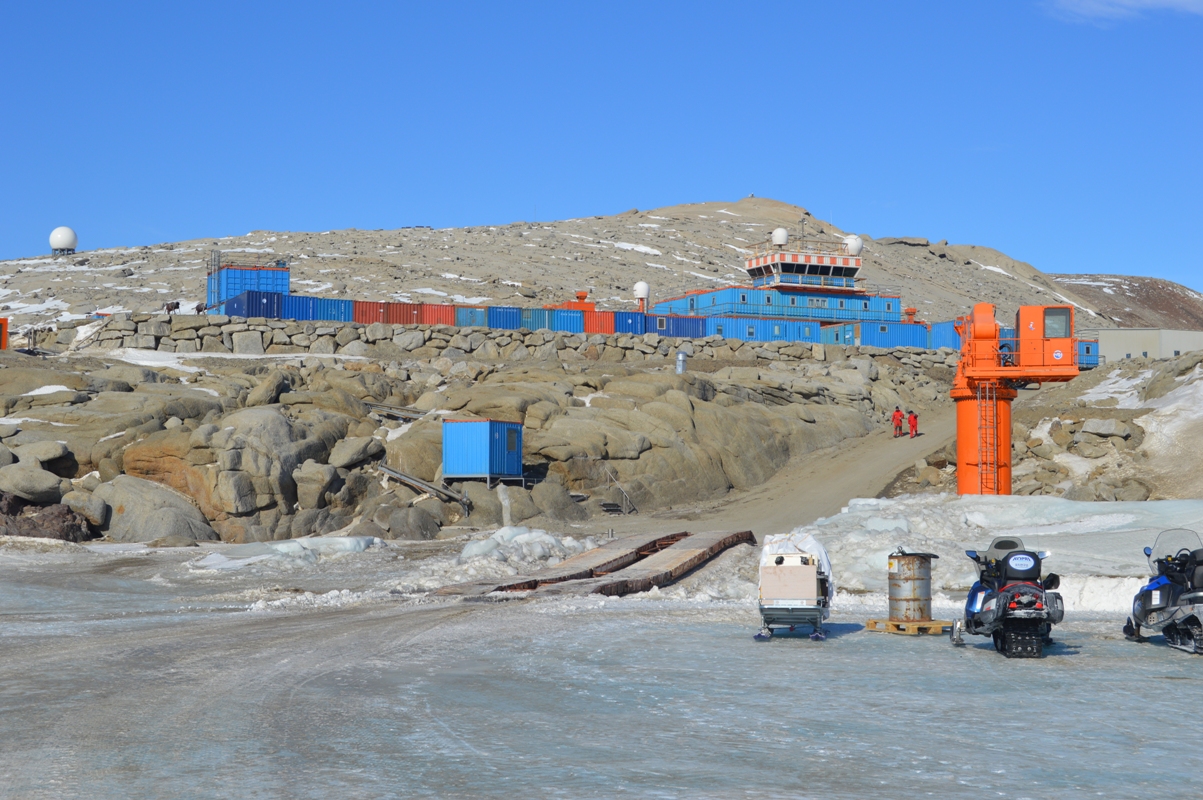
Day to day life at the base station is varied primarily by timing of our field expeditions. We’ve had some very busy days getting equipment ready, deploying and checking our gear. In between, however, we are essentially operating as we would do at the office. We have set up base in the ‘Extreme Geophysics Group’ laboratory joining seven Korean scientists. Work tends to happen six days a week, with Sunday as a break (and no 7 am wake-up music!). Also on Sundays there are sometimes mini-expeditions. For example, a group of us walked a couple of miles over to Gondwana, the German base, which is semi-inhabited (two people are there at the moment keeping things ticking over). We were hoping for some “Kaffee und Kuchen” (coffee and cake) but couldn’t find anyone around. Instead we looked at rocks ejected from the nearby volcanic Mt. Melbourne, found some lichen and watched the many skuas (seabirds) flying around. We also ventured down onto the sea ice and found a nice ice slide which entertained us for a while (who said scientists couldn’t be silly).
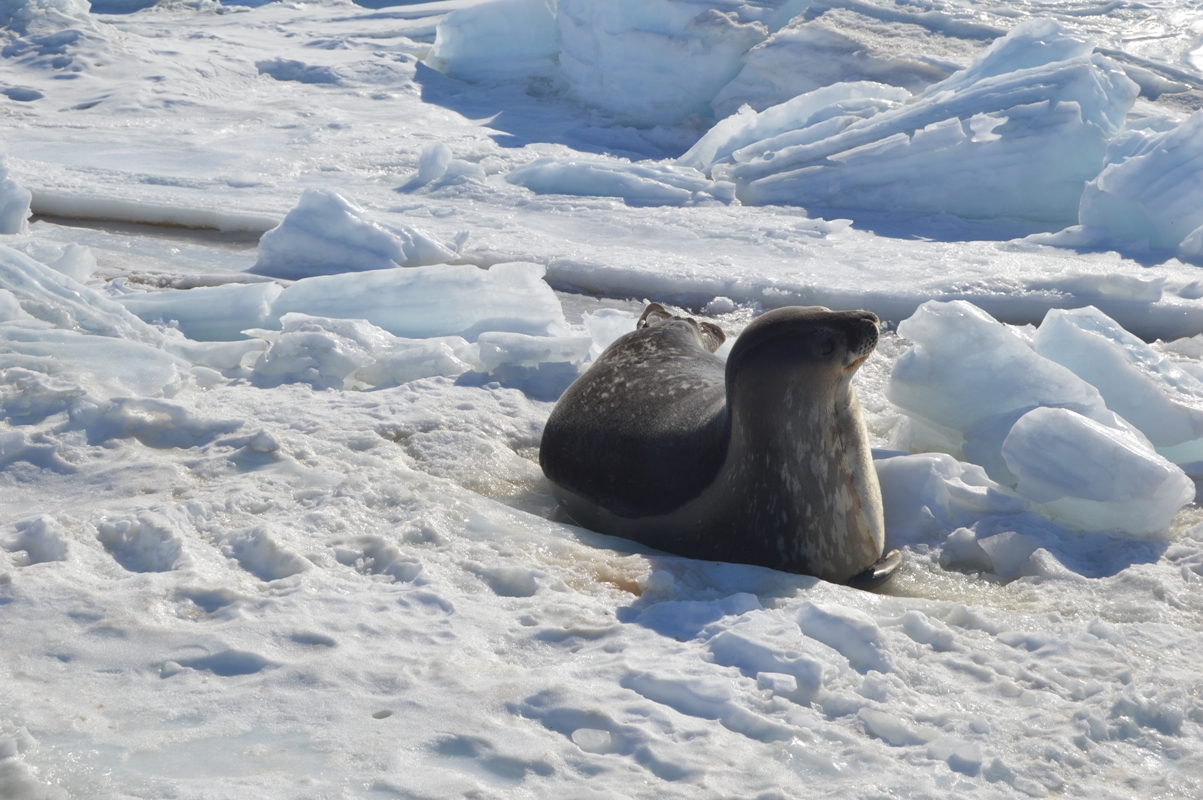
Last Sunday, Ryan and I joined a short expedition over to Mario Zucchelli, the Italian base. Recently a crack, or lead, has opened up in the sea ice so it’s no longer safe to drive the heavy Piston Bully tractors over. As an alternative, the Koreans and Italians both drove up to the crack and we exchanged passengers by hopping over the gap (it’s not really that big). There were some nearby Weddell seals hanging out near the open water, which we got a good look at. You have to be careful not to get distracted and wander into one of the seal holes which are just a bit darker than the surrounding ice – that would be a chilly surprise!
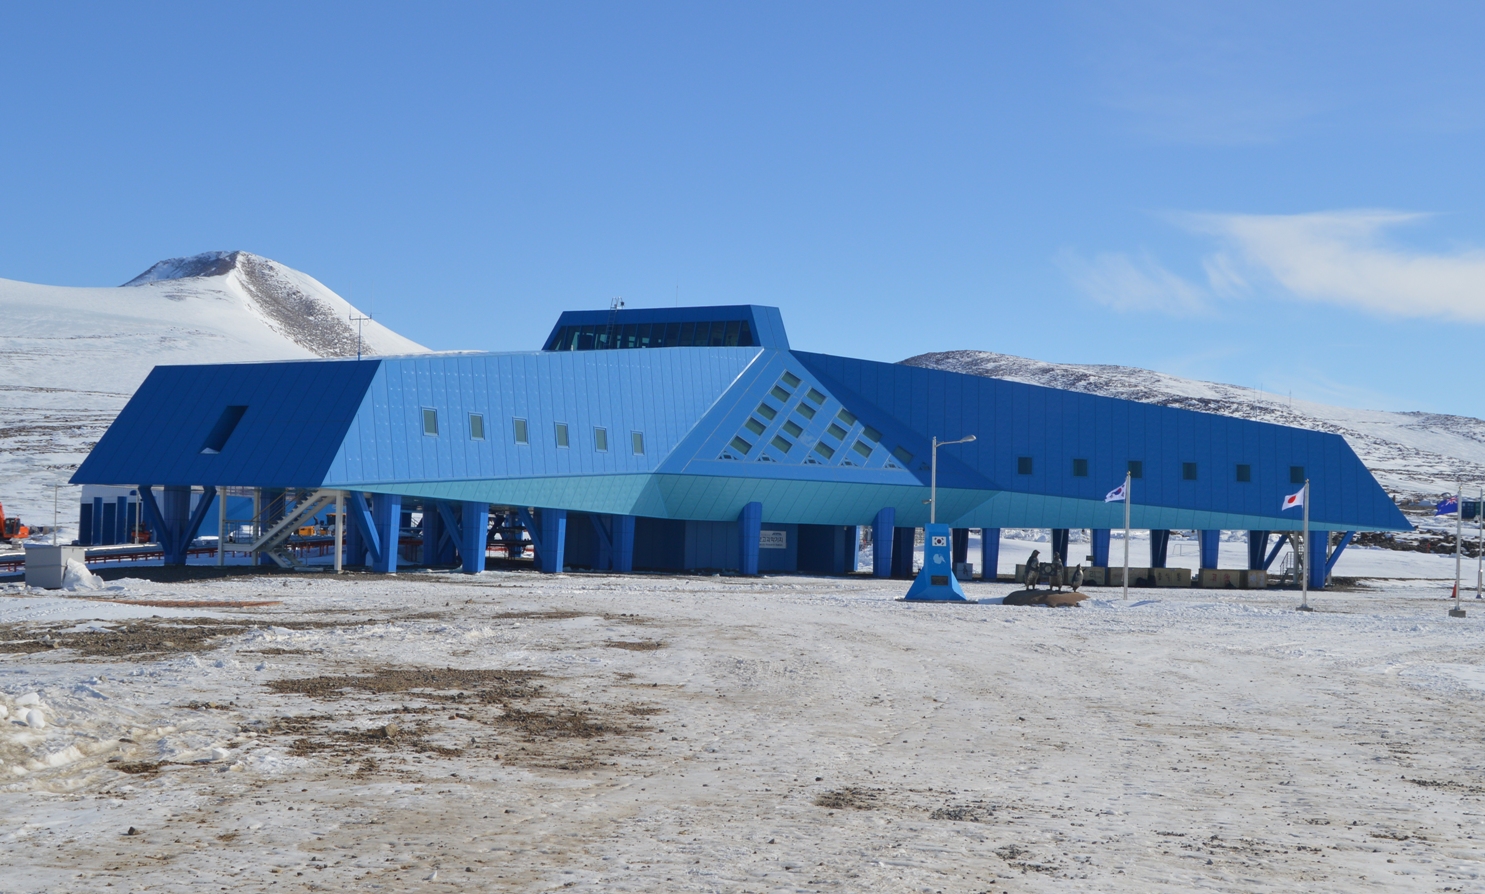
The Italian base was built 31 years ago so looks a bit more worn in than Jang Bogo but is very cosy inside. We were given a tour and fed some excellent espresso and gelato. It was really interesting to see the differences between the two bases and even the landscape. Despite being only 6 miles (10 km) apart, the rocks around Mario Zucchelli look much more weathered and eroded compared to much rougher terrain at Jang Bogo, perhaps due to the closer proximity of the volcano to the South Korean station.

At Jang Bogo, another big difference is the food and is the subject of much conversation with the Western scientists. There has been a large range of foods produced which keeps things interesting. A lot of it is a surprise since we can’t read the Korean menu, although being able to cope with spicy food is definitely an advantage (Ryan is better with this than I am). By far the best meal was Korean BBQ evening where we cooked meat and prawns on a hotplate right on the table and had a brilliant array of salad leaves (grown in house) and sundries to eat with the meat. What a meal!
By Ryan Walker

Our second day of installing equipment was on November 21. After a cloudy day off, we had perfect sunny weather.
We began by installing our two tilt meters at Comein Glacier, which flows into the Nansen Ice Shelf through a small inlet just north of the much larger Reeves Glacier. Most of an ice shelf floats freely up and down with the ocean tides, and the ice only flexes in a relatively narrow band between the floating ice shelf and the grounded glaciers that flow into the shelf. We chose this location (about 35 miles upstream of the ice shelf front) because the flexure zone is particularly wide (over three miles) and there is a broad strip of over 900 yards of ice that floats at high tide and rests on the ground at low tide. (We know this thanks to satellites that measure the height of the ice surface using lasers or radar, and to comparisons between satellite radar images that detect ice motion.) As it turned out, this area is the most spectacular place we’ve yet visited, surrounded by gleaming white snow- and ice-covered peaks.
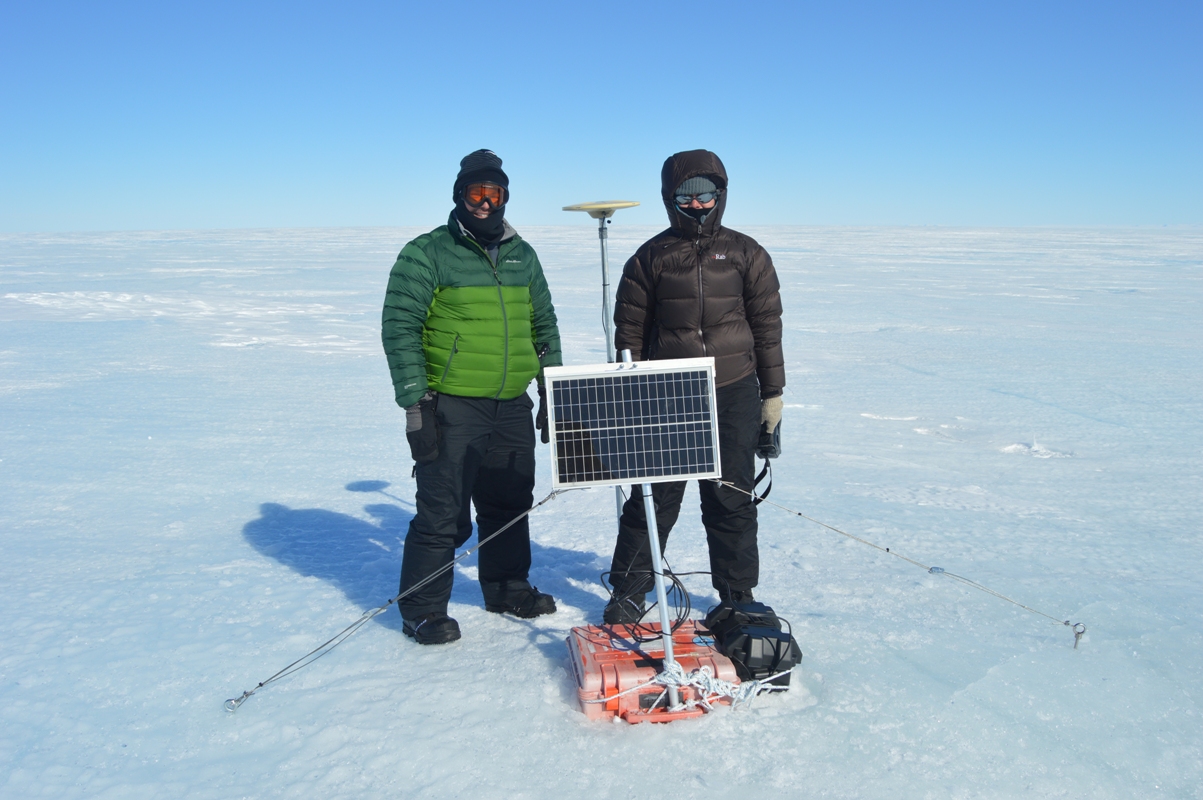
Installing tilt meters is rather tricky, since the instrument has to be almost perfectly level. After two Korea Polar Research Institute safety guides checked the area for crevasses (large cracks in the ice), we dug through about two feet of snow before finding solid ice. To keep the tilt meter level, we constructed a table from a piece of plywood supported by three aluminum pipes drilled into the ice. The pipes passed through holes drilled in the plywood, which rested on hose clamps fastened around the pipes. By adjusting the hose clamps, we leveled the plywood before placing the plastic case containing the tilt meter on top of the table. The tilt meter itself has a triangular base with three adjustable screws so it can be leveled on top of a flat plate at the bottom of the case. To do this, I had to attach a cable from the tilt meter to my computer to get readouts of the angles while Christine very carefully adjusted the screws. Once we were satisfied that the instrument was level, we hooked up a solar panel and battery for power, just as we did for the GPS stations. Finally, we buried the case and table in the snow to prevent any melting of the ice supporting the table, which could put the instrument out of level.
After sandwiches and coffee in beautiful sunny weather (certainly the most scenic picnic lunch I’ve ever had), we took some time for a school outreach project that Christine will tell you about. Then we flew back out onto the Nansen Ice Shelf (which is much windier) and installed our two remaining GPS stations with no trouble (other than a chilly half hour waiting for the helicopter to return) to complete a successful day in the field. Now we need to wait about two weeks before collecting data, so that we can see what happens to the shelf as the ocean tides go through a full cycle from spring (largest difference between high and low tide) to neap (lowest difference).

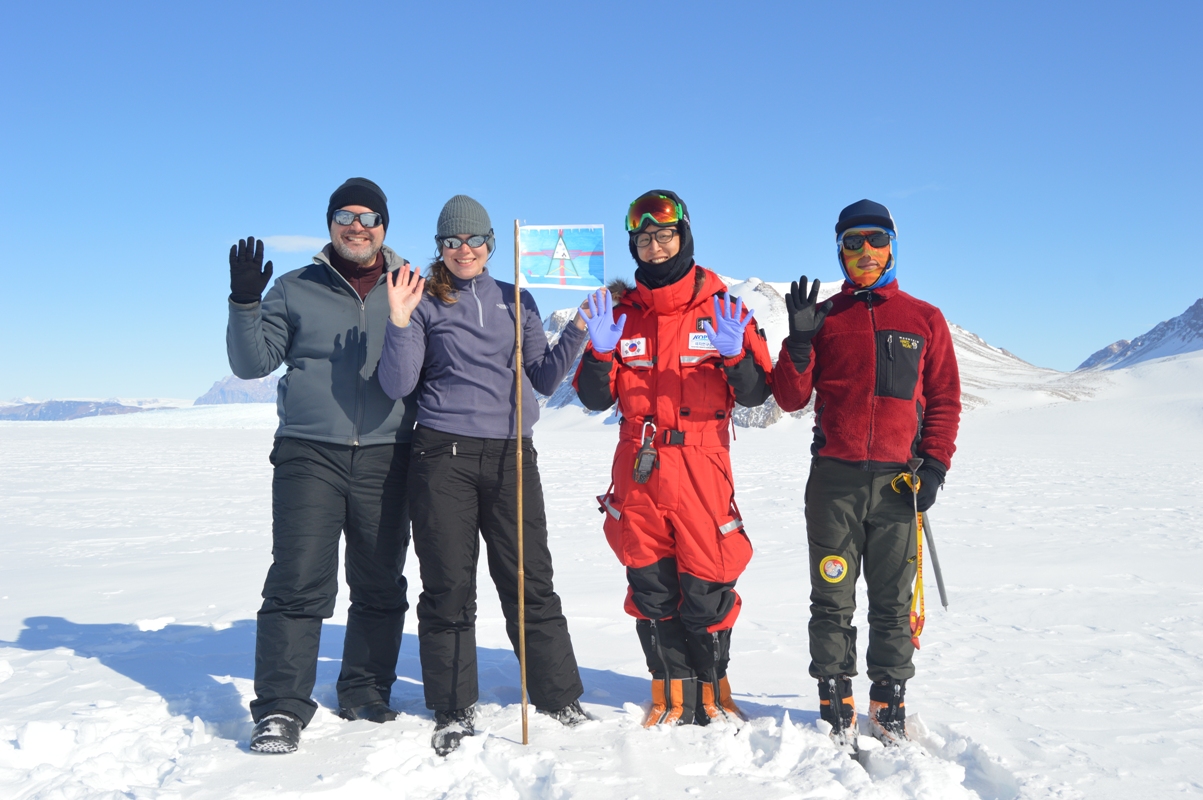
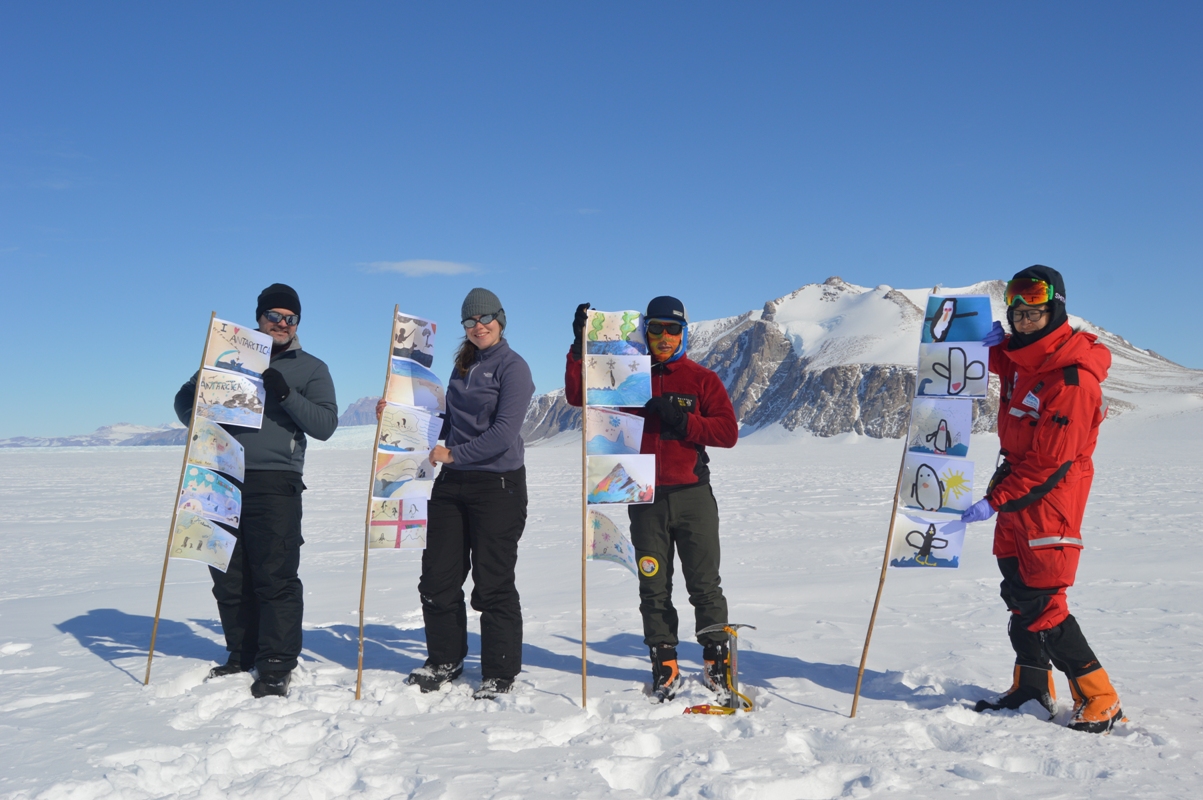
Christine says: I’m involved in a program coordinated by the United Kingdom Polar Network called “The Antarctica Day Flags Initiative”. School classes design flags for Antarctica Day (which is December 1, the anniversary of the signing of the Antarctic Treaty in 1959) and then scientists and researchers take them to the Antarctic and take photos of them out in the field. I had 21 flags from two schools (Yardley Hastings and Northrepps Primary) so we attached these to poles and took some pictures in front of some beautiful icy cliffs with our Korean colleagues.