
Ground-based weather radars are a critical component of the OLYMPEX project on the Olympic Peninsula. Situated near the coast, NASA’s NPOL radar records precipitation data over the ocean and toward the mountains. As with any scanning weather radar, the beam width and height above ground increases with distance from the radar. Therefore, even though NPOL is scanning toward the mountains, the lower portions of the Quinault Valley are being missed.
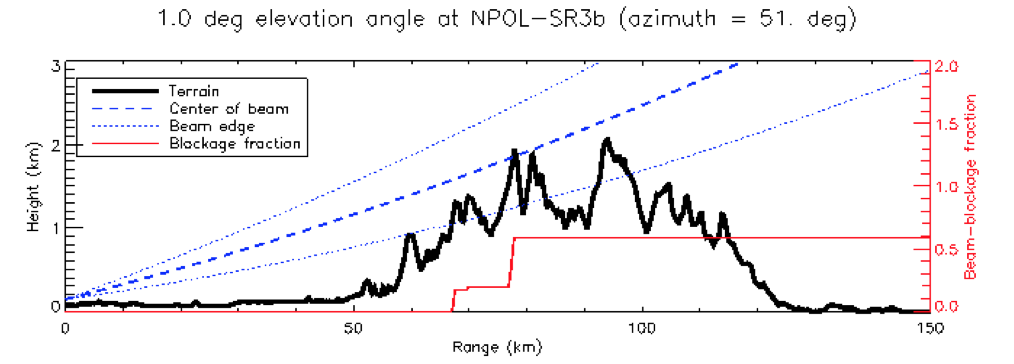
Figure showing the beam spread for a 1-degree elevation angle scan for NPOL. Terrain profile shown in black. Red line shows the percentage of the beam blocked by the terrain.
To fill in this low-level gap in data, a Doppler on Wheels (DOW) weather radar (funded through the National Science Foundation) is deployed at Lake Quinault. This mobile radar is commonly known for tracking tornadoes across the plains of the U.S., but for OLYMPEX, the radar is sitting still in a yard and scanning up the valley toward the mountains.
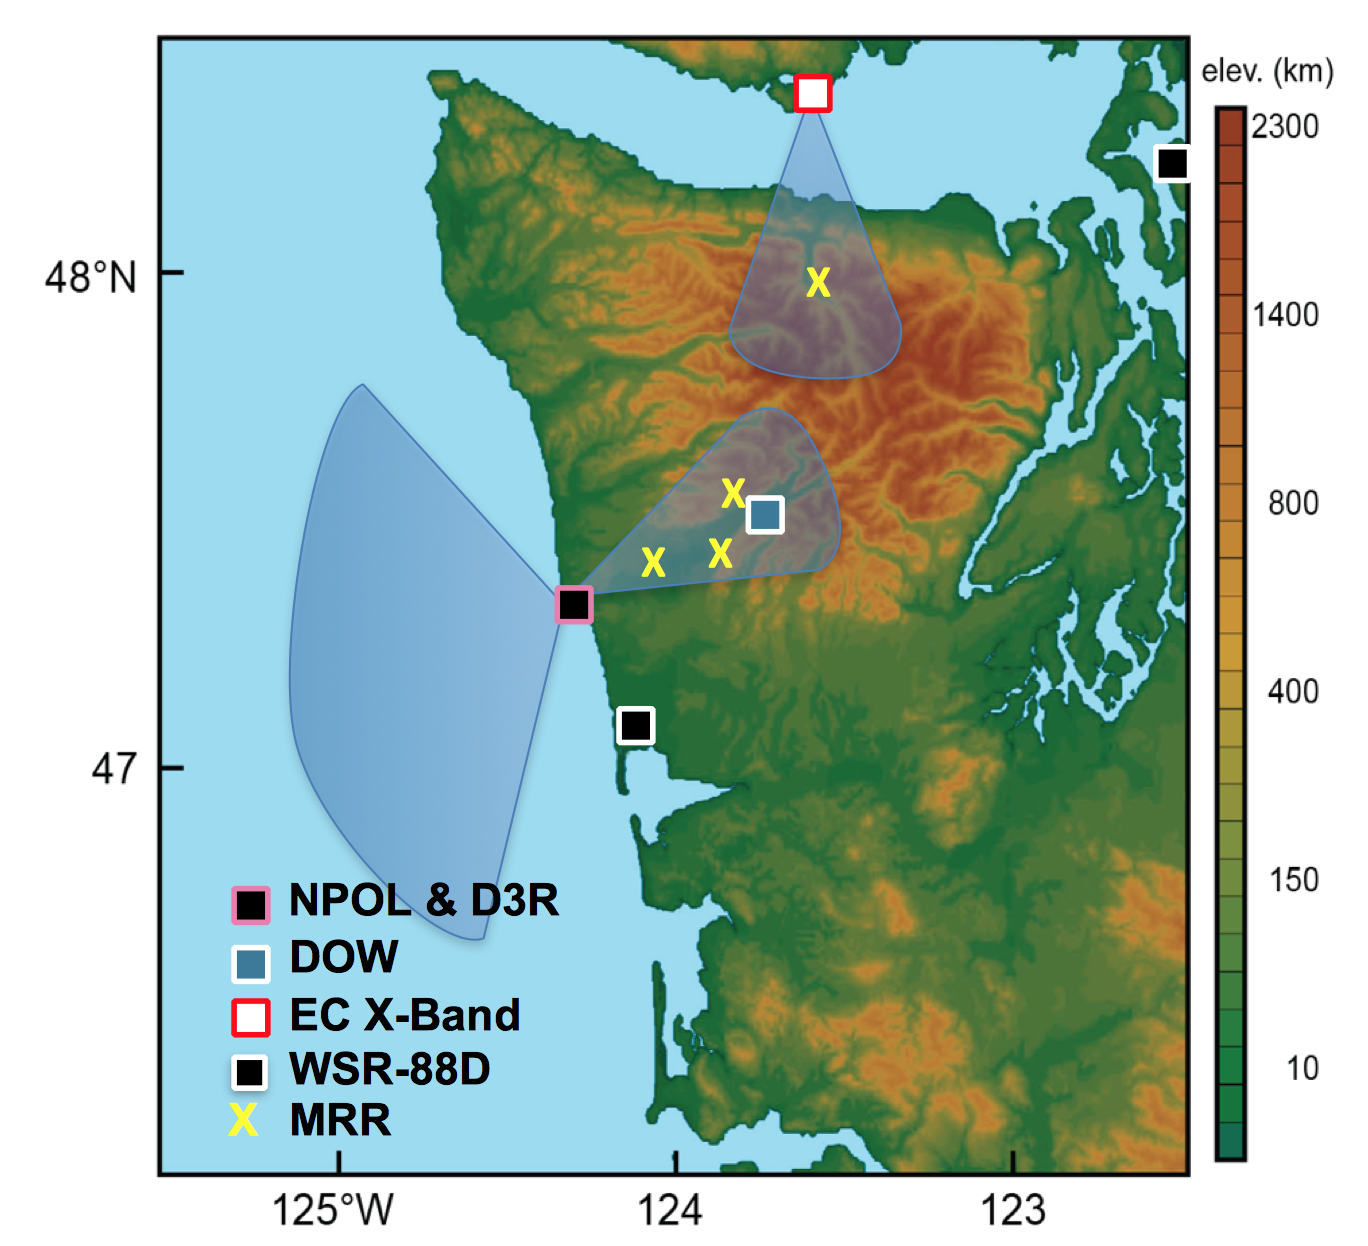
The OLYMPEX radar network showing the NPOL scanning region and the DOW location in the Quinault Valley. Environment Canada is also operating a weather for the project, scanning the northern side of the peninsula from Vancouver Island.

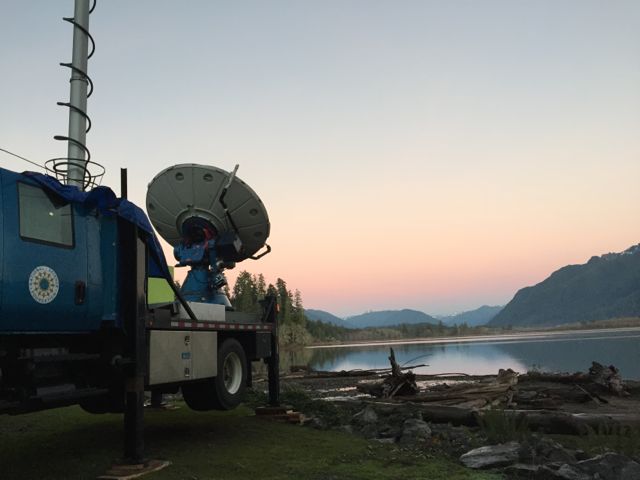
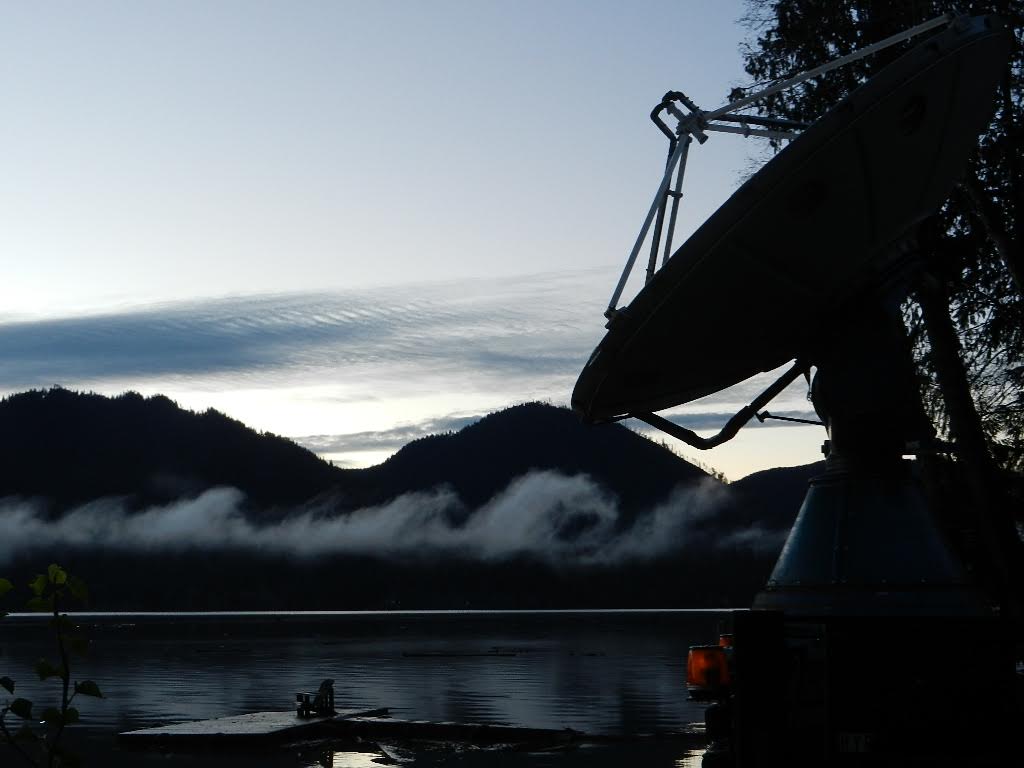
The Doppler on Wheels radar operating near Lake Quinault. (Photo credit: Hannah Barnes)
The DOW radar scans vertical slices through precipitation up the valley toward the mountains.
Inside the truck, surrounded by transmitters, antenna controls, and computers, the scientist on duty monitors the real-time data being collected, taking notes on interesting observations and making sure the quality of data is adequate. We also monitor internal and external data storage (the data is saved in several locations), make sure the radar is scanning the correct sequence, and check on other radar data to see the bigger picture beyond the valley.
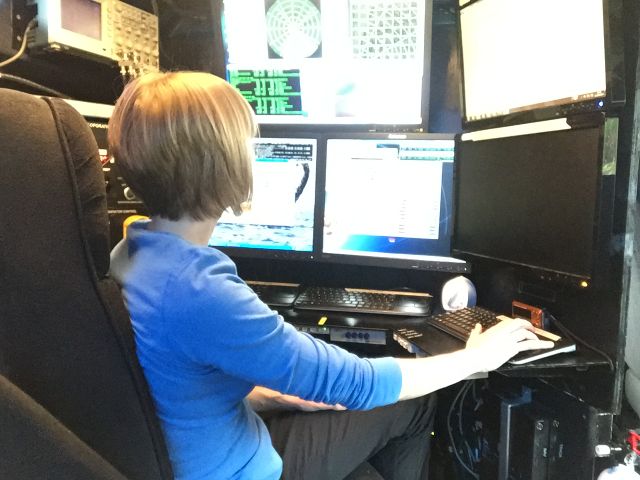
Dr. Angela Rowe (UW Research Scientist) monitoring data inside the DOW truck.
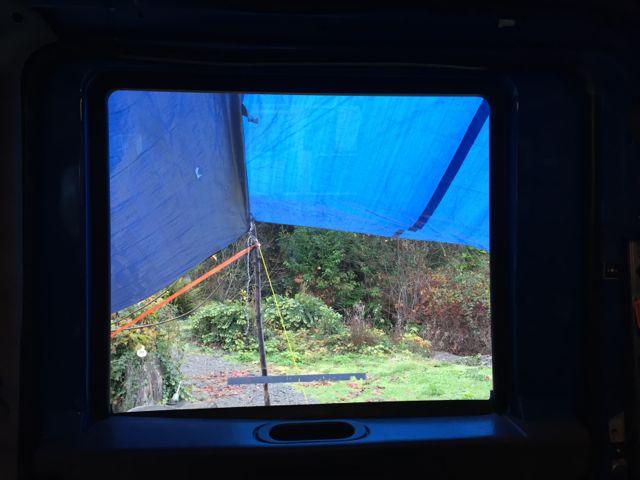
Our window to the rainforest from inside the DOW.
Here is an example of the type of data we can collect with the DOW. These images show several of the dual-polarization radar variables from a vertical slice through a precipitating storm toward the mountains. Reflectivity is the intensity that you typically associate with radar data seen on TV. In this case, weak intensities are generally observed due to the widespread light rain of this system. The higher intensity line near 2 km height is called a “brightband” and represents where the snow above is melting to form rain below. We monitor the intensity and height of this brightband scan-to-scan, storm-to-storm, and a how it changes between the radar and the mountains. The radial velocity is the Doppler portion of the radar, showing airflow towards (blues/greens) and away (reds/oranges) from the radar. In this example, most of the wind is coming from the southwest, flowing up the valley, but there’s a shallow area near the ground of down-valley flow toward the radar. This shallow down-valley flow would likely be missed by the NPOL radar near the coast, highlighting the value in having the DOW located further up the valley. The other variables shown in the bottom portion of this panel also help us understand the precipitation processes, where the brightband is seen clearly as enhanced differential reflectivity and reduced correlation coefficient.

Example of DOW radar data, showing a vertical slice through a precipitating system. Dashed arrows point to the brightband, where snow above is melting to rain below. Block arrows in the velocity image indicate the direction the air is moving.
This intriguing pattern of up- and down-valley flow has varied throughout the project, highlighting the complex influence of the local topography on the storms. We could regularly monitor this pattern on the radar, but at times, could also see the complex flow pattern by eye, as winds changing speed and direction throughout a shallow layer led to mesmerizing cloud patterns such as Kelvin-Helmholtz wave clouds.
Kelvin-Helmholtz wave clouds as viewed from the DOW site (Photo credit: Hannah Barnes)
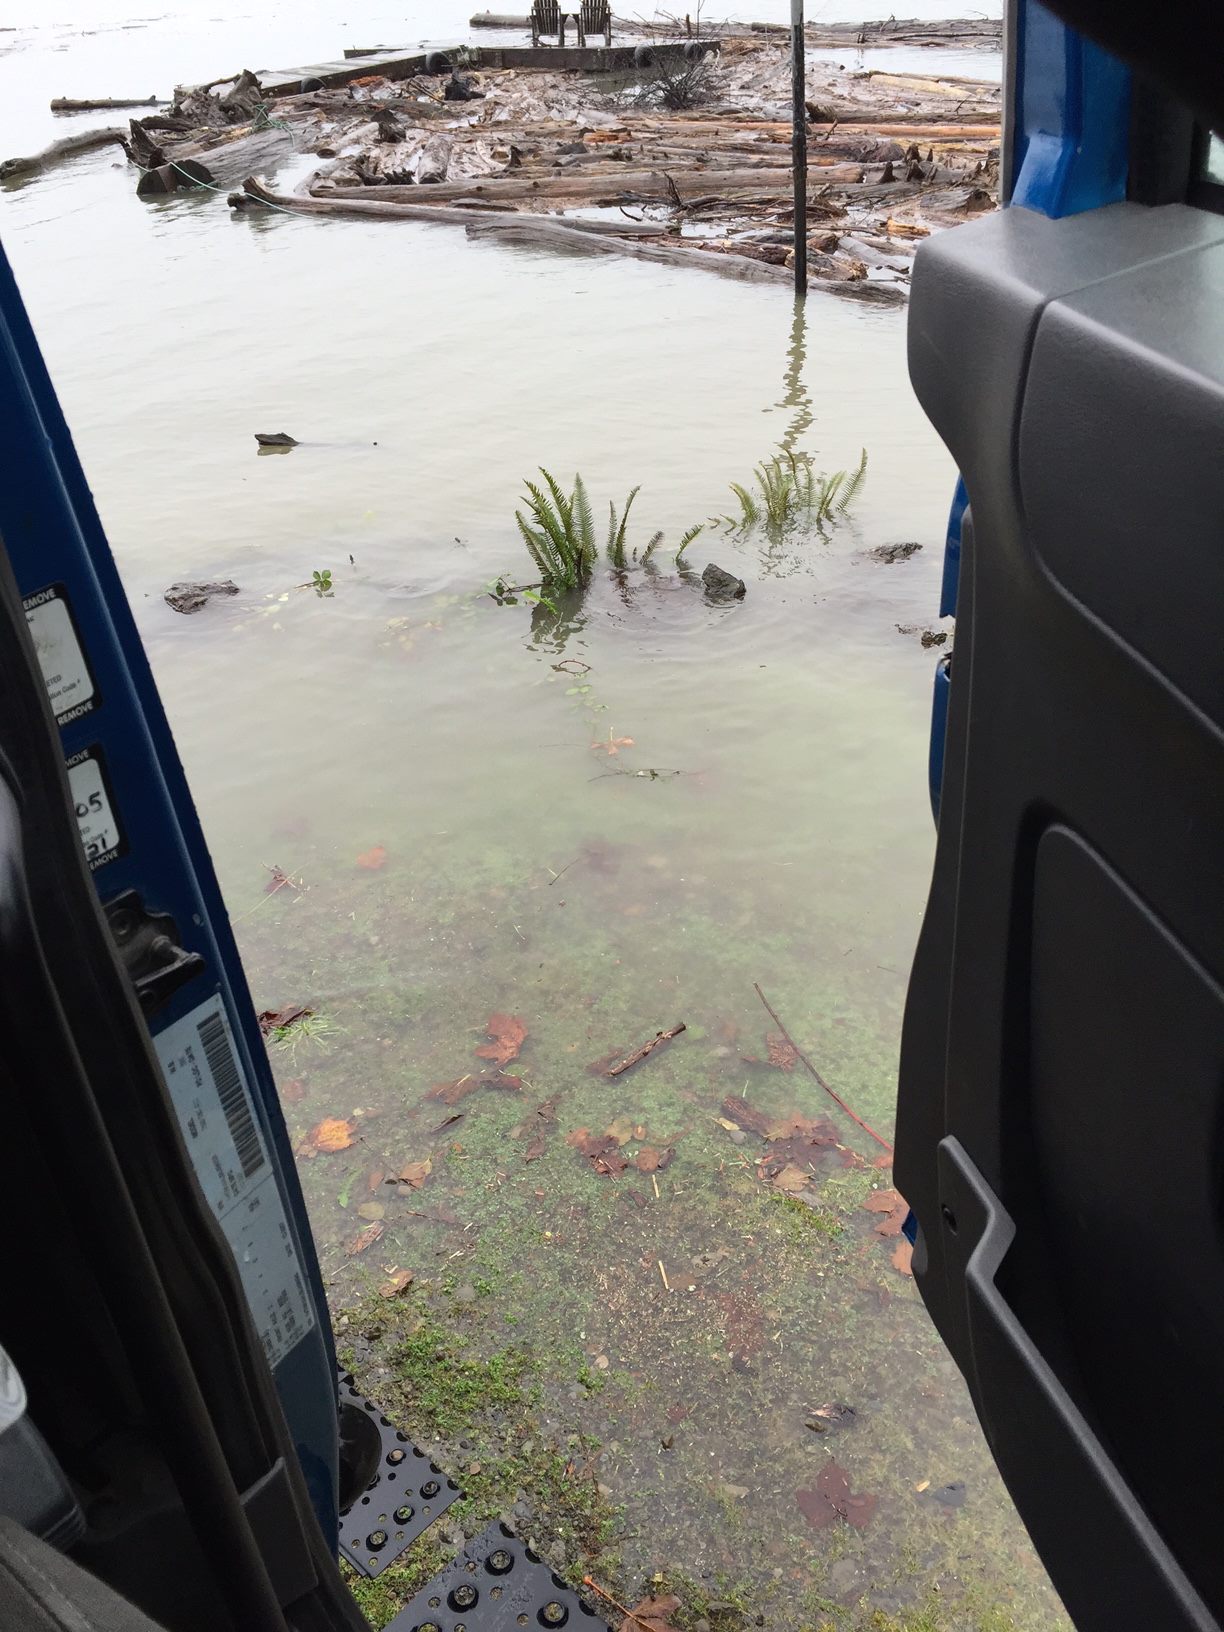
Early in the project, a series of storms led to enough rain and snowmelt to almost have to make use of the mobile ability of the DOW. Lake Quinault rapidly rose to 14 ft, spilling into the yard and causing concern for the DOW operations.

Lake Quinault spills into the DOW yard after a major precipitation event (Photo credit: Hannah Barnes)
Lake Quinault knocks on the DOW door. (Photo credit: Megan Chaplin)
Thankfully, the precipitation stopped and the water receded before the DOW had to be moved. After this drenching start to the project, a strong high pressure system cleared the skies and halted DOW operations. The clear, calm skies led to fog formation over the relatively warmer lake, providing a beautiful view at the DOW house.
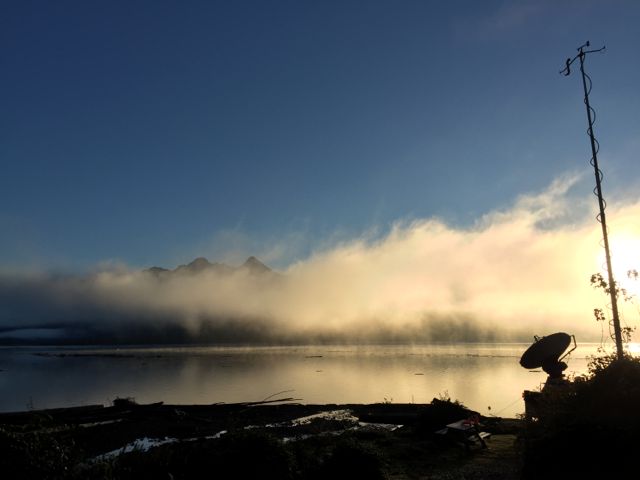
Fog over Lake Quinault as viewed from the DOW location (Photo credit: Angela Rowe)
This rain-free period allowed us to catch up on data analysis. We set up computers in the house where we could access all the data that has been collected thus far, providing us with an opportunity to dig deeper into the fascinating science of these exciting events. Plus, the view from our DOW house office isn’t so bad.
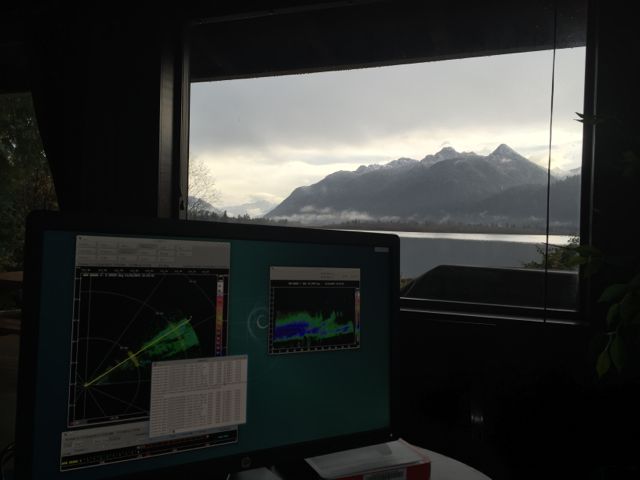
Analyzing DOW data from the DOW house office. (Photo credit: Angela Rowe)
We are so thankful for the wealth of data collected during the first few weeks of the project. And we are so thankful that the atmosphere decided to give us clear skies for Thanksgiving, allowing for the first full down day of the project. This provided many of the local participants at the UW operations center an opportunity to spend time at home with family on this holiday, while those of us at the DOW had the chance to explore the beautiful Quinault Valley.
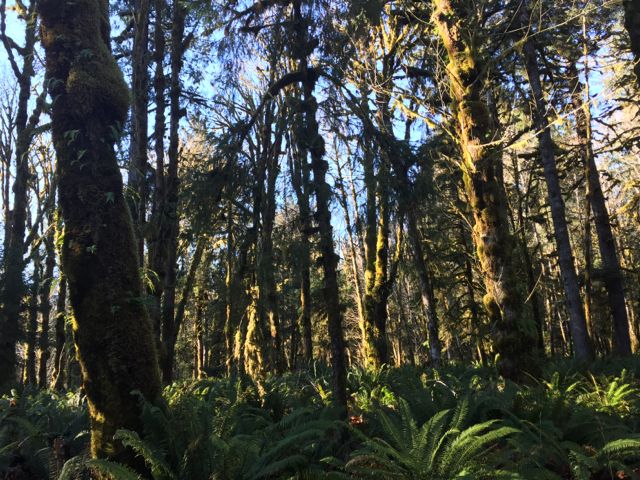
Known as the Valley of the Rainforest Giants for the record-holding sizes of many tree species, the Quinault Rainforest reminds us of the incredible impact the large amounts of precipitation has on the area. After spending several days staring intently at computer screens, it was refreshing to gaze in wonder at the giant trees, to feel their mossy coats, to smell the fresh air and wet ground, to listen to the river and streams flowing through the valley, and to give thanks for the rain and snow we are studying that allows this beautiful place to exist.
Quinault Rainforest on Thanksgiving Day (Photo credit: Angela Rowe)

Quinault Rainforest (Photo credit: Angela Rowe)
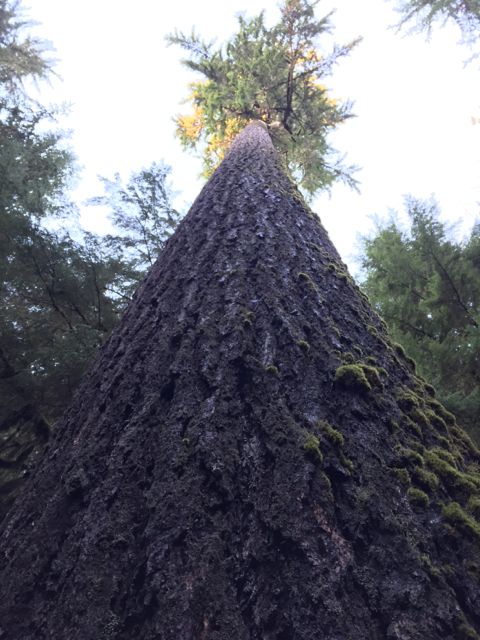
Large Douglas fir tree in the Quinault Rainforest (Photo credit: Angela Rowe)

Frosty fungus of the Quinault Rainforest (Photo credit: Angela Rowe)

Frosty fern in the Quinault Rainforest (Photo credit: Angela Rowe)
After this welcome break, the rain has thankfully returned. The DOW continues to collect fascinating data in the Quinault Valley and the forests of the valley continue to inspire awe.
Happy (belated) Thanksgiving from the DOW crew.
I live down the coast in Ocean Shores and volunteer my rain gauge results with CoCoRaHS. I have noticed a new (?) site from Quinault….is that you?
Your timing is great for our most recent storm (yesterday, 12/8), and the rest of this week, through Monday. You better move the truck!
Impressive work. The product of people who are dedicated to their work.