By Clement Miege
Hi there! After more than three weeks spent in the field, our team is very happy to be finally back, with many memories of the traverse. This year has been a very intense experience and I would like to tell you a little more about this expedition. I will focus on the days we were doing radar surveys. Indeed, two different studies were set up during this field work. The first one was during the traverse days, where we did a radar survey from one camp to another with a range of 50-90 kilometers (31-56 miles) between the camps. On the other days the surveys were smaller, set up around each camp; they consisted of a 10-km bowtie and a 280- by 280-meter (918- by 918-ft) grid to get a better idea of the spatial variability of snow layer depth surrounding each core site. These grid surveys will show us how representative the ice core is compared to the surrounding area and help answer the question of whether we would have gotten a different result if we had drilled our ice core a few paces this way or a few paces that way. We were also looking more in detail at the layering in a 2-meter (6.56-ft) snow pit; to do that, we were using a metal plate at different depths of the snow pit.
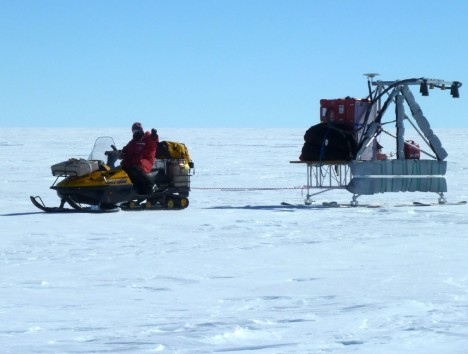
Here is a picture showing the two radars that operated simultaneously on the sled:
Both radars looked at the first 20 meters of the snow pack, sending electromagnetic waves into the snow. The snow radar (the big green horns in the picture) operates in a frequency range of 2-8 GHz. The other radar (the smaller brown horns) is the ku-band radar, sweeping between 12 to 18 GHz. The lower the frequency, the deeper the radars look. We have both radars for some redundancy in the system, imaging the snow/firn closest to the surface, which we core twice, and then the snow radar peers deeper than the cores to provide literally a deeper look. In addition to the 2 radars, we needed to know the elevation we were at, which is important for comparison with airborne data and also for modeling precipitation and temperatures. For that, we simultaneously collected GPS coordinates, which gave us our exact latitude, longitude and elevation every 5 seconds. The GPS antenna was on the very top of the sled, about 2.5 meters (8.2 feet) high.
On this sled, beside the radars sitting in the red box, we had packed: a blue bag, two black duffel bags and an orange bag. The blue bag was a survival bag, with all the gear needed in case we would have been caught in a storm; it included a tent, a stove, a shovel, and some food. The two black bags contained Ludo’s and my sleep kits, and the orange bag had some extra food, in case we were stuck for couple days. For the snow mobile, we had a repair kit under the seat to troubleshoot a possible failure. We were carrying two extra cans of gas as well. With this set-up, we were able to get a pretty light sled that was still comfortable and had all the gear we’d need in case of a storm or other circumstance separated us from the rest of the team, who were carrying all the camp gear. Fortunately, this never happened!
But now, let’s go back to the survey. The travelling days were the ones where the team was the most vulnerable: while we were traveling we had no shelters or camp set up to get back to if anything went wrong because we had to break down the entire camp in the morning, pack all gear on the sleds and ride with the snowmobiles pulling the sleds to the next camp. After driving between 50-90 km (31-56 mi), we would build our new camp, usually that same day in the afternoon. We had a total of seven travel days, covering a distance of about 500 km (310 mi).
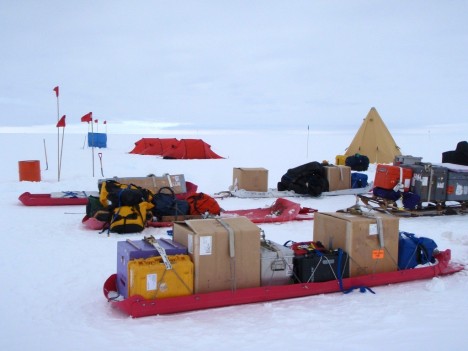
During travel days, the radar team left camp first, mostly because we had to drive at low speed to ensure the radar’s safety. Indeed, on the days we ran into large sastrugi (small ridges of hard snow), we drove at less than 10 km/h (6.2 mph). These sastrugi made our travel a little bit more difficult. Toward the end of the day, the team responsible for breaking down camp would leave the radar team and go 20 km (12 mi) ahead, to start setting up the new camp.
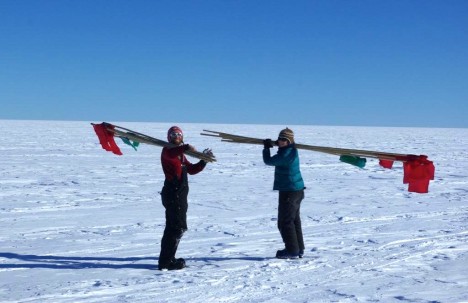
The days we were at camp, we did some small radar surveys: a bowtie and a grid around the core site. To help us drive the snowmobile straight for the grids, we set up flags to visualize the corners and sides. In the deep field, everything is white and flat, so it is hard to maintain a nice bearing just by following the GPS for such a small grid.
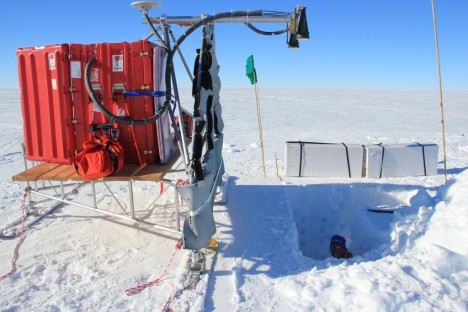
The last side survey with the radar was done in the snow pit. After analyzing the snow pit and picking up snow samples for further laboratory analysis, we used the pit to calibrate the radars and look at a detailed snow layering for the top 2 meters.
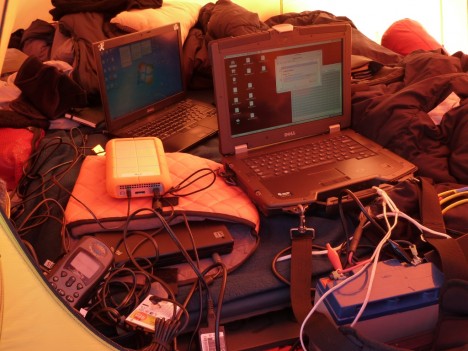
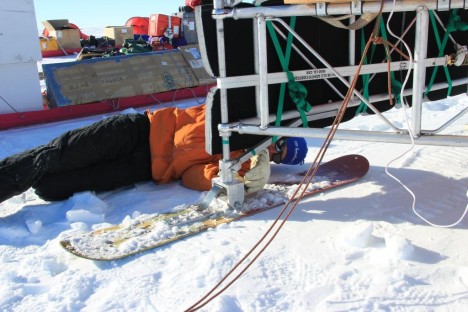
To conclude, I want to say that this traverse was definitely an amazing experience and I was happy to share such a good time with the team. I am already excited to start looking at the radar data in detail to see what we can learn of the past few decades of snow accumulation in this part of the West Antarctic Ice Sheet.
Tags: Antarctica, NASA, radar, snow, snowmobile, WAIS, West Antarctic Ice Sheet


wow cool pictcures, i like picture of recharging station.
As i look at the equipment, it seems like you had to do a lot of repetitive connecting for every set of observations. Perhaps it went fast because you were familiar with it, but what adaptations of regular field equipment did you make – or would you make – that could speeed up and simplify the process with cold hands and poor light?
Best wishes, and thanks — Rich