By Eric Lindstrom
Are we there yet?
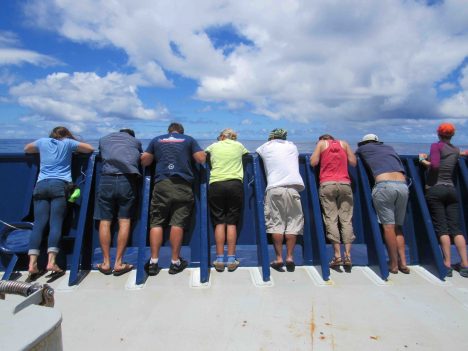
A six-week voyage on the open ocean is not for everyone. On this trip we had plenty of veterans and few first timers. Channel fever is commonly considered something that happens at the end of a voyage as you head for port. It is maybe easier for those of you ashore to picture as akin to spring fever at the end of winter. I would like to describe a more comprehensive theory of voyage feelings that is more akin to the five stages of grief. Maybe it should be called the five stages of channel fever?
For grief, the five stages are denial, anger, bargaining, depression and acceptance. For channel fever, the five stages are sickness, interest, boredom, excitement, and port. Like grief, they are not some stops along a linear timeline (except maybe port!), but tools to help us recognize what we are thinking and feeling. In this theory of channel fever it occupies the entire voyage.
Sickness
Getting your sea legs is the first hurdle of the voyage. It starts in the harbor channel and impacts people in different ways. Headaches, queasiness, and overwhelming sleepiness are all symptoms. This phase is definitely a downer and modern medicine has sought to treat it with drugs. Some unfortunates never get past this stage.
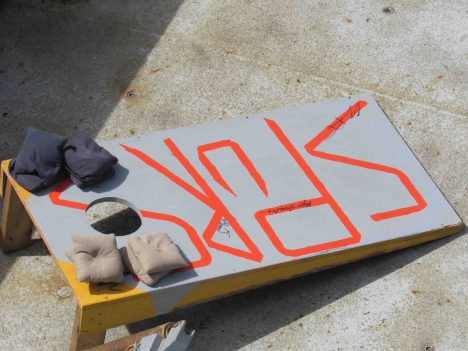
A game devised to forestall channel fever.
Interest
A core feeling early in voyages is interest in all the stuff that other people are doing that of which you have not yet become familiar. The ship is small, so any new things to see or do certainly focus your attention. Good mariners can make the simplest chores and routines the subject of great interest and focus. They know that you should hold this feeling as long as possible. It’s deadly if you move on to boredom too soon. Maybe my blogging style gains strength from this stage of channel fever?
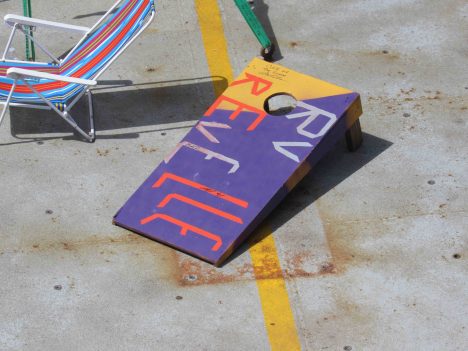
Two teams, eight bean bags and two targets = hours of amusement.
Boredom
Once you have mastered your work and everyone else’s chores, interest fades and boredom takes over. Ideally, you would like this feeling to be minimized. Therefore, sea veterans are adept at invention of new games, procedures, routines, and making anything that is even halfway interesting last as long as possible. You may have wondered why people come back from sea with weird new skills like knot tying or macramé. It’s because of trying to fight boredom!
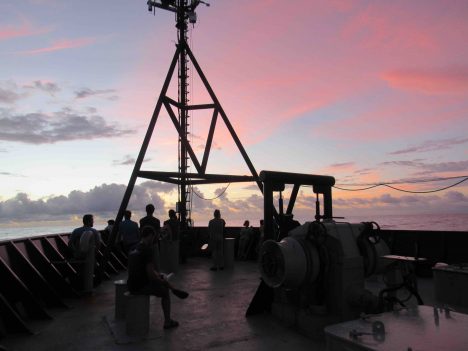
End of a long day of packing and dreaming of home.
Excitement
This is the classic feeling of channel fever and its penultimate stage. Long after sickness, interest, and boredom, it is usually the time when all your hopes hang on finishing the trip and getting back to life ashore. Usually this stage alone is what people refer to as channel fever because the emotional symptoms are closely associated only with proximity to voyage end and no other known cause.
Port
The final stage of channel fever and resolution (in my theory) of the malady come with arrival in port and being homeward bound. Resolution (port) is often a highly celebrated event. The modern cure for channel fever is solid ground and a cold beer. Really, we don’t know if beer has anything to do with this, however there seems to be a close association between beer and miraculous recoveries in port! The science party on R/V Revelle is hosting a post-voyage happy hour ashore later in the day we arrive, just to make sure everyone receives the cure.
Cheers!
By Eric Lindstrom
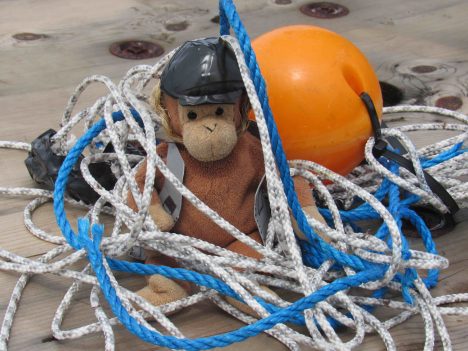
Monkey makes its own mess!
Long ago on a planet very similar to our own, oceanography was done without the Internet or regular communication with shore. It required careful planning and forecasts of the conditions to be encountered were vague at best. Executing the original plan of work for a voyage was always a good objective.
Unlike those days on that planet, the shipboard work of SPURS-2 seeks to optimize our operation as we go by depending on a “dry team” ashore for a daily flow of information. The information comes from a number of sources including satellites, in situ data (data collected in place), models, and combinations of these sources. The daily flow of information comes to us via the Internet in a “tarball.” In computing, tar is a computer software utility (originating from Tape ARchive) for collecting many files into one archive file, often referred to as a tarball. Scientists on R/V Revelle receive the daily tarball assembled by our dry team at the NASA Jet Propulsion Laboratory (in association with many SPURS-2 scientists ashore). The tarball contains files for daily weather and oceanographic analysis and a wealth of ancillary information. The tarball is information desired by the team aboard the ship, a key point that should not be overlooked in the following discourse.
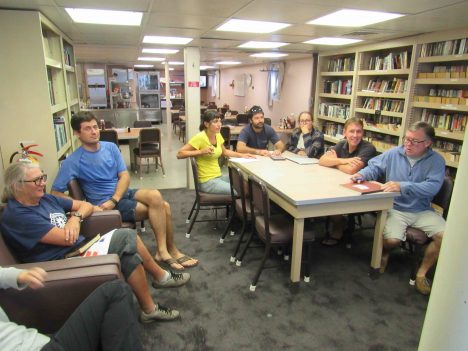
SPURS-2 planning is a daily occurrence in the R/V Revelle library. From left to right: Janet Spintall, Denis Volkov, Kyla Drushka, Ben Hodges, Audry Hasson, Julian Schanze and Jim Edson.
Well, you can see where I am going with this: a tarball is also a blob of petroleum that has been weathered after floating in the ocean, sticky marine debris from the age of oil spills. With all due respect to the efforts of the dry team, commonality of the computing and oil tarball terminology becomes all too clear when one tries to reconcile the complex flows of data from both the tarball and the vast array of instruments on the ship. The tangle of seemingly conflicting information can make you feel like you are dealing with a tarball of the sticky black variety!
The tarball does focus our attention by feeding back to us our own observations. After R/V Revelle has deployed moorings, drifters, and floats we might receive back meteorological data from the central WHOI mooring, profiles from the NOAA moorings, trajectories of surface drifters, and profiles from the Argo floats. This real information may or may not conflict with what we imagined we would see (and built our plans around). So, this tarball pushes us into consideration of whether our plans going forward need revision or remain sound.
For example, the tarball is always an implicit invitation to re-consider the planned work to take account of current or forecast conditions. Ostensibly this information enables us to make the most of our valuable ship time. However, having a constantly evolving plan of action is rough on people and their routines. Plans tend to lose their certainty.
Of course, proposals are funded and years of work are banking on our executing a planned set of measurements. However, the decisions are difficult, if we planned to collect seven days of Surface Salinity Profiler data in rainy conditions and our planned operations turn out to be south of the actual rains for the previous two weeks, do we change our plans? Or, will Mother Nature bring rain to us in the coming weeks if we simply execute the plan with which we came to sea? The tarball gives us some weather projections, satellite rain rate and cloud maps, as well as current and salinity patterns in the ocean and model forecasts to help with the decision-making. Unfortunately what seems clear and useful to those at desks thousands of miles away, can be less than clear and ultimately confusing when working on an isolated patch of ocean far from regular observation. The effort to make good use and sense of the tarball is one of the additional challenges facing modern oceanography.
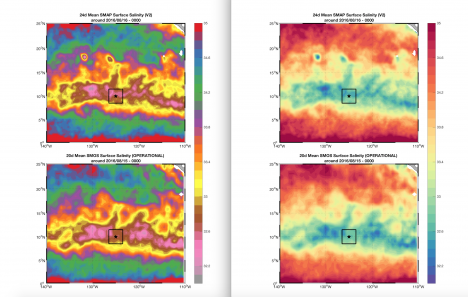
Two-panel plots of satellite salinity from the SMOS and SMAP missions. The only difference is the color scale; it is kind of a Rorschach test for oceanographers. Do you see fronts in one and not the other? Well, they are the same! What you see and interpret can be biased by how you present the information. That is another sticky mess in the tarball.
Before the tarball, seagoing oceangraphy was simpler (and more dangerous) and plans were simply to be executed. With the tarball, science is safer and more nimble and plans are malleable. I think that for us, older humans, the modern way with the tarball is more stressful. Or maybe, if you came of age with the Internet, life without the tarball is unimaginably silly and stupid. For a young oceanographer the science IS the sticky mess inside the tarball!
Whatever the reality, our information age has made a day at sea a challenge in environmental analysis. No more hoping, imagining, or guessing – it is all in the tarball if only you can figure it out!
By Eric Lindstrom
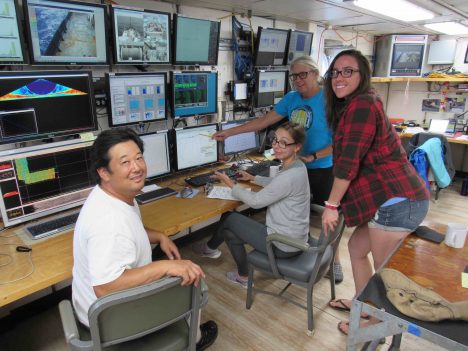
The CTD team (Spencer, Leah, Janet, and Kristin).
The focus of SPURS-2 is the upper ocean and the fate of rainwater. However, in order to study the top of the ocean one needs to know what is going on deeper down. The beauty of SPURS-2 is not skin-deep! SPURS-2, like many prior physical oceanography experiments, requires a basic background and context of the ocean circulation environment upon which many of our other more specialized or detailed measurements can be interpreted. The two major pieces of the contextual information for us are the surface circulation and the surface salinity pattern.
The surface salinity pattern is provided by remote sensing for the largest scale and by the array of drifters and profiling floats that have been deployed with salinity sensors. Also, the R/V Revelle is collecting a treasure trove of upper ocean salinity measurements wherever she goes – with continuous underway measurements of salinity from intakes at the surface, 2 meters (6.5 feet), 3 meters (9.8 feet), and 5 meters (16.4 feet) depths. I’ll go into that in more detail in a later blog on the Surface Salinity Profiler.
The surface circulation of the ocean is largely the result of the wind and the shape of the massive deep layers below the surface. In fact it can be crudely estimated if one knows the precise shape of the thermocline – the boundary between the warm upper ocean and the vast deep cold ocean. Here in the tropics the thermocline is pretty well represented by the 20°C (68° F) isotherm. Think of the warm upper ocean as all the water warmer than 20°C and the layer below as all the water colder than 20°C. Tropical oceanographers can use the depth of the 20°C isotherm much like meteorologists use surface atmospheric pressure maps to chart the highs and lows of weather and their associated winds. Here, if the 20°C isotherm rises toward the surface locally it is associated with a counterclockwise ocean surface current. The signature of the westward North Equatorial Current is a gentle slope of the isotherm from deeper in the north to shallower in the south. This is where our Conductivity-Temperature-Depth (CTD) instrument comes into the SPURS-2 plan. We can use it to track the shape of the thermocline. I wrote about the CTD during the SPURS-1 campaign. It is still the workhorse of physical oceanography – or maybe the monkey on the back of every physical oceanographer! Our show seldom goes on without it.
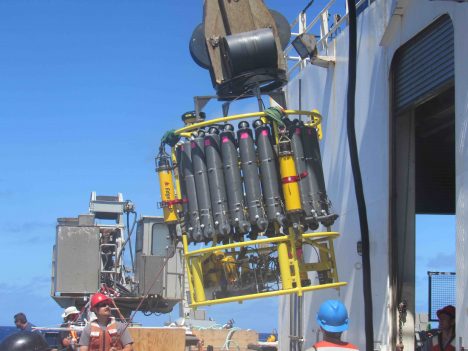
Preparing the CTD to go over the side.
Janet Sprintall from Scripps Institution of Oceanography and her team (Spencer Kawamoto, Leah Trafford, and Kristin Fitzmorris) are now mapping the temperature and salinity structure of the ocean well into the deep cold abyss (to 1.5 kilometers –0.93 miles– below the surface). The ocean depth is about 4.5 kilometers (2.8 miles) and the lower 3 kilometers (1.86 miles) are (for our purposes) relatively uniform and cold. Janet has planned a grid of 49 stations 30 miles apart around the SPURS-2 central mooring. These will be completed over about a week’s time. Simultaneously there will be regular sampling with the Surface Salinity Profiler between some of the CTD stations and we will optimize our meteorological measurements by limiting our speed to 10 knots (11.5 mph). So, while studies of the meteorology and near surface salinity are ongoing, as we move about the ocean, Revelle stops for an hour every 30 miles to collect necessary information on the background oceanographic conditions.
The CTD instrumentation remains largely unchanged (although perfected) in recent decades. Temperature, salinity, and oxygen sensors are mounted on the bottom of a large frame. Water sample bottles are mounted around the outside of the frame. Other instruments, such at the acoustic Doppler current profiler, may also be mounted on the frame. All data is transmitted up the conducting wire cable that is used to raise and lower the instrument. This bulky package is now easier to deploy and recover than in yesteryear due to innovations on today’s vessels. Now the Revelle has a specialized mechanical arm to get the CTD over the side and back on deck safely without much human intervention.
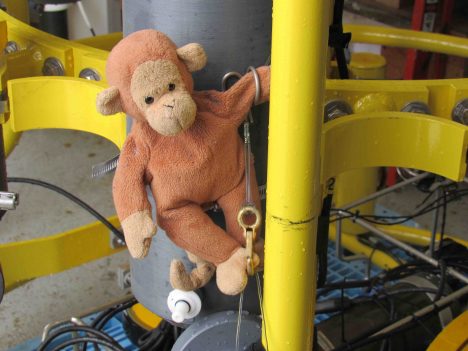
Monkey climbing over the water sample bottles on the CTD.
For my entire career oceanography has been spelled “CTD.” Knowing the temperature and salinity structure from surface to ocean depths is the key to our understanding of the ocean’s role in climate. The first global mapping of these characteristics (with CTDs) was not realized until the World Ocean Circulation Experiment in the 1990’s. Now oceanographers are working hard to understand all the physical, chemical, and biological changes associated with global warming, rising carbon dioxide levels, and industrial fishing. In that big picture, SPURS-2 might look like a small bit of monkey business over the tropical thermocline. However, we know that the resulting scientific understanding will long outlive the memory of our tiny field program in this vast Pacific Ocean!
