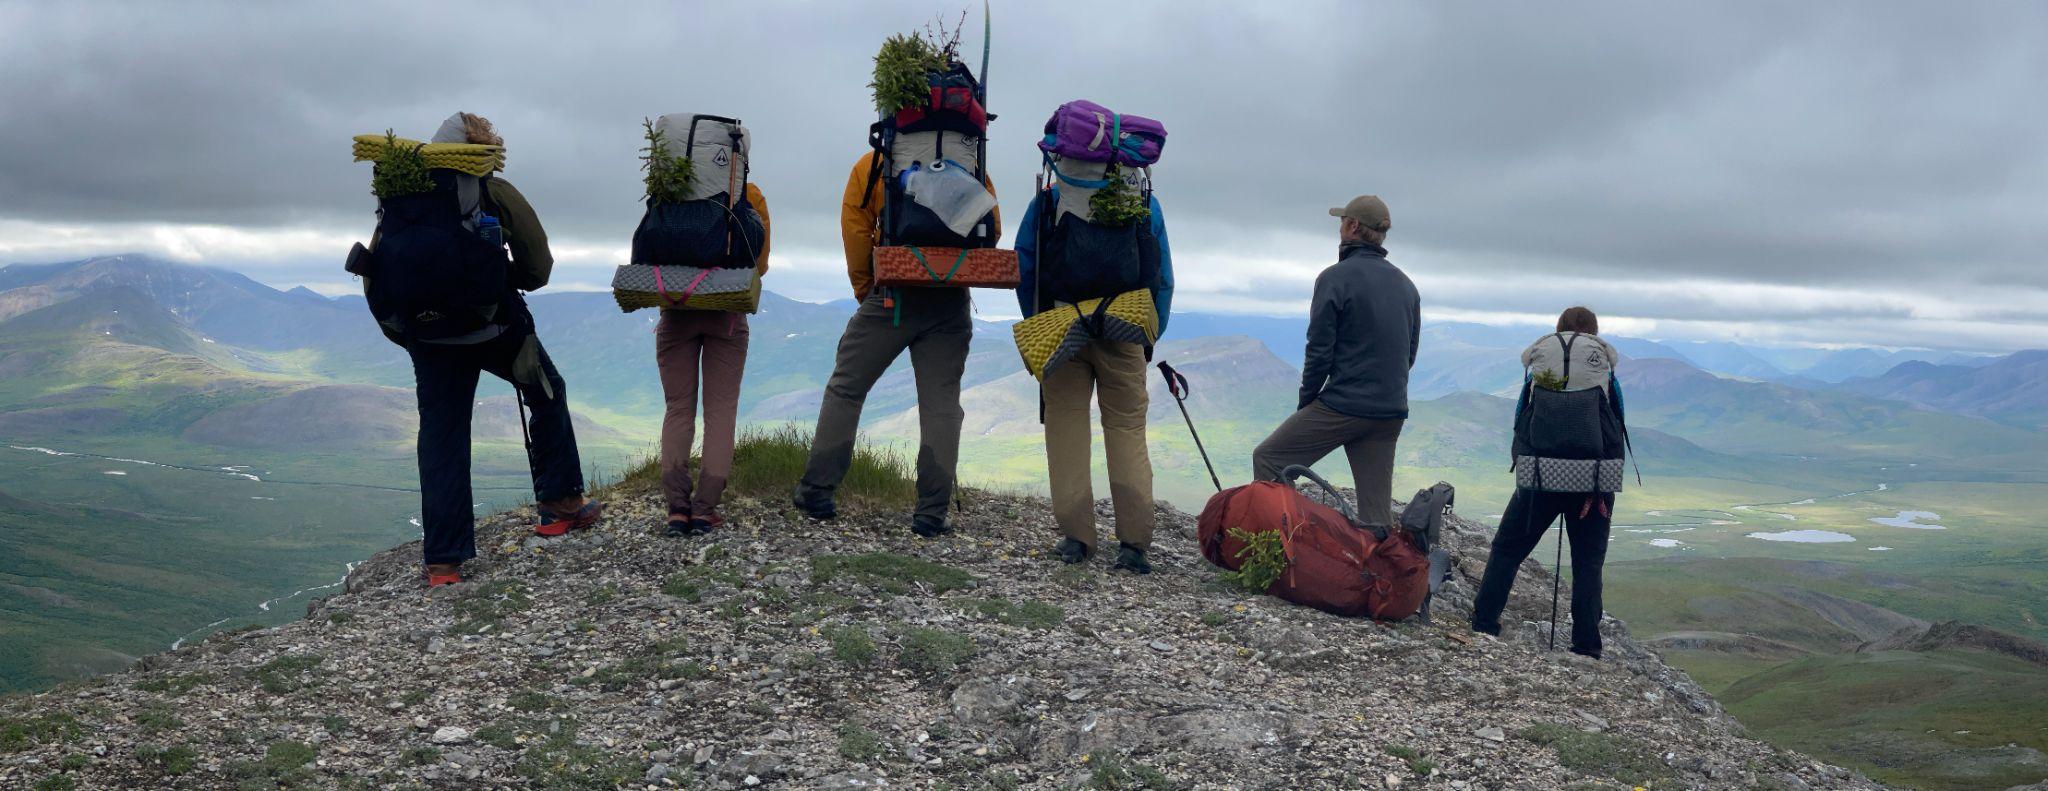
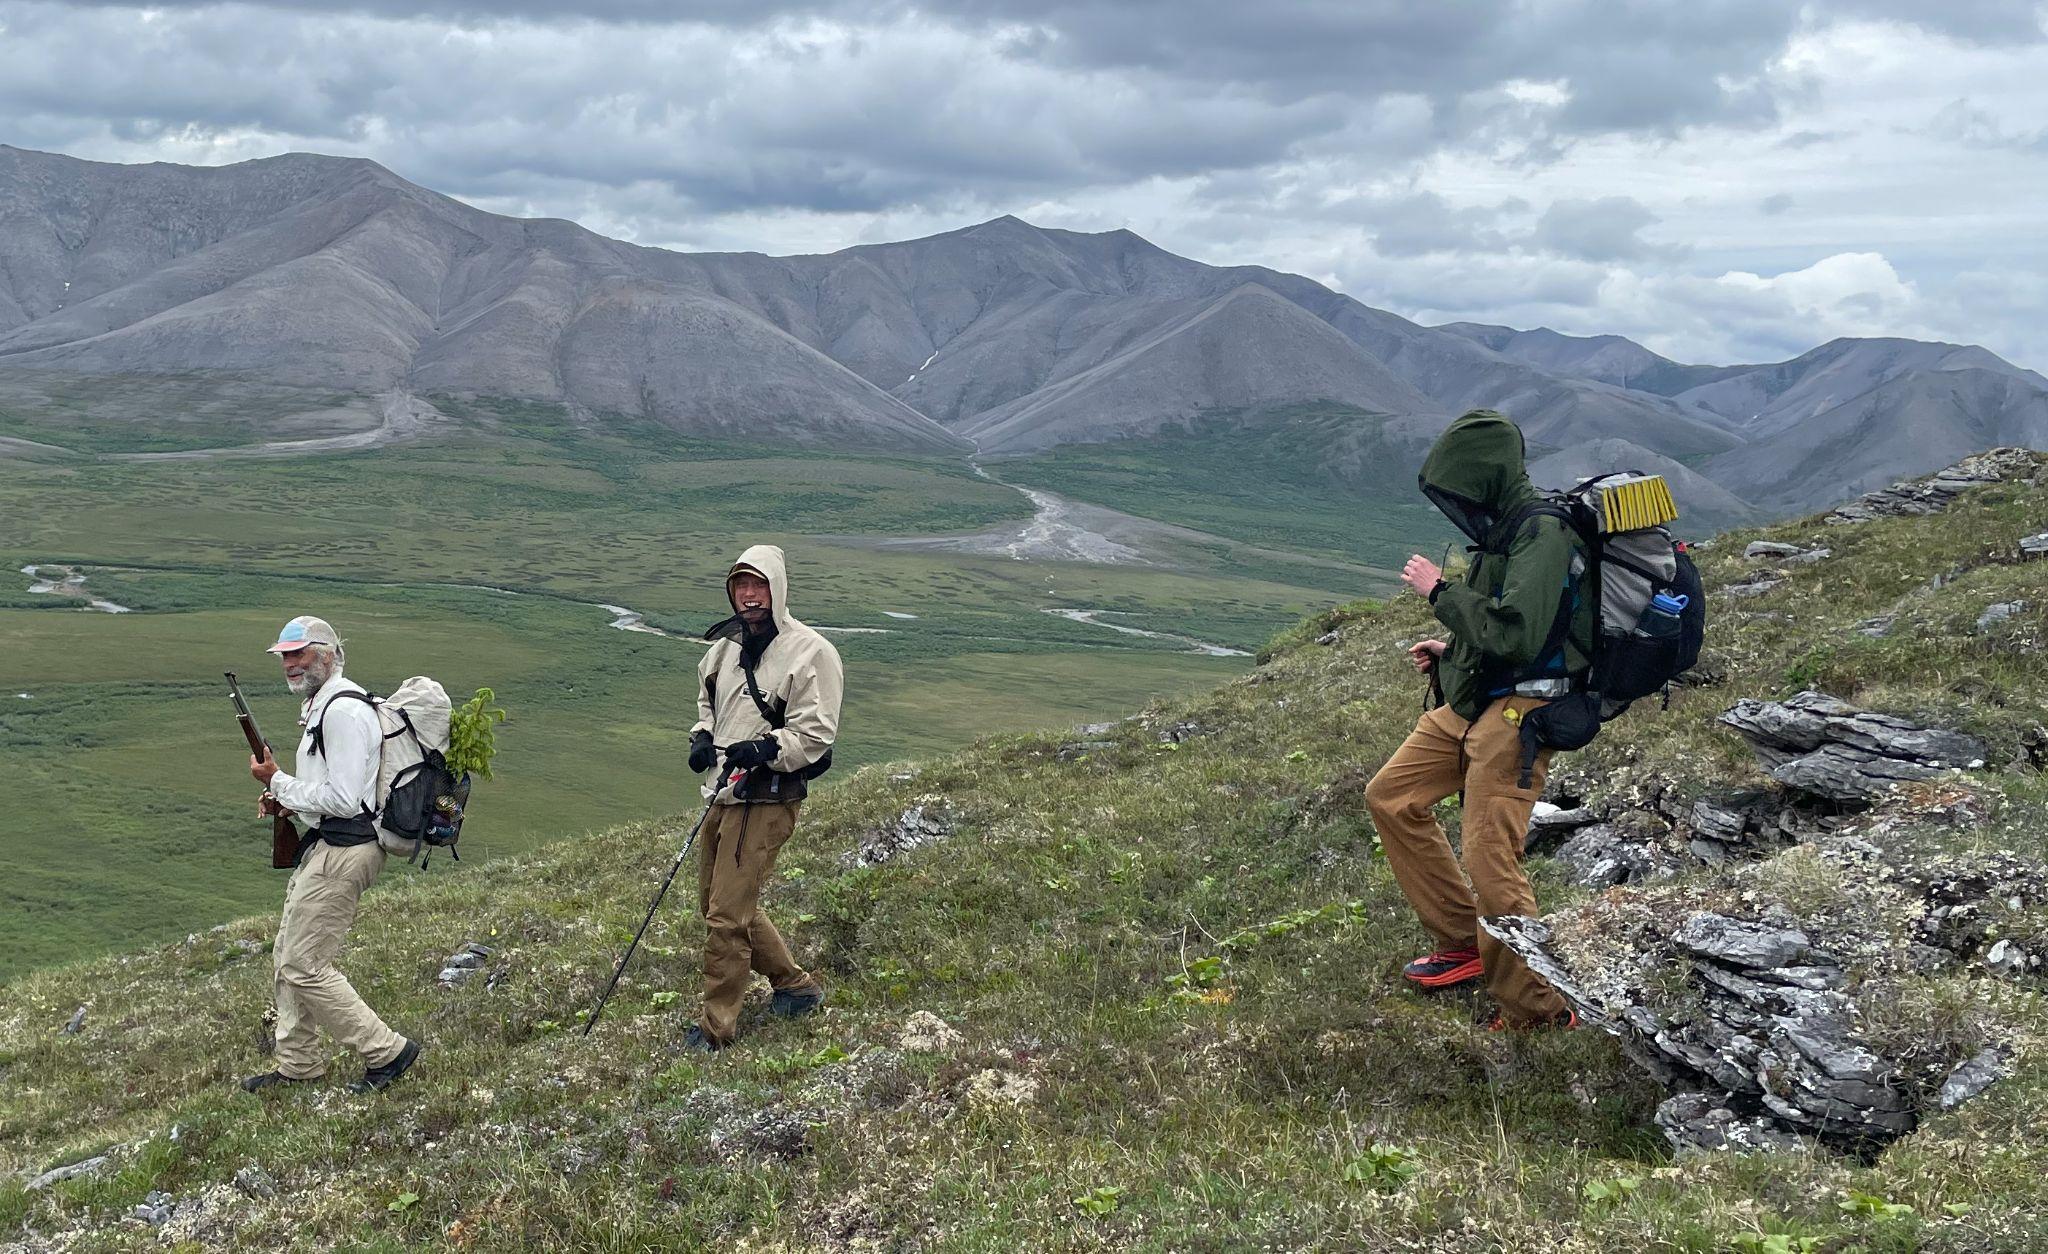
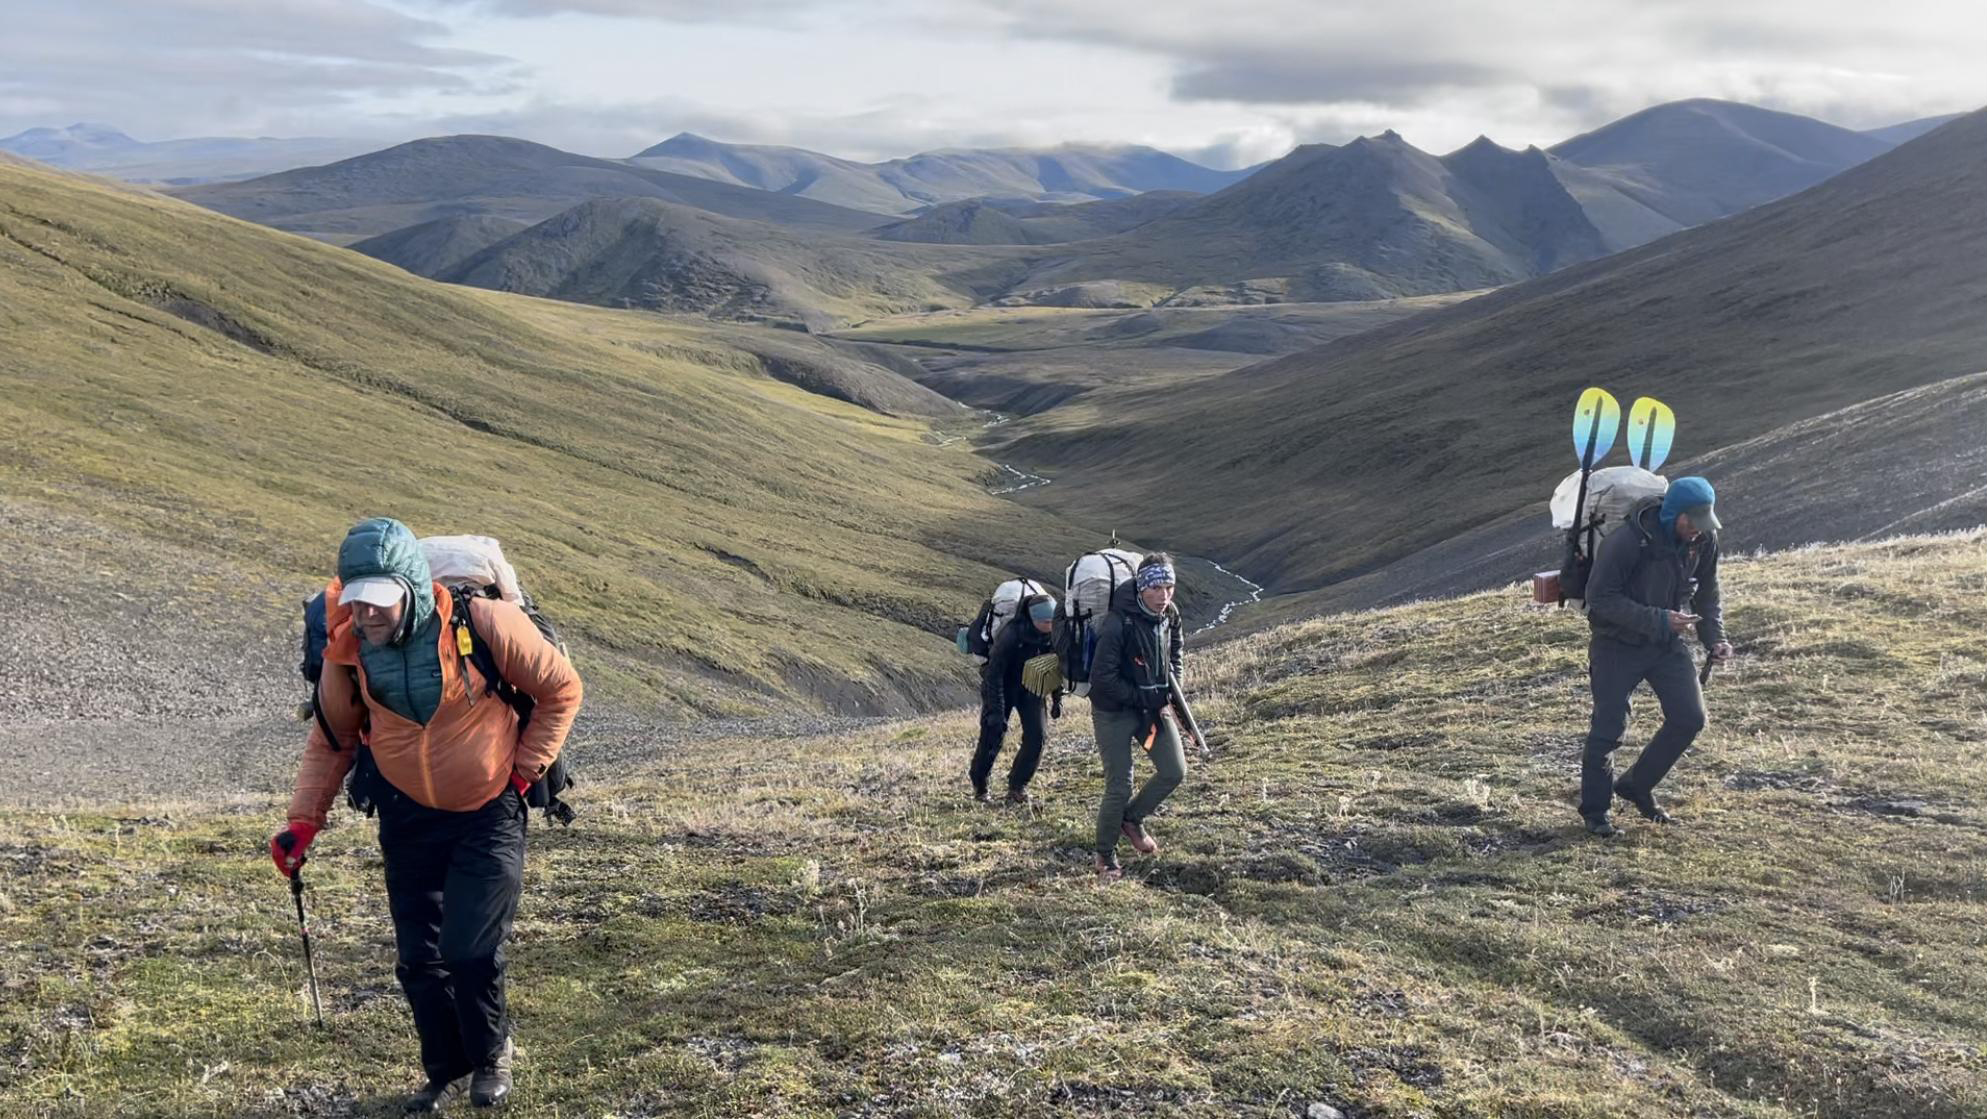
Following caribou and brown bear trails when possible, a small NASA-supported research team trekked 800 miles across Alaska’s Brooks Range last summer. With additional support from NSF, the Alaska Space Grant Program, and the Explorers Club/Discover, the research team is collecting extensive ecological field data that will be linked with satellite observations to better understand long-term changes in vegetation, including impacts of climate warming. The Arctic is warming nearly twice as rapidly as the rest of the planet and the impacts are becoming increasingly evident as glaciers melt, permafrost thaws, and tundra greens.
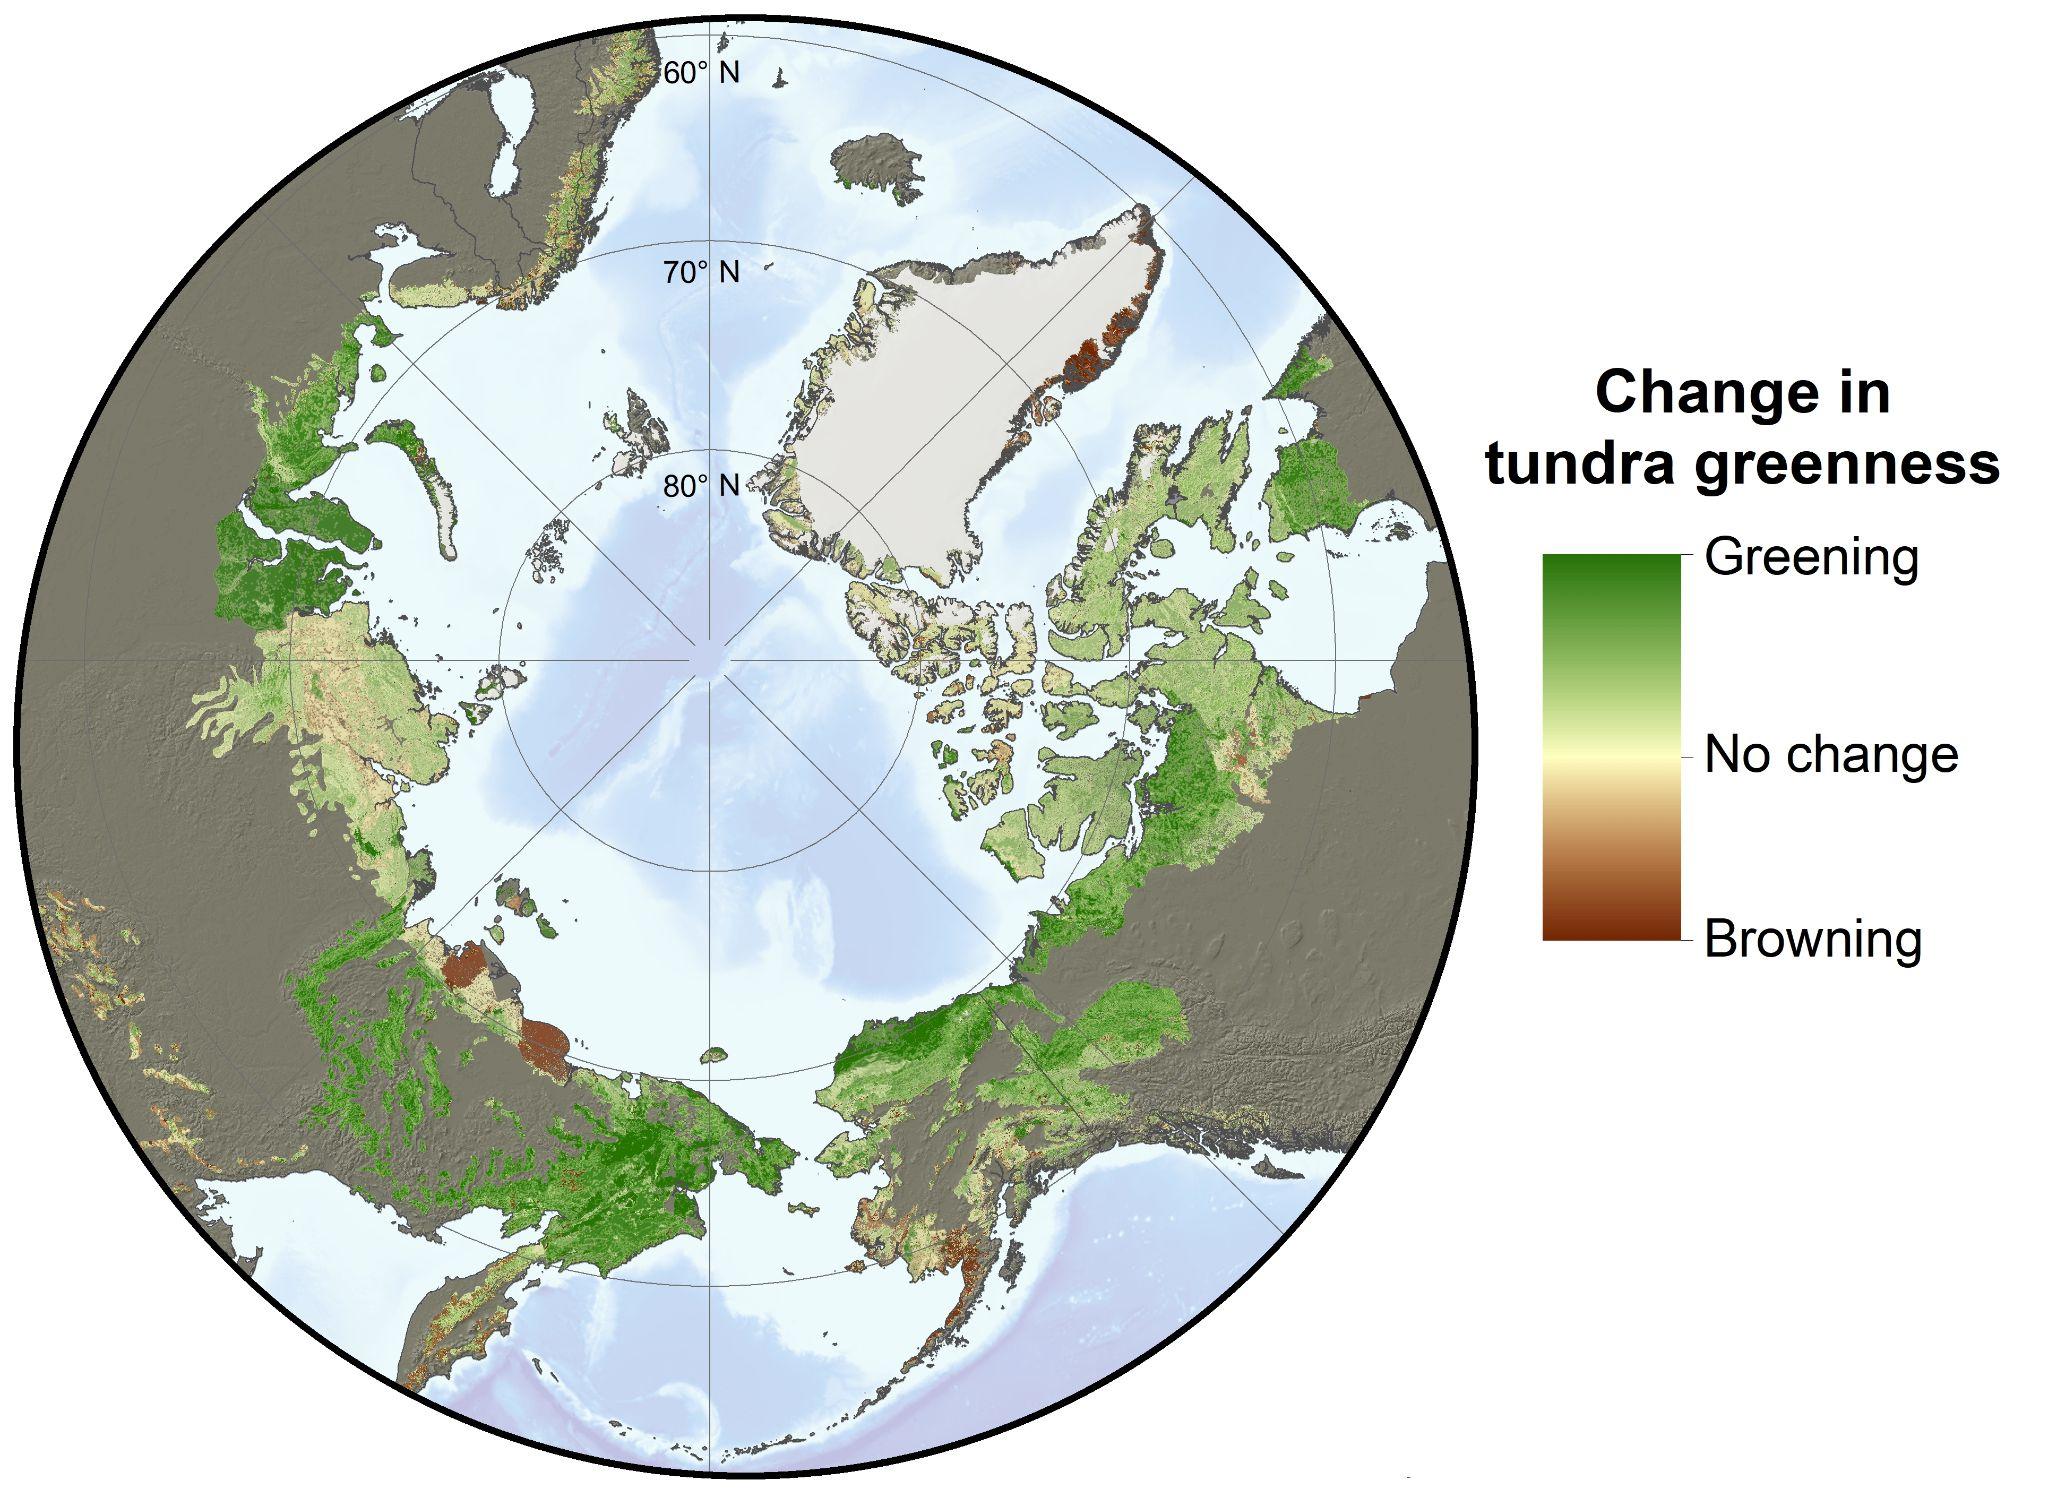
Earth-observing satellites have detected widespread increases in tundra greenness in the Arctic over the last four decades. The phenomena is caused, in part, by increases in vegetation growth as summers have become warmer and longer, and has been termed “Arctic greening.” On the other hand, satellite observations have also detected localized declines in tundra greenness attributed to surface flooding, extreme weather, and other disturbances. This has been termed “Arctic browning.” Satellite observations of greening and browning show that extensive changes are occurring in the Arctic, but much remains unclear about why specific regions have greened or browned in recent decades.
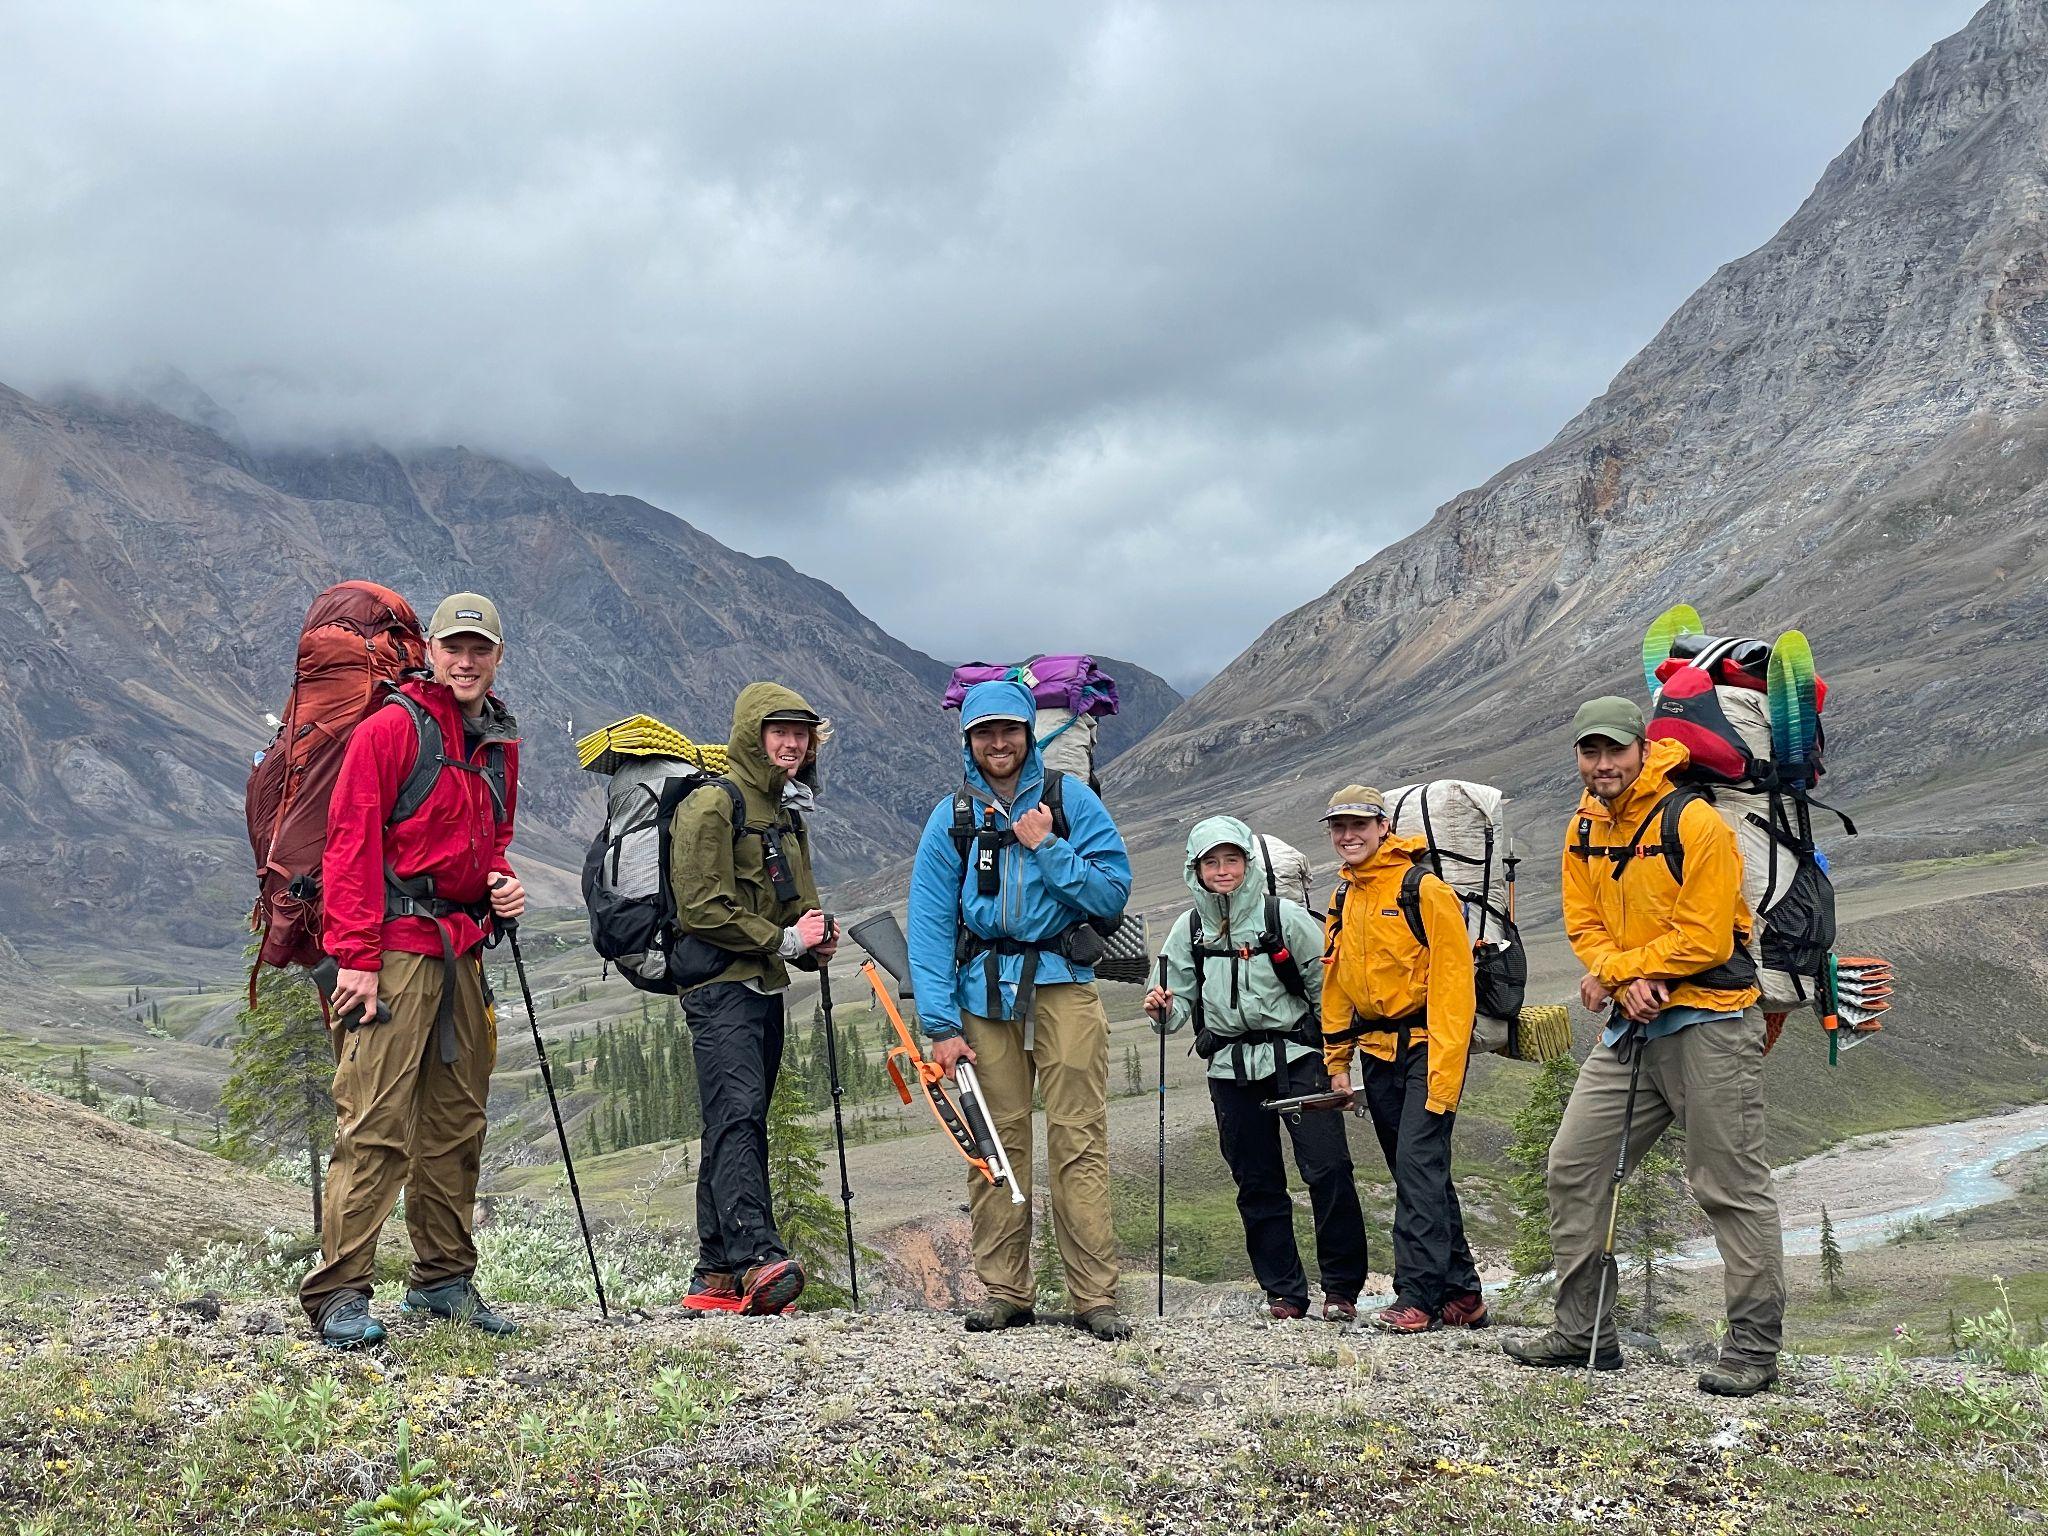
To better understand recent greening and browning in northern Alaska, Professor Roman Dial’s team from Alaska Pacific University (APU) has been collecting extensive ecological observations while trekking throughout Alaska’s Brooks Range. For nearly forty years, Dial has studied and traversed the Alaskan wilderness, including nearly 2,000 miles by foot and packraft throughout the Brooks Range during the last three field seasons. For 11 days last summer, Dial’s team was joined by Dr. Logan Berner and Patrick Burns who are research ecologists from Northern Arizona University (NAU) and members of NASA’s Arctic-Boreal Vulnerability Experiment (ABoVE). While Dial is an expert in field ecology and wilderness travel, Berner and Burns are experts in satellite remote sensing and ecological informatics. By combining their expertise, these researchers hope to shed light on the extent, nature, and causes of vegetation changes during recent decades in the Brooks Range.
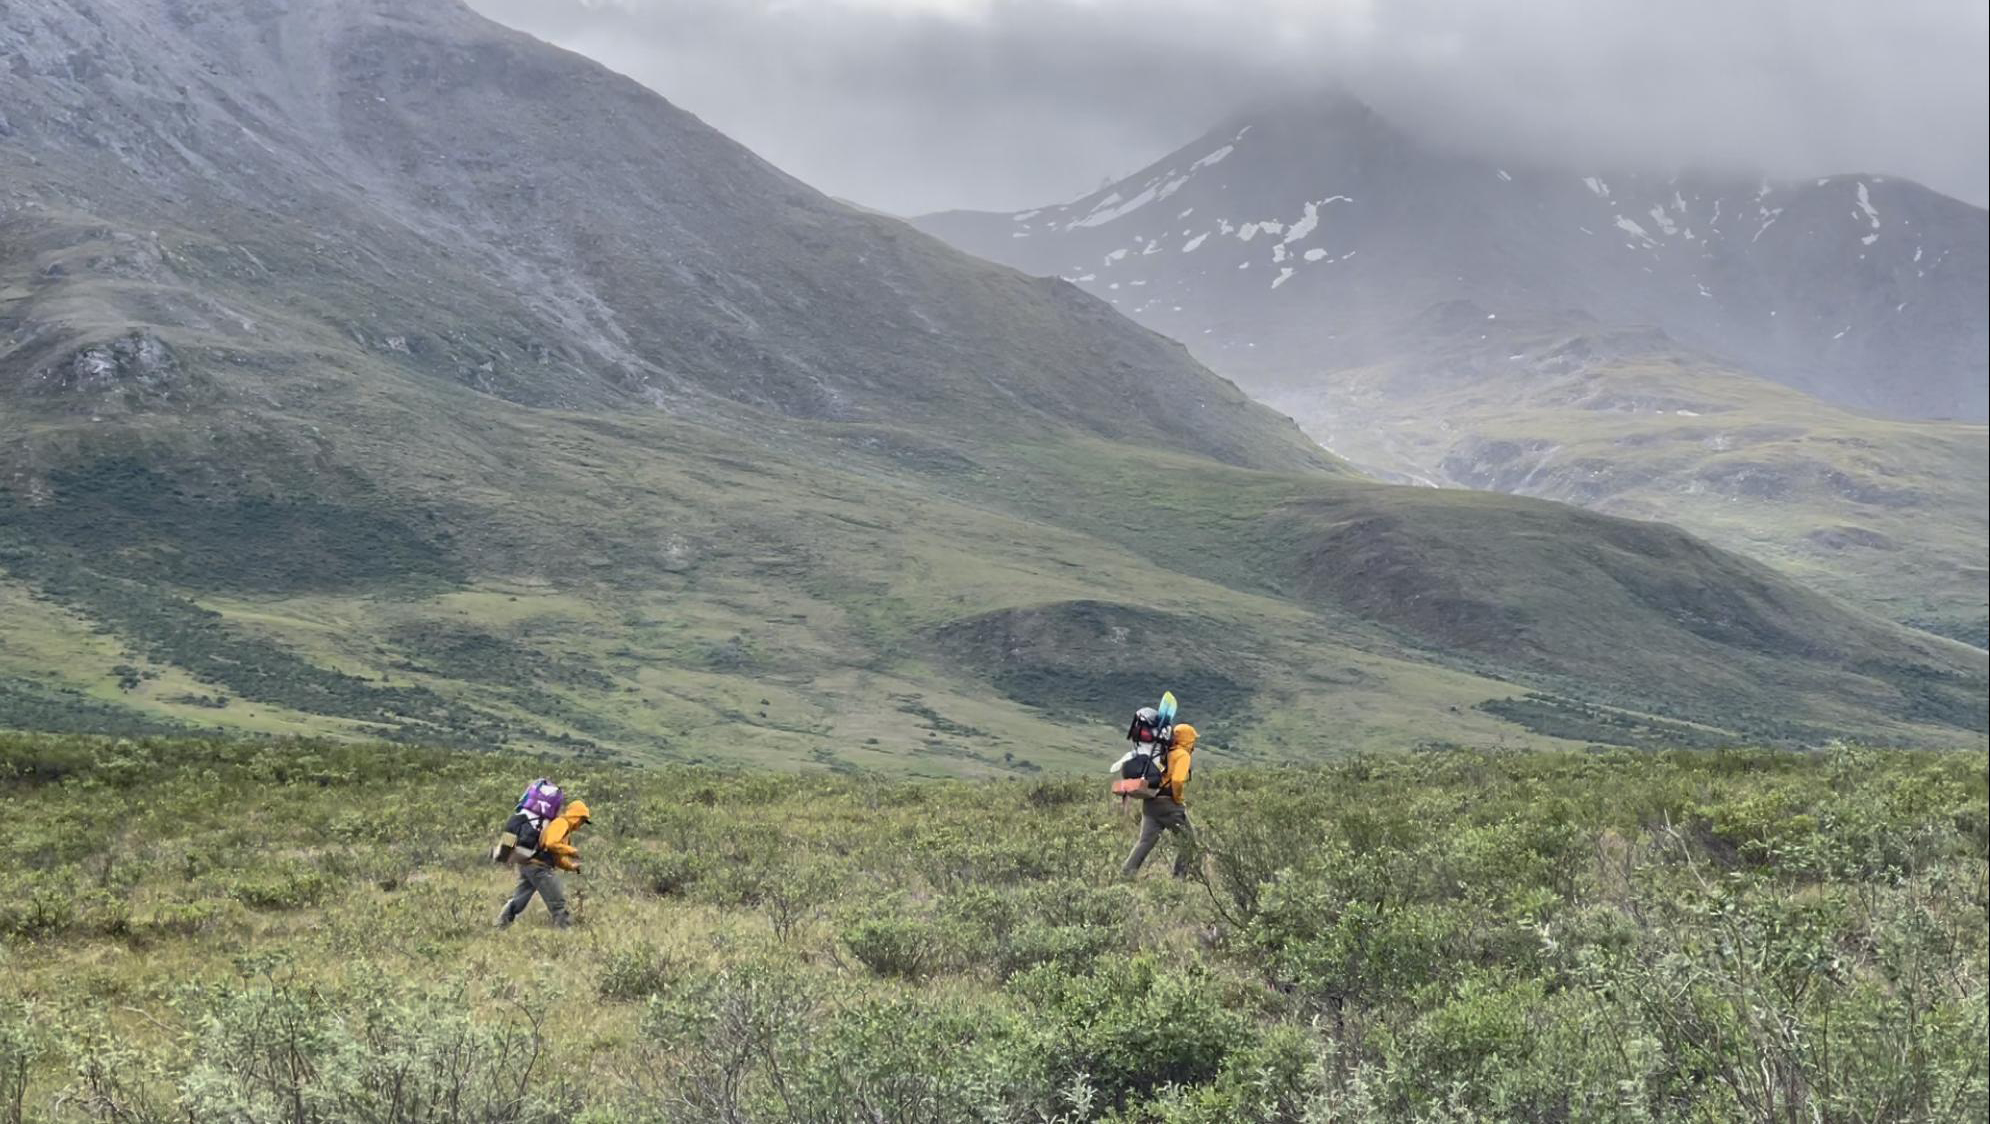
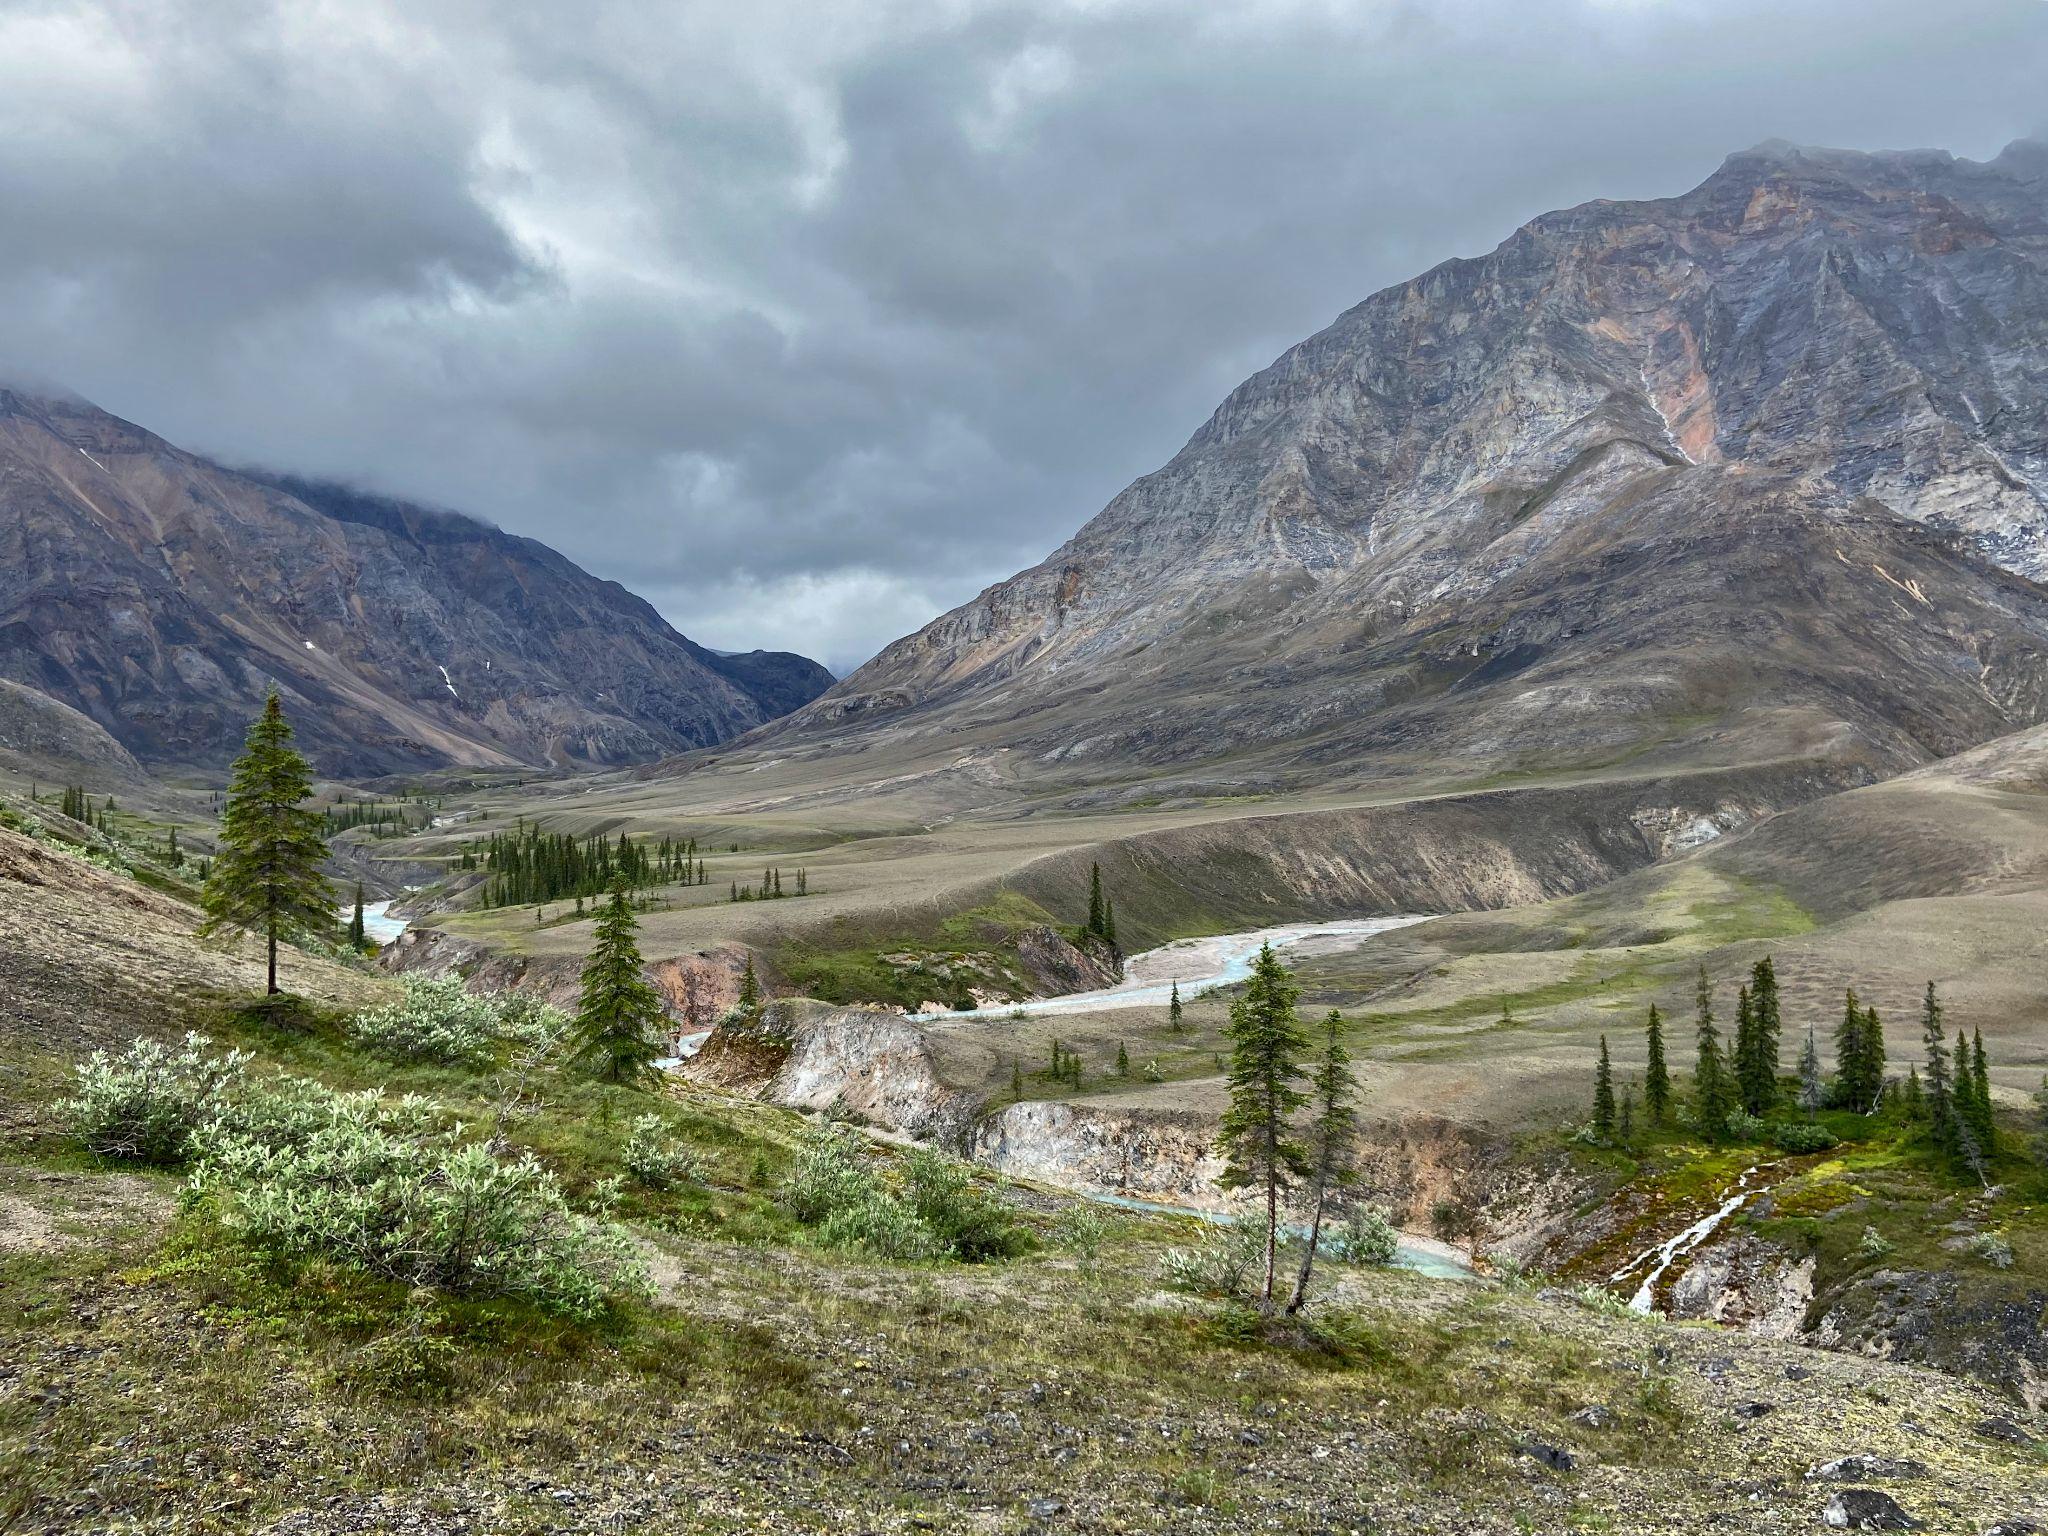
The Brooks Range forms a natural barrier that separates the boreal forest of Alaska’s interior from the arctic tundra of Alaska’s North Slope. This mountain range includes the largest complex of protected wilderness in the United States, including 21,000,000 acres among the Arctic National Wildlife Refuge, Noatak National Preserve, and Gates of the Arctic National Park. Berner and Burns joined Dial’s research team as they trekked from the northern edge of boreal forest into the Noatak Wilderness where trees give way to thickets of shrubs, wetlands, and barren rocky ridges. During the course of 11 rain-soaked days, the team followed caribou and brown bear trails through verdant valley bottoms and over cloud-choked mountain passes as they traversed about 80 miles from the Ambler River to the Cutler River. While trekking, the researchers collected ecological field data to be linked with measurements of vegetation greenness from NASA Earth-observing satellites.
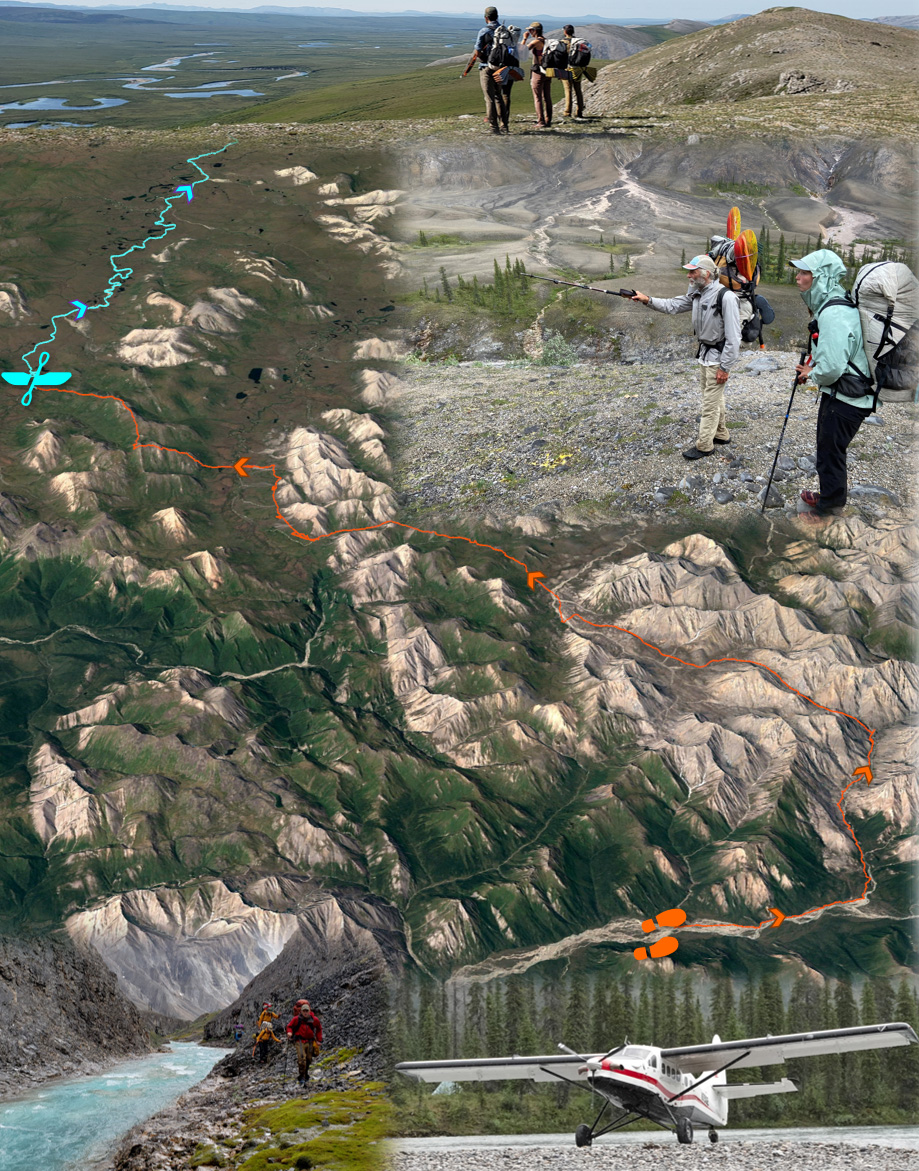
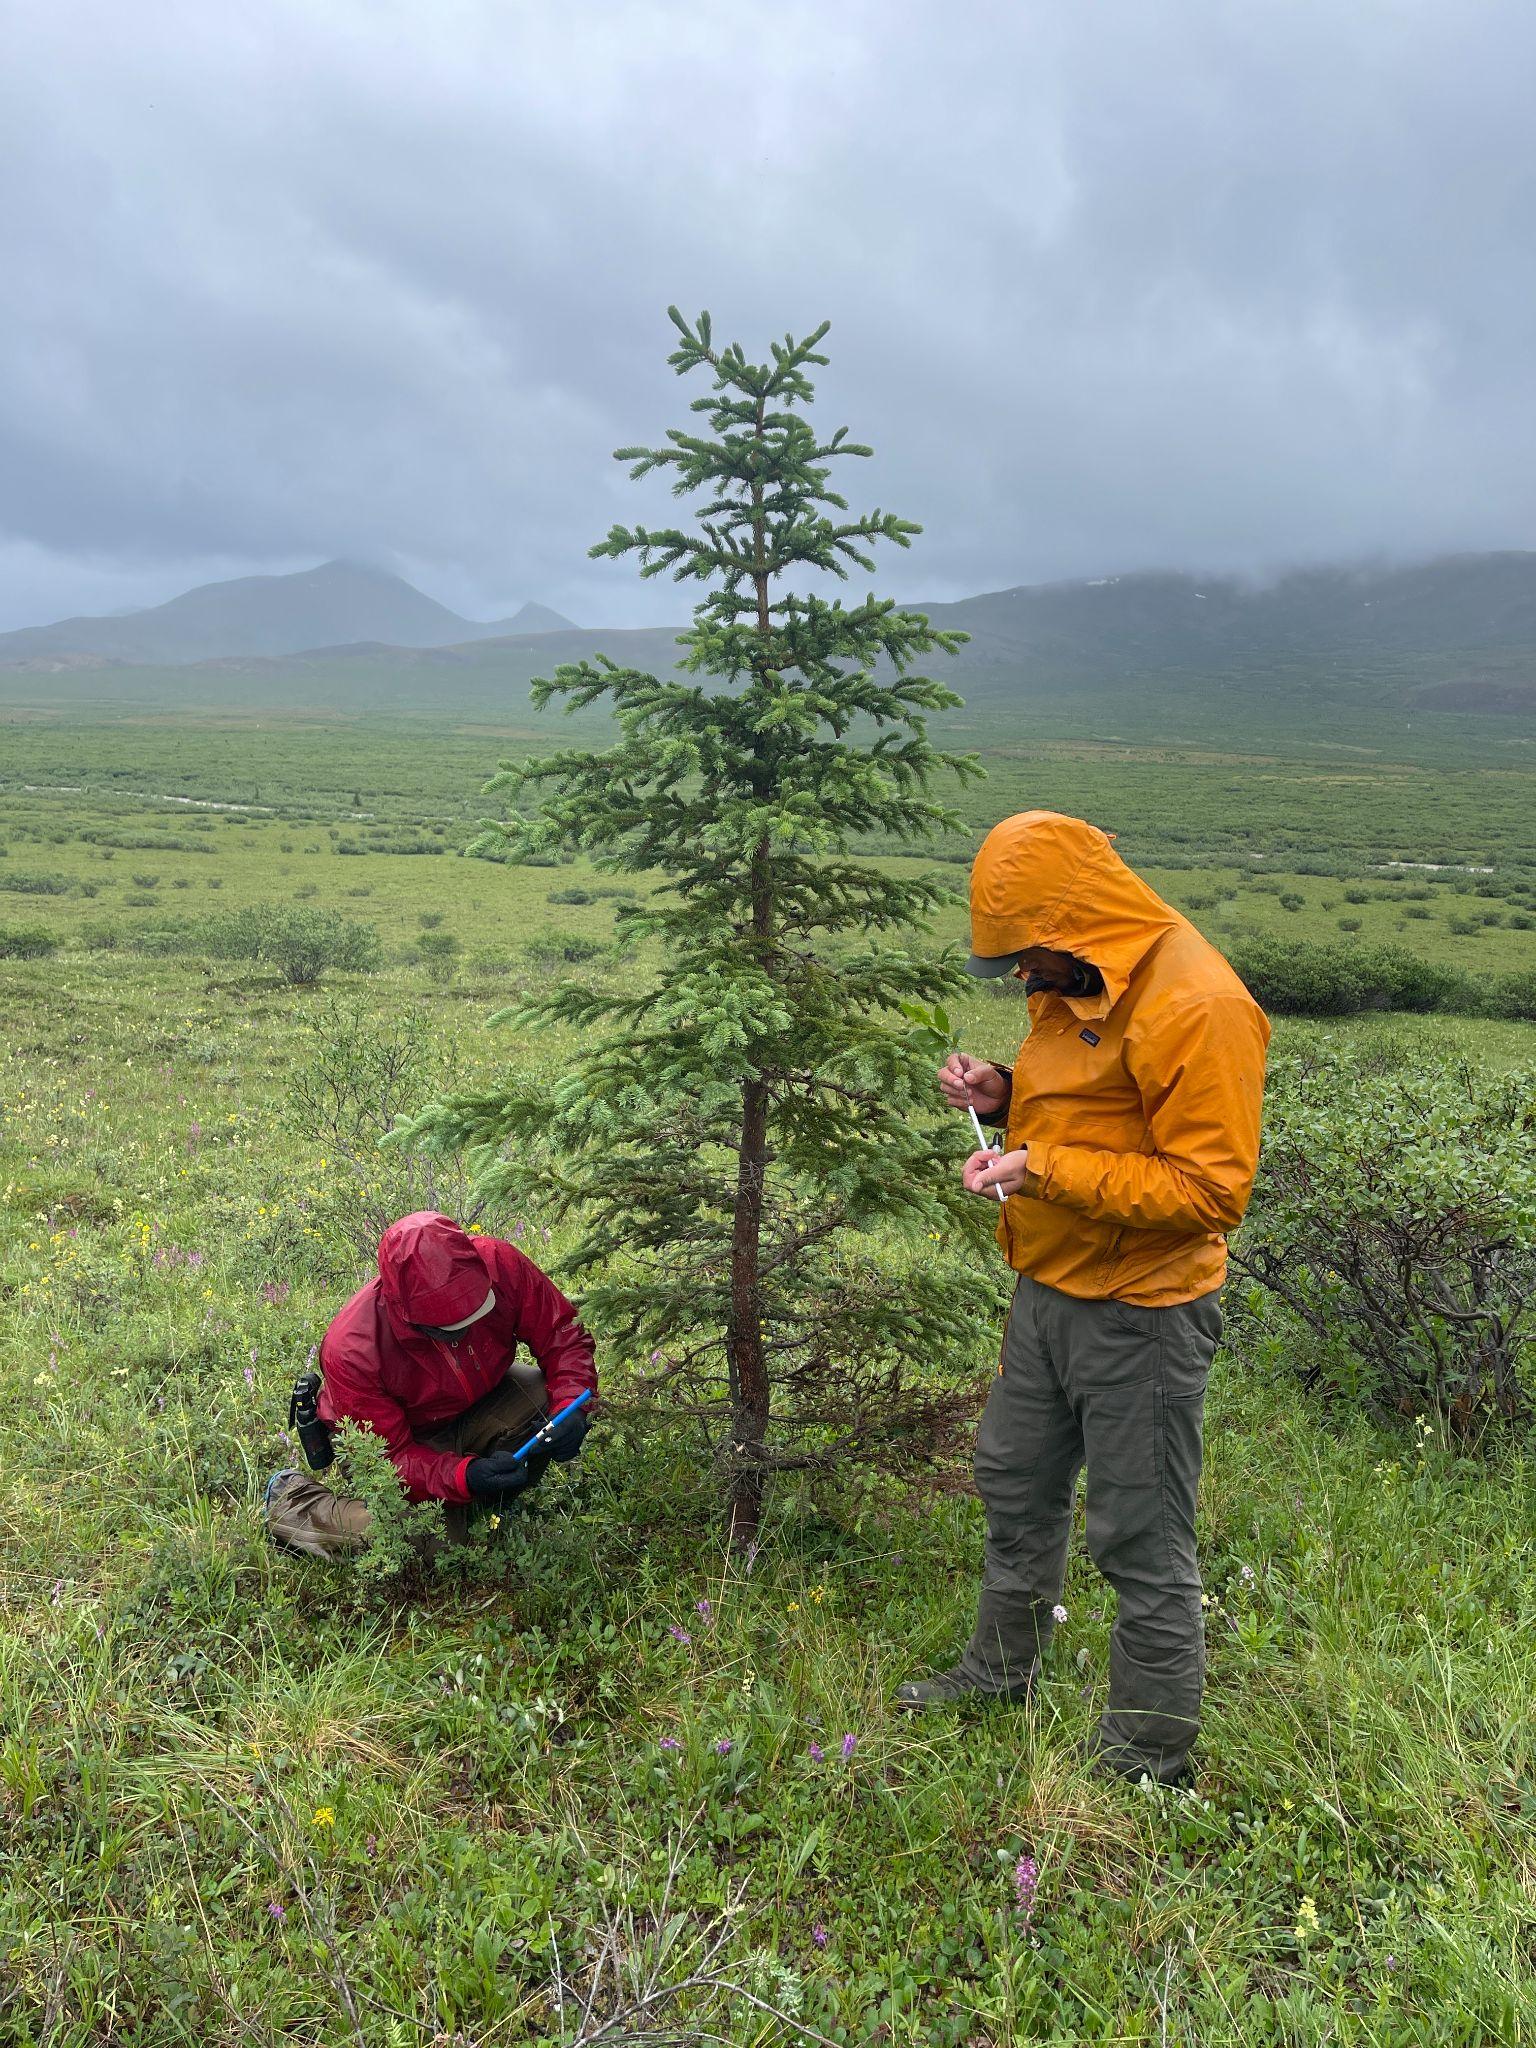
Ecological research often involves establishing field plots and then meticulously characterizing the composition and other attributes of the plant community in each field plot. Plot sampling provides valuable information, but the time consuming nature of the approach limits the spatial extent over which measurements can be made. Dial recognized that to better understand recent greening and browning, there is a need for more spatially extensive information on plant community composition than can be provided by field plots alone. He thus has pioneered an alternative approach that involves continuously documenting plant community composition and other attributes while trekking across the landscape. Termed “pixel-walking”, this approach harnesses the multifunctionality of smartphones to record and geolocate visual observations of vegetation composition and density for the overstory, midstory, and understory. While pixel-walking, researchers record a new observation every time they visually detect a change in vegetation composition or density at about a 30 meter spatial scale, corresponding to one pixel from the Landsat satellites. These spatially extensive field observations are thus collected with the explicit goal of being linked to decades of Landsat satellite observations.
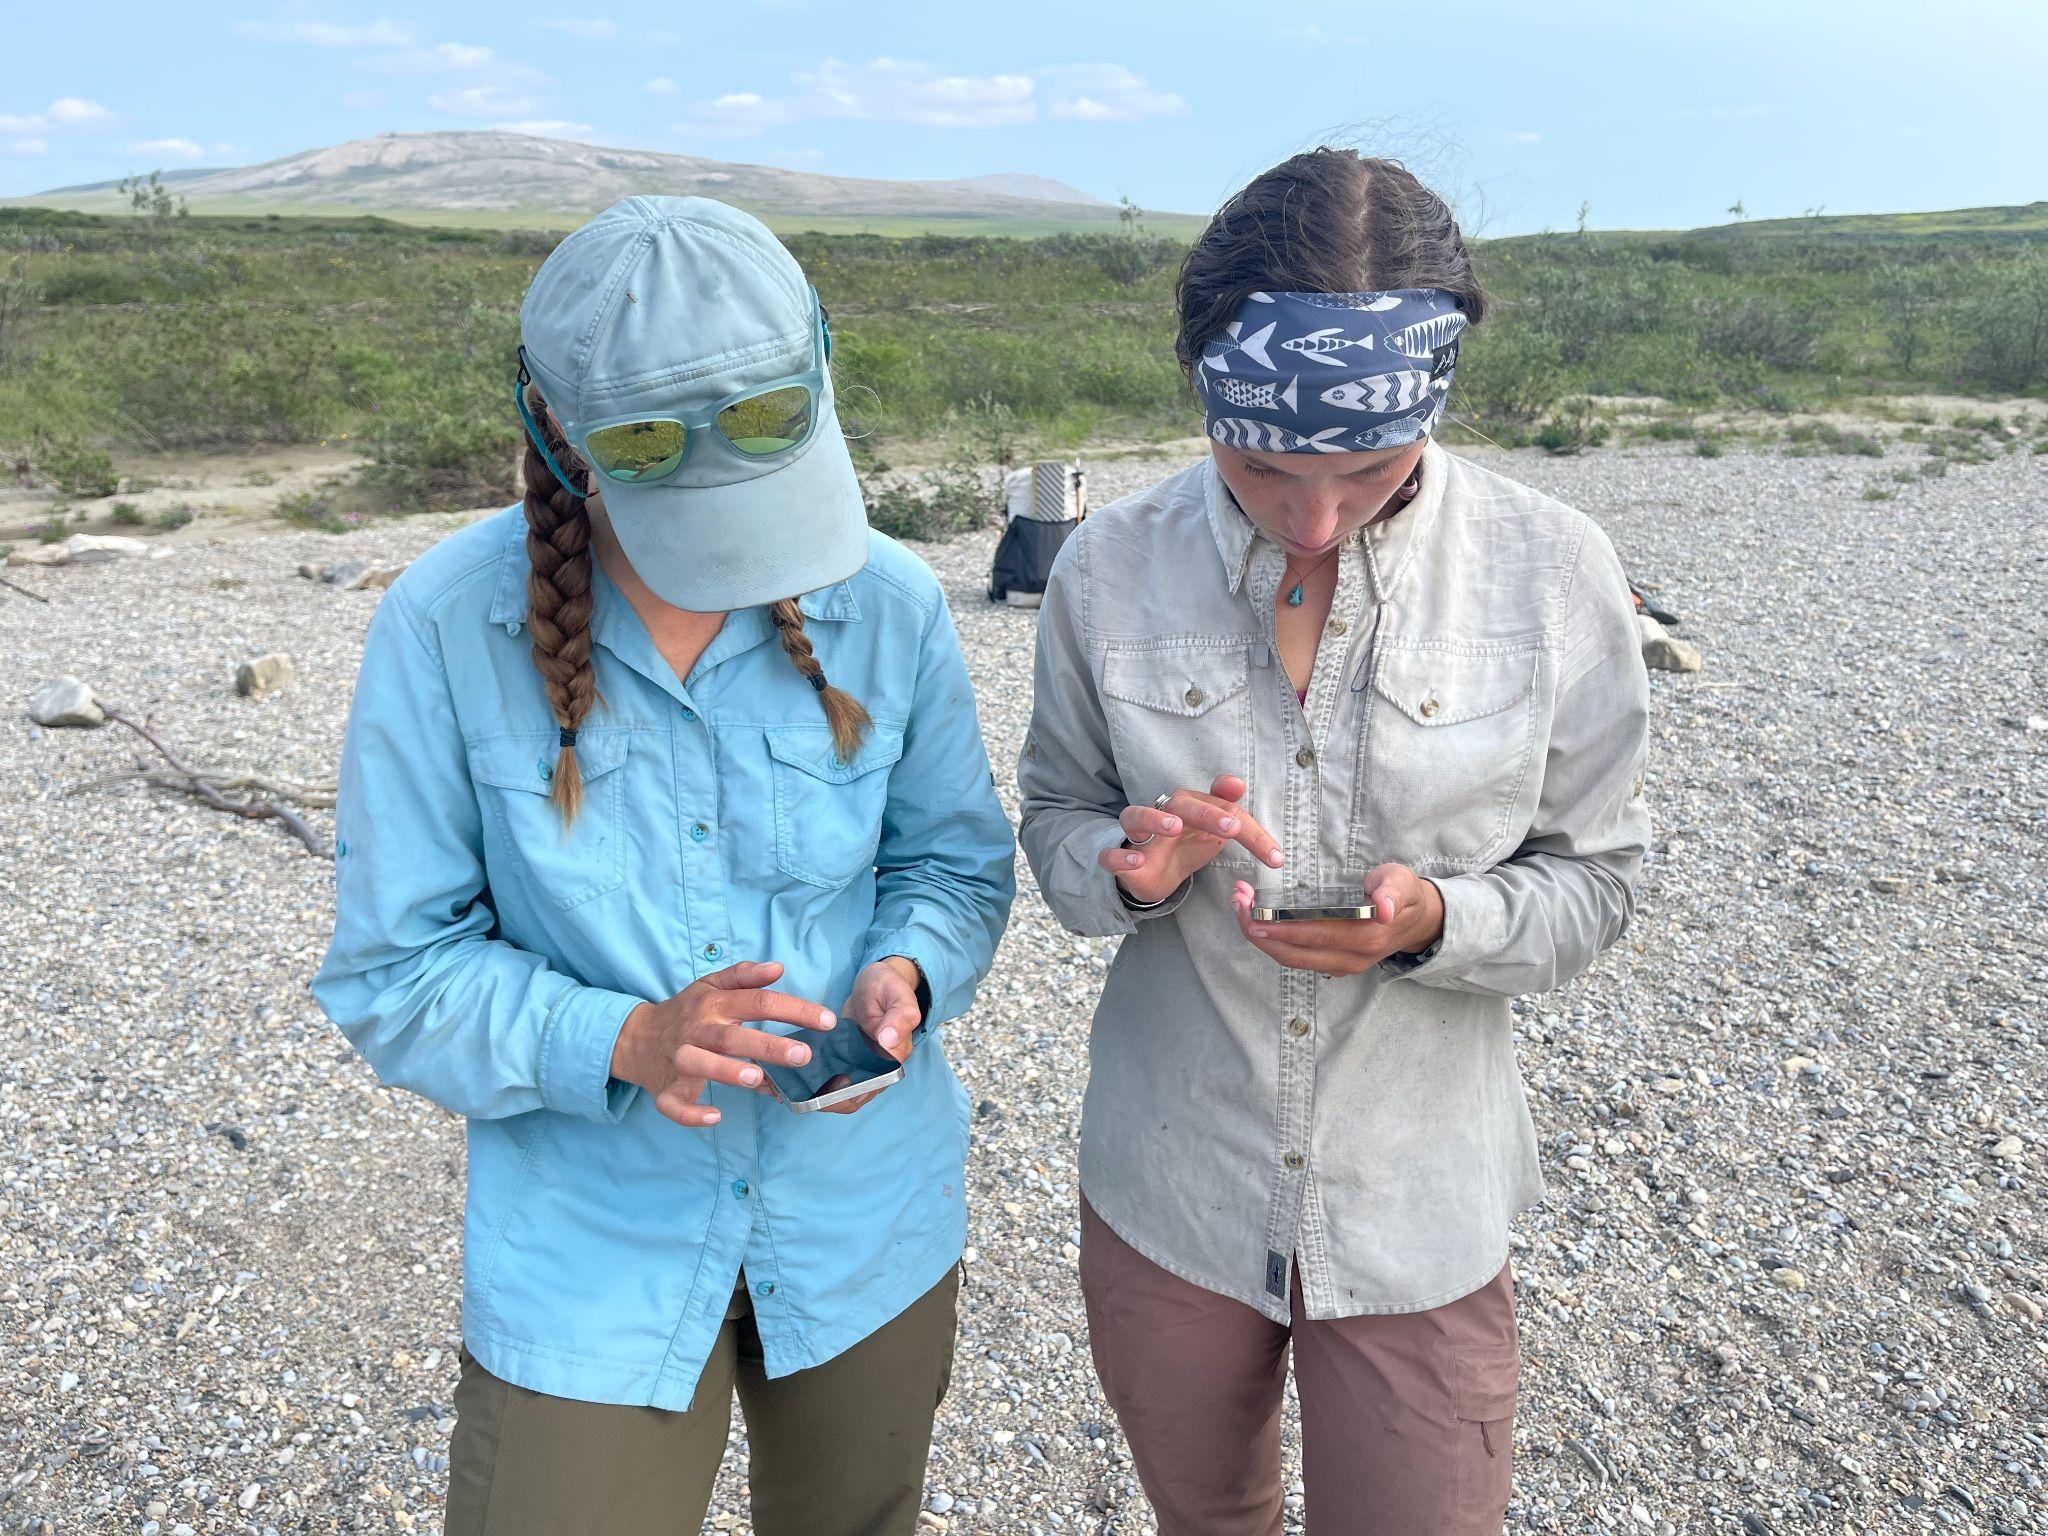
During summer 2021, Dial’s research team pixel-walked over 800 miles from east to west through the Brooks Range, collecting data on vegetation composition for about 100,000 Landsat pixels. Over the coming year, Dial’s team will work with Berner, Burns, and Professor Scott Goetz (ABoVE Science Team Lead) at NAU to link these extensive field data with several decades of Landsat satellite observations provided by NASA. This collaboration will help unravel the mysteries of Arctic greening and browning by shedding light on where, how, and why plant communities changed in recent decades. NASA’s Earth-observing satellites provide long-term observations that are crucial for monitoring and understanding ongoing environmental changes in the rapidly-warming Arctic, especially when complemented by field data collected across large regions.
“Landsat 9 provides a critical extension of the Landsat data record for monitoring our food supplies and helping to inform and address crucial decisions in how we manage, grow and adapt our food production sustainably under a warming climate, with an increasing population and growing demand for food.”
– Chris Justice, NASA Harvest Chief Scientist, Program Scientist for NASA’s Land Cover Land Use Change (LCLUC) Program, Land Discipline Leader for the NASA Moderate Imaging Spectroradiometer (MODIS) and the Soumi-NPP VIIRS Science Team, co-chair of the GEOGLAM Initiative.
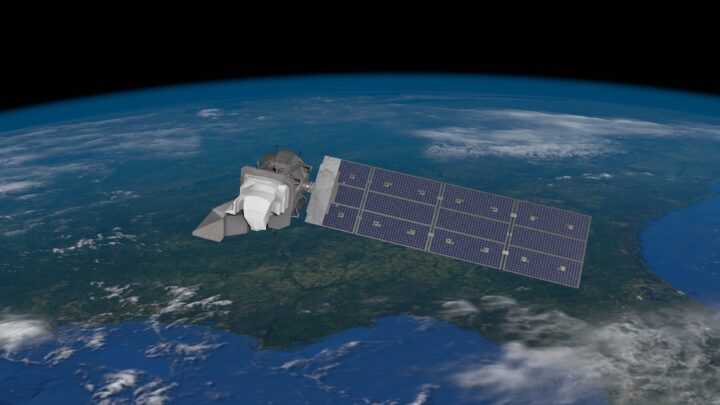
The next generation of Earth observation satellites is scheduled to launch in just a few short days. The ninth sensor in the NASA/USGS Landsat program will continue the mission’s critical work in monitoring how the surface of the Earth has changed in the near-50 years since the first Landsat satellite was launched. Landsat has enabled a number of applications in diverse fields including forest management, fire, and climate. The system has also found extensive use in monitoring global agriculture and food security applications.
Landsat revolutionized what it means to monitor agriculture, analyze crop conditions and estimate crop yields. Provided by advancements in satellite imagery and technology, the ability to remotely monitor crops over large areas and in difficult to access places on a regular basis has lowered on-the-ground labor requirements while simultaneously increasing the amount of analysis that can be performed. Advancements in spatial and temporal resolution, or how “zoomed in” and frequently the imagery is obtained, combined with new computing capabilities have created a variety of novel applications that have completely shifted what is possible in terms of agricultural monitoring and research.
NASA’s Role in Agriculture and Food Security
The first Landsat mission launched in 1972 was designed with agricultural monitoring as a key application for the Earth observations data that would be provided by satellite imagery. These initial Landsat observations were the primary tool for developing early programs for agricultural monitoring which laid the foundation for using satellite data to monitor where and when crops are growing, to observe crop condition as the growing season progresses, and to estimate crop yields and total production from space. As advances in technology and computing capabilities have increased exponentially in the last several decades, NASA has continued to play an important role in monitoring Earth’s agrifood systems.
Recognizing the growing need for a dedicated program focused on food production and access, NASA Harvest was established in 2017 to serve as NASA’s official Agriculture and Food Security program. NASA Harvest combines Earth observation (EO) data, machine learning, and the knowledge of agricultural experts around the world to better inform agricultural decision-making at every level. NASA Harvest partners have made significant use of the Landsat program’s rich data archives in terms of advancing research in mapping crop types, monitoring agricultural conditions, estimating crop yields, and analyzing how management decisions affect productivity and market responses across agrifood systems.
Senior members of the NASA Harvest team such as Dr. Chris Justice, Dr. Matt Hansen, and Dr. Eric Vermote have been at the forefront of EO data usage and Landsat applications for several combined decades. While the first Landsat images were simply photographic products, as digital data became available in the 1970s, Dr. Justice started working on data from the first Landsat satellite (ERTS-1) and subsequent missions for land cover classification. Dr. Eric Vermote has been responsible for developing the atmospheric correction procedures for Landsat, which have been adopted by the USGS for operational use, as they moved to distributing Applications Ready Data.
Reflecting on the program, Chris Justice said “The first Landsat mission was designed with agricultural monitoring as a key application. These early Landsat observations laid the foundation for using satellite data to monitor where crops are growing; crop condition as the growing season progresses; and estimating crop yields and total production from space. Landsat allowed the USDA to develop its Cropland Data Layer program. This approach has become a gold standard among agricultural ministries for annual identification of which crops are growing in their country.
Landsat Joined By Other EO Satellites
Over the years, Landsat capability has been bolstered by other moderate resolution Earth Observation (EO) satellites from the international community, starting with the French SPOT mission in 1986. In 2014, the European Space Agency began launching its Sentinel series of satellites in close collaboration with the Landsat mission, significantly increasing the frequency of observations and adding to the amount of EO data available for research and analysis. These two programs share in the benefits of providing free and openly available medium resolution EO data to the public. As crops change and develop rapidly throughout the growing season, timely and frequent observations are critical and Landsat 9 will play an important role in increasing the frequency of observations. Between two Landsats and two sentinels, available satellite data will provide almost daily observations to observe every field across the globe.
Despite some differences in spectral and spatial resolutions, the two programs complement each other particularly well especially for agricultural applications. A recent study co-funded by NASA Harvest and co-authored by researchers of the University of Maryland’s Global Land Analysis and Discovery (GLAD) group explores how the Landsat and Sentinel satellites compare in crop classification capabilities. This research found that medium-resolution imagery from Landsat 7 and 8 performs on par with the higher spatial resolution offered by the European Space Agency’s Sentinel-1 and Sentinel-2 satellites. Specifically, both sets of satellites are able to classify corn and soybean crops with accuracies above 94% and when their imagery was combined, the team was able to reach accuracy levels of 97%.
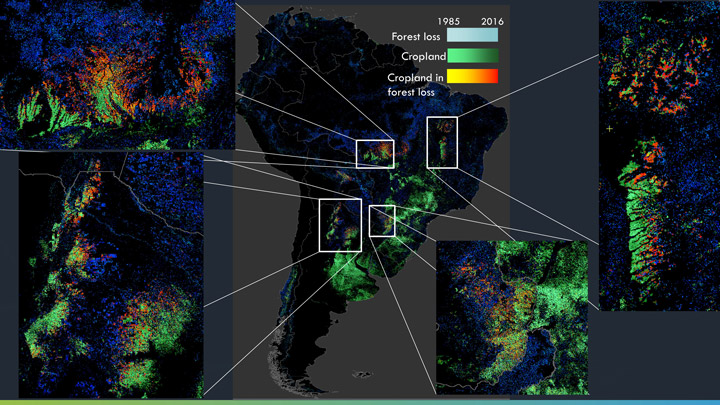
Dr. Matt Hansen has also used Landsat data and imagery to create the Global Forest Watch (GFW) product which provides an annual Landsat-based, global tree cover map allowing users to see how the global forest footprint grows and shrinks in different locales every year. Given the relationship between cropland expansion and deforestation, GFW’s annual tree cover data product allows for better analysis of how agricultural production drives forest loss.
Decades of Data Enabling Long Term Analysis
The Landsat program is especially unique and useful thanks to its longevity, providing researchers with an unmatched historical data archive. Collecting data for just under fifty years, the satellite mission has enabled longitudinal studies of agricultural change that would otherwise be impossible. One team based at Stanford’s Center on Food Security and the Environment (FSE) which includes NASA Harvest partners Dr. David Lobell, Dr. Jillian Deines, and Dr. Sherrie Wang, have demonstrated this by using Landsat imagery to greatly expand the temporal range of currently available U.S. crop maps. The country-wide crop maps currently produced by the USDA as part of the Cropland Data Layer (CDL), while very accurate, only include information on crops dating back to 2008. The FSE team makes use of the Landsat archive to bolster the existing CDL dataset and map corn and soybean production across the U.S. midwest, going all the way back to 1999.
Utilizing even more of the Landsat historical data, this team has also explored how agricultural irrigation has changed in the U.S. midwest over more than three decades. Led by Dr. Jillian Deines, FSE was able to create an annual series of maps showing irrigated cropland within the High Plains Aquifer in the Central United States from 1984 to 2017. This time series of irrigated maps proves vital in understanding how irrigated agriculture is changing in one of the most agriculturally productive regions on the planet, as well as building a strong base for further research into how water conservation can preserve natural aquifers while also increasing farmer profits.
Enabling New Landsat Applications
Landsat 9 provides a critical extension of this 50 year data record for monitoring our food supplies and helping to inform and address crucial decisions in how we manage, grow and adapt our food production sustainably under a warming climate and with an increasing population. Whether it is informing farmer decisions on management practices that support soil health, supporting transparent and stable agricultural commodity markets, providing early warning of impending crop shortfalls, supporting more efficient and effective agricultural insurance schemes, or tracking agricultural expansion, the Landsat program has had an enormous impact on how we understand farming and food security since its inception. With the launch of Landsat 9, new applications can be developed and the legacy of Earth observations for informed decision making continues on.
Visit Landsat Science to learn more about the Landsat program and the upcoming launch.
How Earth observation technologies are revolutionizing global agri-food systems.
Nowadays, various forms of technology play a fundamental role in our daily routines. From the use of GPS to navigate to different places, to sharing pictures using just our smartphones, to automatic vacuum cleaners, there are endless examples. Even when it comes to the food we eat there have been so many technological advances and an immeasurable amount of research developed, particularly in the past few decades.
But one common technological thread that we can find within all of these different aspects of our lives is Earth Observation Technologies (EOT) and remote sensing. Numerous Earth observing (EO) satellites have been launched into space by NASA and other international space agencies within the last decade, serving to collect (or “remotely sense”) data about our home planet, which helps experts around the world to better understand our ecosystems and environment. We’ll take a look at agricultural production, international food markets, and global food security as an example of the importance of this remotely sensed Earth observation data.
There are several steps and many factors involved from the time a crop is grown on a plot of land to the availability of certain crops and the price volatilities eventually seen in the corresponding food market system. Because of the complicated paths of the agricultural supply chain, it is often easier to understand this relationship if we think about it as a collective “agri-food system.” Over the past decades, agri-food systems have evolved in so many aspects, but so have the EO technologies that make it easier to understand and monitor every step of this complex chain, bringing transparency and efficiency to the overall system. According to the United Nations definition, the food system includes many different factors such as: food-related resources, various food system inputs, production, transport, processing, manufacturing, retailing, and food consumption, all in addition to the overall agri-food system impacts on environment, health, and society. Many of the changes in our food systems are attributed to external and internal forces as well as feedback mechanisms among these forces.
Let’s start from the beginning—from the farm and from the plot. With the help of satellites and EOT, producers have a better understanding of weather patterns and can plan the optimal time to sow their land. With GPS-based technologies, producers can use precision agriculture to specifically apply only the needed amount of fertilizers, herbicides, and seeds. Once everything is in the ground, farmers can remotely monitor how the crops are developing from anywhere in the world, and they can even estimate the potential yield they can expect at harvest time months in advance of actual harvesting dates. Such tools are extremely important for successful financial planning. While those crops are still developing, we can use EOT to monitor agro-meteorological conditions such as temperature and precipitation, and their impacts on crop conditions—all of which help us understand if today’s conditions are following the average trends seen in previous seasons. If anomalies occur, the EOT data can warn us well in advance of a potentially catastrophic harvest season which enables earlier mitigation actions.
Meanwhile, as that same crop is growing, many different market actors around the world are trying to estimate how much of that crop will be successfully produced, not only in that specific region but also throughout the whole country and elsewhere around the globe. Consequently, accurate early estimates of crop area and crop yields are fundamental to the efficient and transparent functioning of global agricultural markets. And guess what? Remote sensing technologies play a critical role here too, providing key pieces of information for analyzing and developing estimates at different scales for crop area and yield, making use of NASA satellite data from missions such as MODIS, Landsat-8, and SMAP, with additional launches on the way (i.e. NISAR, Landsat-9).
At a national level, having accurate and timely information helps policy makers to enact more suitable mitigation plans in case they need to take action if there is an unusual shock to the food system (i.e. extreme weather events, food price changes, a global pandemic, etc.), not only for countries whose economies depend on those crops to be exported but also those countries who rely on imports for their food security. EOT can also help to put many farmers literally on the map, and provide policymakers with timely tools and resources to help them. National governments can assess various crop situations using EOT and are currently monitoring the crop conditions with existing National Crop Monitors. Because the agricultural system on a whole is so dynamic, remote sensing technology can also help update estimates of crop production at a national level as the state of the agrifood system changes.
At a global level, with the help of information provided by satellite data, the early warning community (including the GEOGLAM Crop Monitor for Early Warning and various humanitarian organizations) have a better understanding of the current situation and can utilize early warning information for early action to more efficiently allocate aid where and when needed. Crop production estimates play an important role in price volatility in different markets, both domestically and internationally, which highlights the need for accurate, cost-effective, and frequent agrifood system monitoring. International communities, such as the Agricultural Market Information System (AMIS), have been launched by the G20 in an effort to monitor commodity price volatility. For example, AMIS publishes a crop monitor bulletin in their monthly reports as a way of providing more transparency into agricultural markets. Timely and accurate assessments of crop harvest quantities can have a positive impact in avoiding extreme price volatility.
But going back to our crop, remote-sensing data and advanced computing capacity improve yield estimates, subsequently improving the financial planning of the producers (i.e. both small- and large-scale farming operations). Remote sensing technologies also improve field-scale nutrient management, not only helping improve sustainability of crop production but also saving on costs for the farmers. Accurate crop area estimates, especially those estimates with a regional approach, help different types of companies—including seed providers, fertilizers, herbicide producers, agriculture services, machinery companies, and many others—to better plan their marketing and distribution strategies. This information creates a more efficient allocation of resources, with benefits also being seen in often under-represented rural areas.
Moving along the food cycle to the post-harvesting stage, if there was a problem with the harvested crop then insurance providers can use remote sensing technologies to assess the situation from anywhere, minimizing cost and emissions of visiting the plots themselves. Remarkably, remote-sensing data can reduce the transaction costs associated with monitoring traditional insurance contracts, reinvigorating rural finance markets.
But the role of remote sensing technology doesn’t finish when the crop is harvested. Once the crop is out of the ground and for example, sent to the grain elevator, we can track the exact location of the vessels on which those grains are traveling and their destinations. Most recently, we were able to use Planet satellite images to spot the movements of the cargo ship that halted global trade and created a massive bottleneck in the global supply chain.
Overall, Earth observation technologies are making the interlinkages of the complex and sometimes fragile agrifood systems more transparent, accurate, and efficient, while also helping to reduce transaction cost and shedding light on the information asymmetry challenges. It almost goes without saying that science, innovation, and technology have huge impacts on understanding changes to food systems. Markets, trade, and related infrastructures—increasingly combined with digitization—are today cutting across internal and external drivers of food systems’ change (Von Braun, 2020) and digital technologies will undoubtedly continue to increase efficiency in the design and delivery of agricultural policies (Schroeder, Lampietti, & Elabed, 2021). EOT has the capacity to enable a rapid assessment of different shocks, providing a powerful tool for decision makers across the agricultural, government, and humanitarian spectrums.
References
Von Braun, J. A. (2020, October 26). Food Systems – Definition, Concept and Application for the UN Food Systems Summit.
Schroeder, K., Lampietti, J., Elabed, G. (2021, March 16). What’s Cooking : Digital Transformation of the Agrifood System.
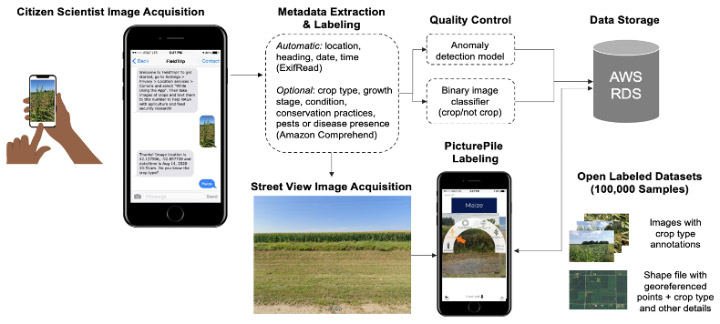
Satellite Data for Agricultural Monitoring
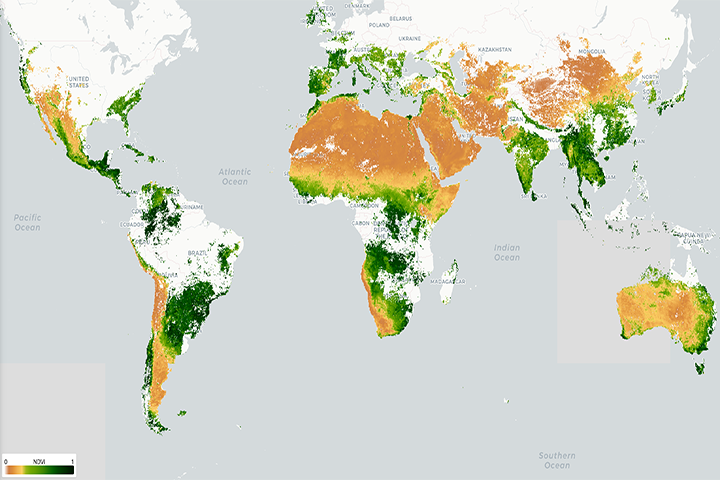
Food security and agriculture is probably not the first thing that comes to mind when you think about satellites being launched into space and orbiting planet Earth. You might even be surprised to learn that NASA, best known for its space exploration, actually has over a dozen satellite missions dedicated to monitoring food production, land changes, and vegetation. Truth be told, the data provided by these Earth observing satellites provides critical information for analyzing the state of food production and food security around the world. From space, we can see things like the NDVI (namely, green light reflectance) of plants which is indicative of crop health, crop damage resulting from natural disasters (such as the 2020 Iowa derecho), and even the amount of moisture stored deep within farmland soil. However, compiling these large satellite datasets into deep time series to monitor interannual and within-season changes in vegetation requires a lot of skill, computational power, and time.
The Legacy Global Agricultural Monitoring System Gets an Update
In the early days of satellite Earth observations, the University of Maryland worked together with NASA and USDA to develop the first web-based platform to enable near-real-time monitoring of global croplands, enabling users across the globe to track crop conditions as growing seasons unfolded (re. Monitoring Global Croplands with Coarse Resolution Earth Observations: The Global Agriculture Monitoring (GLAM) Project). After years of operational use and a lot of valuable feedback from partners, the time came to redesign this system – known as Global Agricultural Monitoring or GLAM – to be faster, more flexible, and to capitalize new datasets coming online and new computing architectures available. Thanks to funding from NASA ESDS and NASA Applied Sciences, the team at NASA Harvest (NASA’s Food Security and Agriculture Program) has accomplished just that.
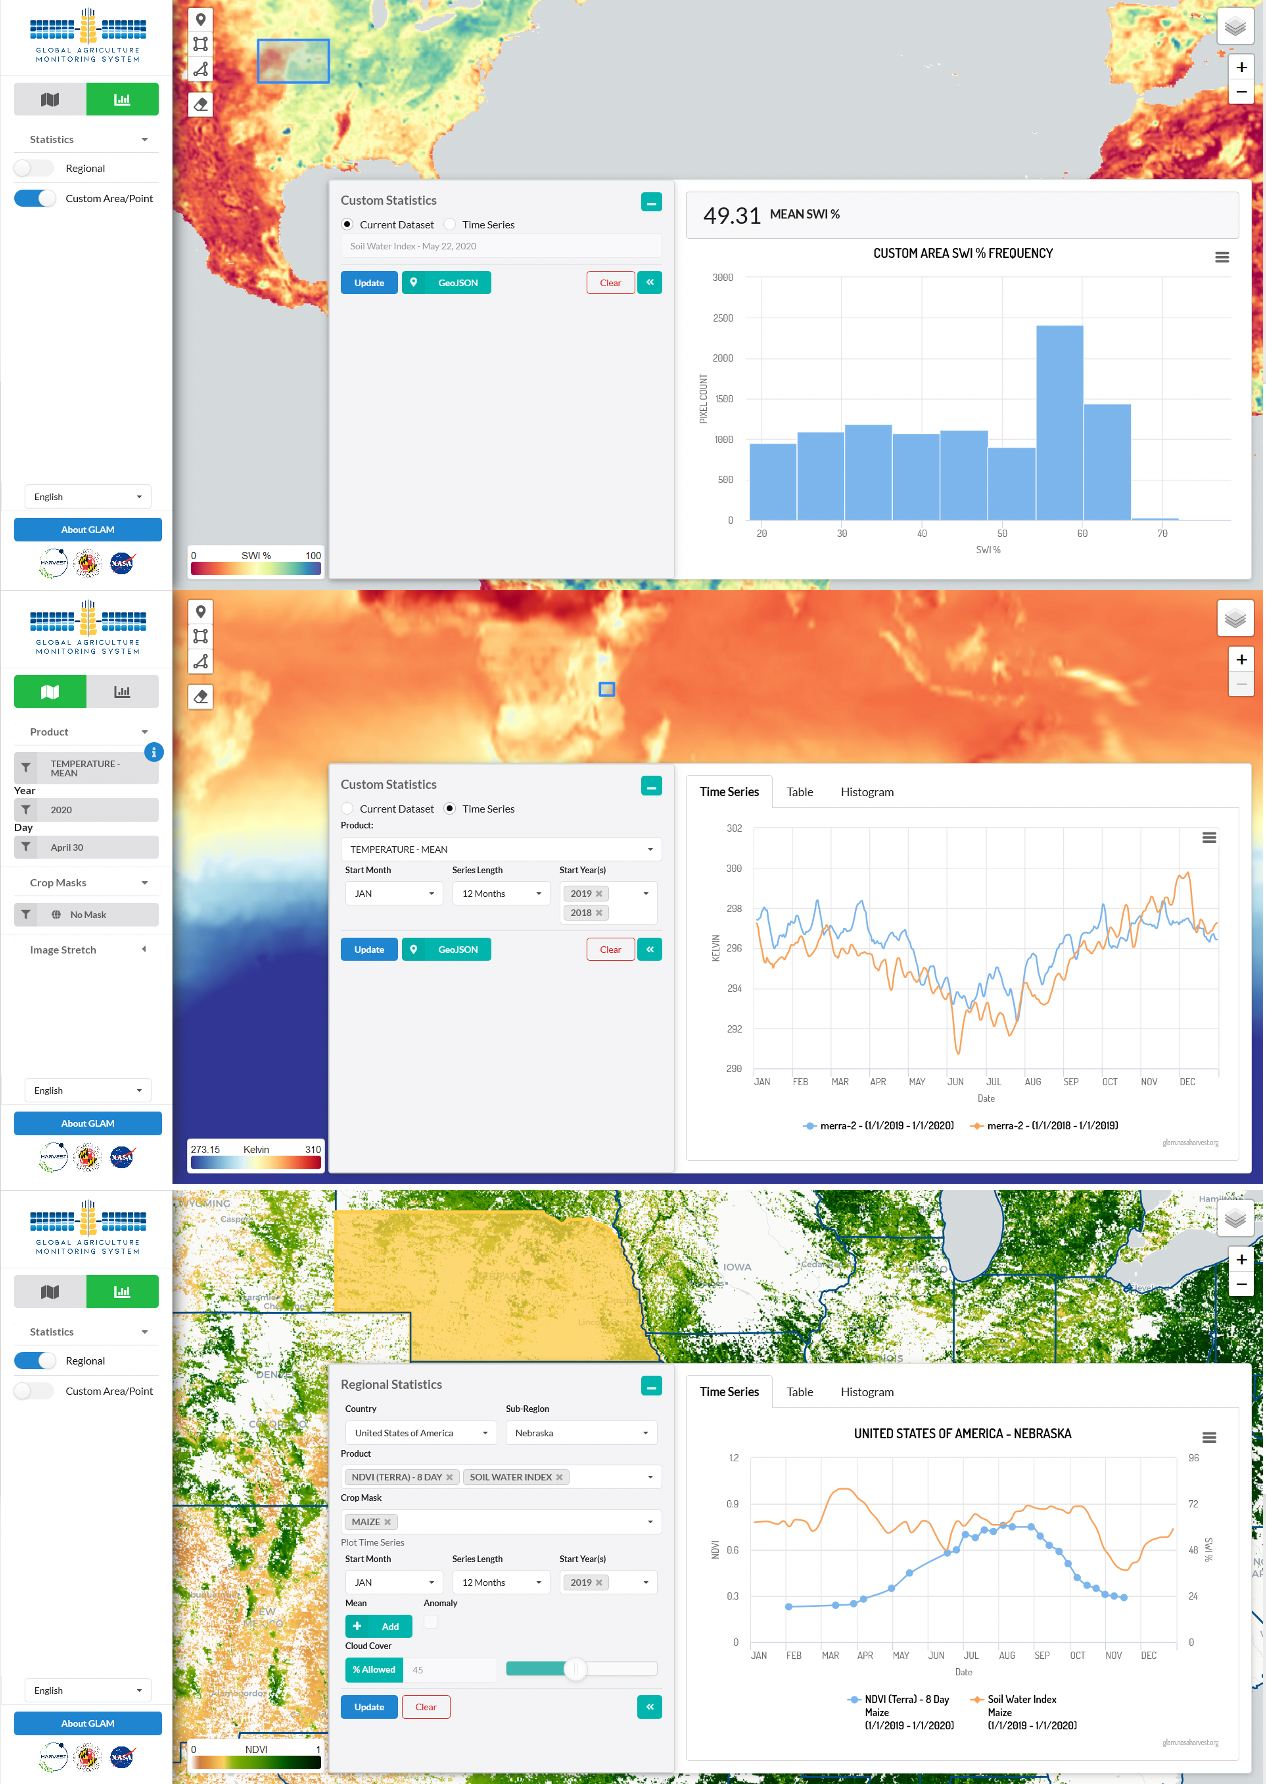
New GLAM System Features, Datasets, and Functionalities
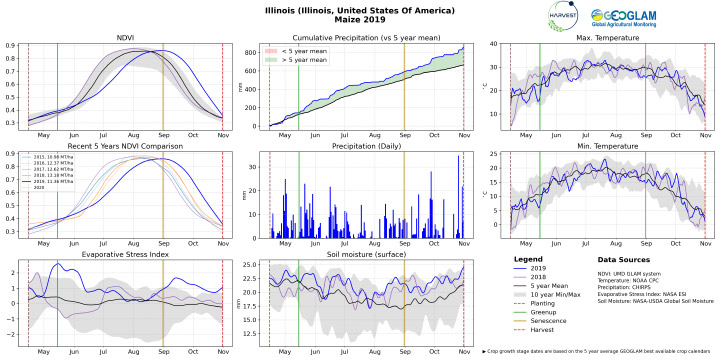
Now lightning-fast due to back-end developments that drastically reduce processing time, the new GLAM system includes many new functions. Users can access the publicly-available web-interface from anywhere in the world, as all processing takes place on “the cloud” and does not rely on local bandwidth to compile datasets. They can use the interface to pan around the globe to a region of interest. They can select an administrative boundary or draw a custom polygon to investigate. They can select from a variety of cropland and crop type masks to target relevant croplands, and then create custom time series charts with the ability to calculate mean and anomaly for datasets over time. Because cloud cover is a common issue in many agricultural regions and cultivation periods, users can customize their cloud cover tolerance in plotting and displaying imagery as well. Furthermore, users also have the ability to overplot crop calendar information on their time series plots, which provides important context to compare crop conditions between years.
In addition to these new functions and features, the interface includes multiple new datasets to help analysts glean insight into the drivers behind anomalous crop conditions throughout the world. Currently, the new GLAM system includes 8-day and 16-day NDVI datasets from NASA’s Moderate Resolution Imaging Spectroradiometer (MODIS), CHIRPS Precipitation datasets from the University of California Santa Barbara Climate Hazards Center, Soil Water Index from the Copernicus Global Land Service, and Temperature datasets from NASA’s MERRA-2 product, with more datasets on the way.
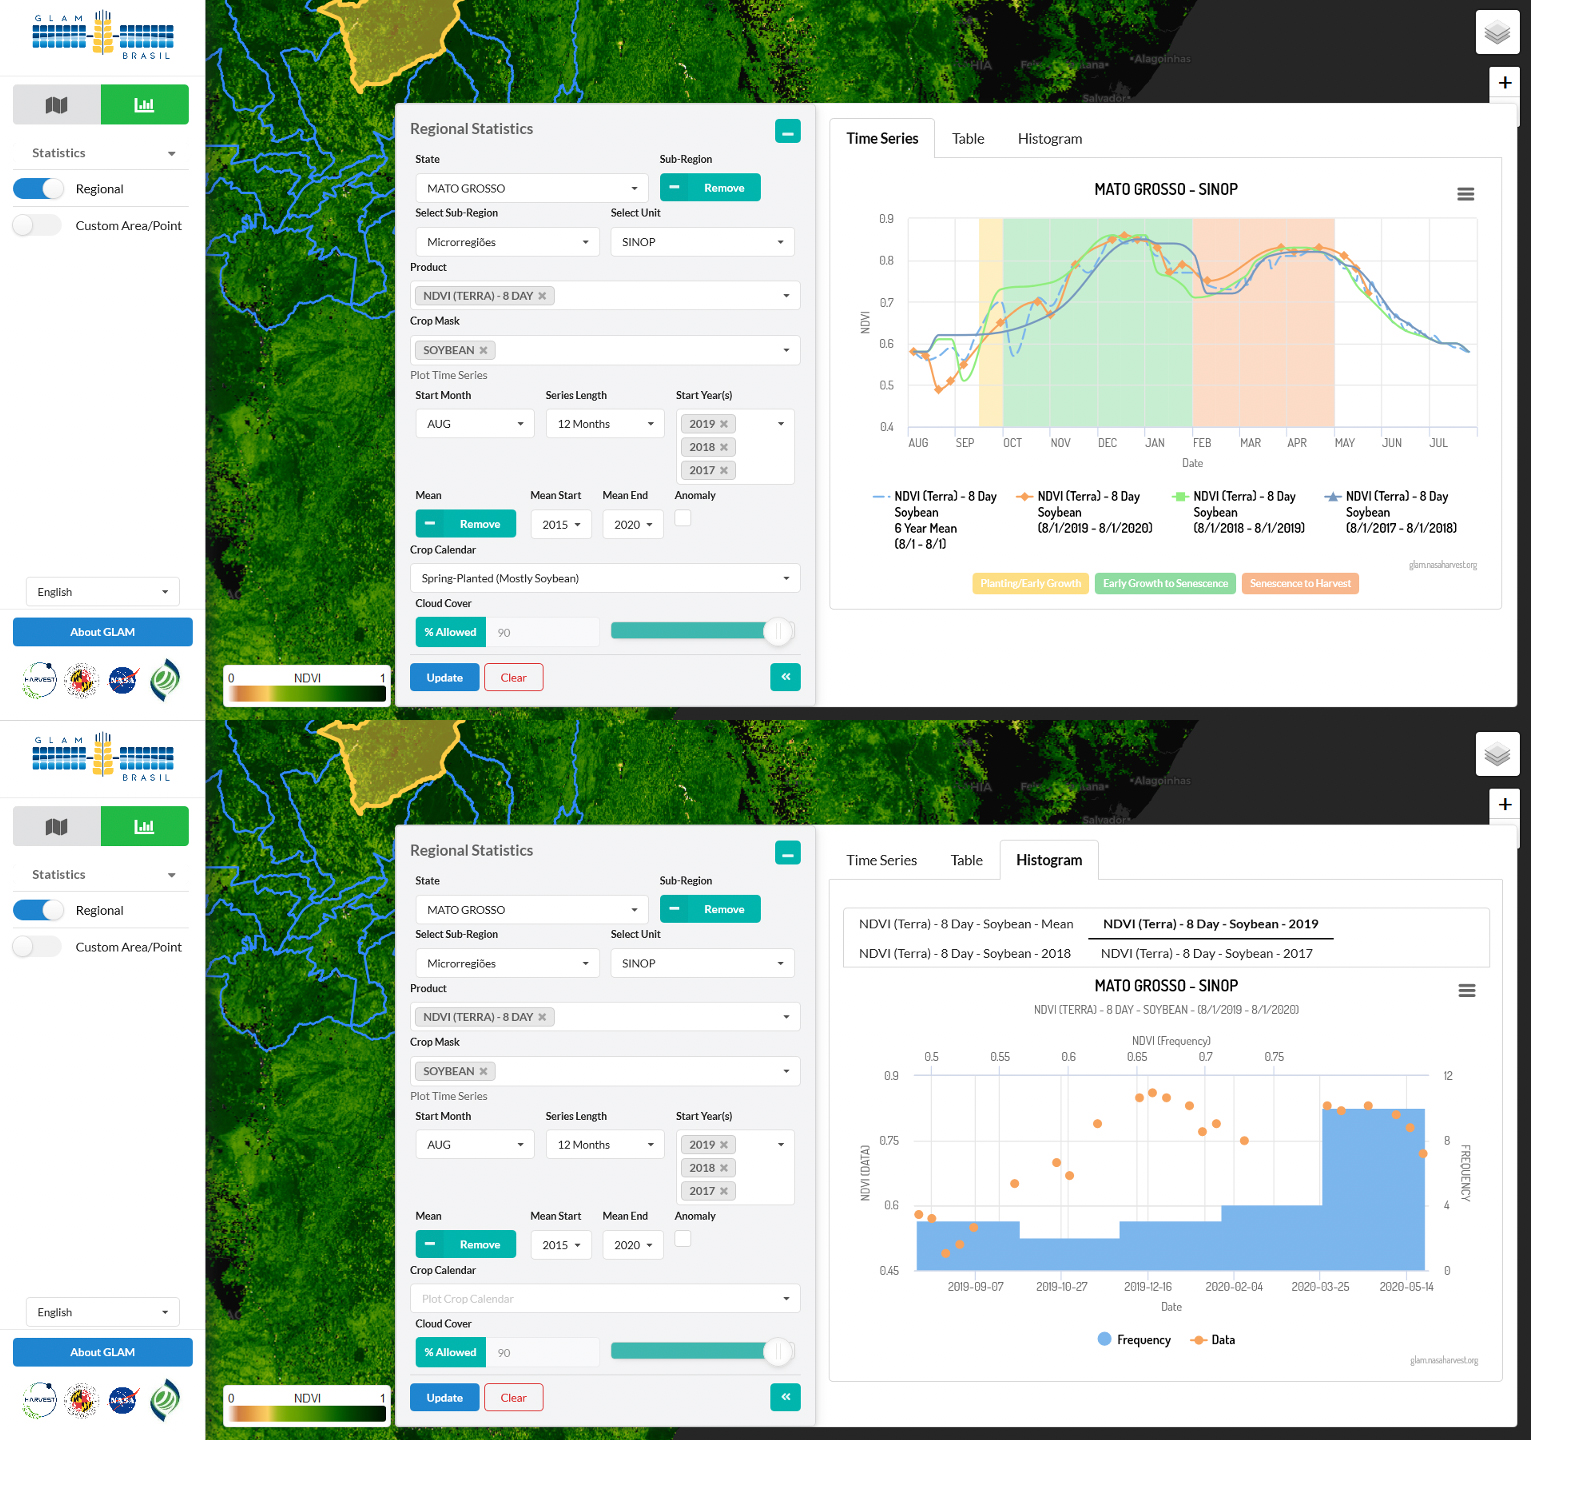
In addition to the existing global interface, there are also national GLAM system implementations planned and already operational. First up is the Conab Brasil customized GLAM interface, which was developed and tested hand-in-hand with NASA Harvest counterparts at Conab. Conab is a public company, operationally mandated by the Ministry of Agriculture, Livestock and Food Supply to produce area, yield and production estimates regarding several major commodity crops to the Brazilian government. While users can still view and implement all of the same types of datasets offered in the global system, the Brasil GLAM website offers additional features. While the global site does include regional statistics at the subnational level, the Brazilian site goes beyond the subnational level. In response to Brazilian administrative regional needs, this application includes extra Brazil-specific crop masks as well as extra levels of analysis.
What’s Ahead
The updated GLAM system has already been widely used to flag potential crop impacts especially in Argentina, as featured by the country’s largest media outlet La Nacion. In addition to the system’s current capabilities, planned features include the ability to upload custom geometry (for example, shp, kml, geojson) to retrieve dataset statistics and visualization of dataset anomaly in order to provide users with an indication of the relative performance of a crop over time. The team is also preparing to integrate moderate resolution satellite data sets, for example Landsat, Sentinel, and the Hybrid Landsat-Sentinel products, to move us into this new era of continuous land monitoring at 30 meters or finer resolution. Additionally, the serverless architecture enables us to quickly spin up and launch new GLAM systems for other regions and users.
Are you interested in your own GLAM system? Contact project PI Alyssa Whitcraft.
How We Accomplished It
By using Amazon Web Services (AWS) and “serverless” architecture, the NASA Harvest team has been able to create both a web application and application programming interface (API) that provides on-the-fly data projection, masking, color table application, image differencing, and statistics calculation. As a result, it is not necessary to pre-generate all permutations of the NDVI datasets that would previously have been generated in on-premises architecture. Likewise, it is also not necessary to reproject the global NDVI datasets with the new GLAM system. The on-the-fly capabilities reduce the storage demand to the volume of only the NDVI files (less than ten terabytes) as opposed to the hundreds of terabytes required by the previous on-premises architecture version. In addition, because these functions are done on the spot, the collection of datasets, crop masks, and color ramps can be arbitrary. Therefore, the system does not need to be limited to NDVI and can be expanded to include precipitation, soil moisture, or any other raster dataset.