August 5, 2014
Three weeks at sea is a long time for someone who has never been out of sight of shore. My greatest impression during my time out here is the one I first had when we first set out: the ocean is really, really big! I realize that probably sounds too obvious to be worth mentioning, but the sheer vastness of the ocean is hard to overstate. Standing on the deck, turning 360 degrees and seeing nothing but smooth, blue water as far as the horizon, it’s hard not to be struck by how empty it all appears.
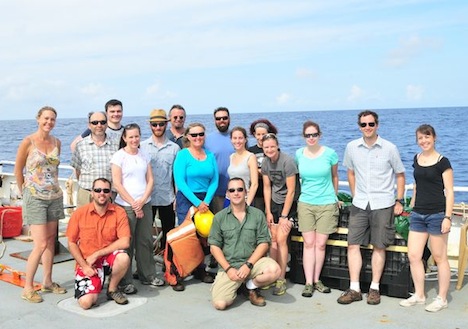
The SABOR science party on the deck of the R/V Endeavor. Front row: Wayne Slade (Sequoia Scientific), Deric Gray (Naval Research Laboratory); second row: Kimberly Halsey (Oregon State University), Alex Gilerson (City College of New York), Nicole Poulton (Bigelow Laboratory for Ocean Sciences), Matthew Brown (Oregon State University), Lynne Butler (University of Rhode Island), Nerissa Fisher (Oregon State University), Ali Chase (University of Maine), Nicole Stockley (WET Labs), Robert Foster (The City College of New York), Coutrney Kearney (Naval Research Laboratory); back row: Carlos Carrizo (City College of New York), Allen Milligan (Oregon State University), Jason Graff (Oregon State University), Ivona Cetinić (University of Maine). Credit: NASA SABOR/Wayne Slade, Sequoia Scientific
Of course, that’s not true at all. The ocean, far from being empty, is teeming with life. Most of it is too small for us to see with the naked eye, but it’s there all the same and it affects each and every one of us even if we’ve never been to the sea in our lives. Phytoplankton, the microscopic algae that live in the sunlit regions of the ocean, not only provide much of the oxygen we breath, they also play an important role in managing the earth’s climate through their roles in uptaking CO2 from the atmosphere and cycling nutrients like nitrogen and sulfur through the ecosystem.
A big part of what our group does is trying to understand how different aspects of the ocean environment (light, nutrients, grazing pressure) affect the ability of the phytoplankton to photosynthesize and grow. One way we do this is through a piece of equipment called a fluorometer, which can give us an indication of how efficiently algae are absorbing photons from the sun and turning their energy into carbon. It works by hitting them with a large amount of light, then measuring what percentage gets released back after getting absorbed. A simple enough technique in principle but one that can tell us all sorts of things, from the size of the molecular antennas the algae use to harvest light to the degree that electrons can be shared between different reaction centers in the chloroplast.
Another technique we use which is pretty cool (or rather, hot) is the use of radioactive isotope as tracers to measure carbon uptake. On the Endeavor that activity takes place in the Rad Van, which is named for radiation and not, unfortunately, for how radical it is. By allowing algae to photosynthesize in the presence of CO2 formed with the carbon isotope 14C, we are able to track how much the carbon is taken up under a variety of different conditions.
Well, three weeks have come and gone and we put into port tomorrow. It will be nice to be back on land, but I will miss the excitement of the ocean. Today, we got a going away surprise in the form of a pod of dolphins that came near our boat and splashed around for awhile. In addition, the water around the ship was filled with a species of salp, gelatinous creatures which kind of look like sea jellies, that was bioluminescent and gave off a brilliant blue light. It was almost like the ocean knew we were leaving and decided to give us a show to send us off.
After just over a full week at sea, we have found the rhythm of our life and work routines. We collect water with the CTD rosette, deploy instruments over the side of the ship, work in the lab, eat, and sleep. That might sound like a lot of work and no play, but we do manage to have fun while we work (think lab dance party while filtering water samples). We’ve also taken time to observe the vast blue around us from the upper deck of the ship, where we recently watched a gorgeous sunset. No green flash sightings yet but I continue to hold out, hoping to see this optical phenomenon – a green flash of light that can sometimes be seen just before the sun disappears below the horizon.

Left: View of the sunset from the top deck. Right: Deck operations just after sunset, which includes deploying two instrument packages that measure a variety of optical parameters, and the CTD rosette, which collects water samples from different depths. Credit: Ali Chase
Several days ago we crossed into the Sargasso Sea, which is an area of very clear blue water due to low amounts of phytoplankton and dissolved matter which absorb light and make the water in some areas, such as coastal regions, a greener color. But here the water is an amazing deep blue color, which is the color of ocean water when there is not much there besides the water itself. One life form that is prevalent is a seaweed called Sargassum, which we frequently see floating by.

The very blue water of the Sargasso Sea, with a few floating pieces of Sargassum. Each piece is roughly the size of dinner plate, for scale. Credit: Ali Chase
Speaking of things that absorb light in the ocean, much of the work we do in the “wet lab” is related to the absorption and scattering of light by different particles in the ocean. This optical oceanography work allows us to measure the way light interacts with particles, in particular phytoplankton, which absorb and scatter light differently depending on the types and amounts of phytoplankton present. Throughout this cruise we are collecting water continuously using a system involving a boom that extends over the side of the ship with a hose hanging from it into the water. A pump on deck constantly brings water from approximately three meters depth through the hose and into the wet lab, where it then flows through several instruments and provides us with constant information about the optical properties of whatever is in the water.
But, the ocean is a massive place, something that we are very much reminded of while working at sea with no land to be seen in any direction. Even sampling the water continuously during this three-week trip will just give us a small snap shot of ocean conditions. This is where satellites come into play, as they can provide a much broader spatial view of the world’s oceans. However, work in the field is necessary to “ground-truth” what the satellites tell us, to be sure that such expansive information can be accurately related to what is present in the ocean. During this research cruise we will pass through several types of water, such as the warm/salty/fewer phytoplankton water like we see here in the Sargasso Sea, versus cooler/nutrient rich/lots of phytoplankton water in coastal areas such as the Gulf of Maine. Understanding the differences between these regions can be useful for interpreting satellite information about phytoplankton and their role in the earth’s carbon cycle.
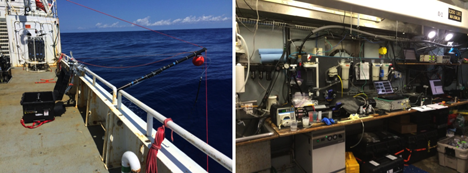
Left: The flow-through intake system; the hose hanging from the end of the black boom sucks up water continuously using the pump located in the black box on deck. Right: The wet lab in all its glory – the tubing with the water pumped from outside can be seen running up near the ceiling; it then flows through several instruments positioned both in the sink and on the bench top. Credit: Ali Chase
A couple of days ago a storm system passed over us, and the winds came up to about 30 knots. With winds that high, waves crash onto the deck and it is unsafe to deploy instruments over the side of the ship, so our work was put on hold for a day. I spent some time on the bridge (where the ship’s captain and crew navigate from) and watched the bow of Endeavor ride the waves like a roller coaster. Every now and then the bow came down against a big wave and an impressive spray of ocean water was sent flying, with water reaching as far as the windshield of the bridge where we were watching!
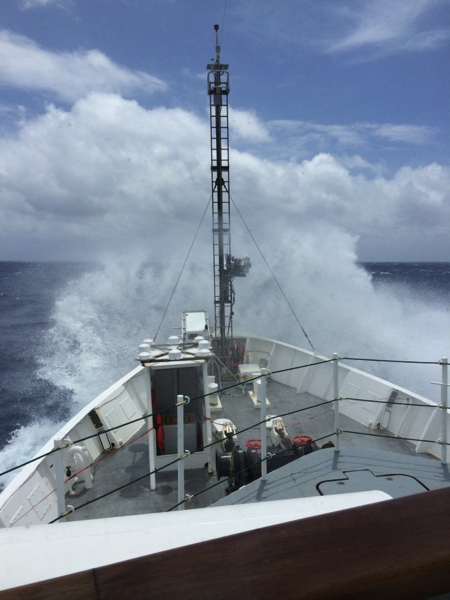
The ship crashes into a large wave during high seas. Credit: Ali Chase
To document our work and life on board we have been putting GoPro cameras on everything, including hard hats and instruments that are deployed over the side of the ship. Recently a GoPro went for a ride on the “Polarimeter”, an instrument that measures the polarization state of light, which Robert mentioned in the previous blog post. While the GoPro was underwater, a big group of dolphins came to say hi, and the GoPro caught it on camera – very cool! We also lowered Styrofoam cups down with the CTD to a depth of 1,000 meters, where the pressure compresses them, along with any writing or pictures that have been drawn on. We sent down a bunch of cups from a school group that had visited the University of Maine’s Darling Marine Center, and we added a few that we decorated ourselves for souvenirs to bring home.

Left: A selfie I took while wearing the GoPro on my hardhat. Credit: Ali Chase; Right: Dolphins near the Polarimeter deployed with a GoPro attached. Credit: Wayne Slade
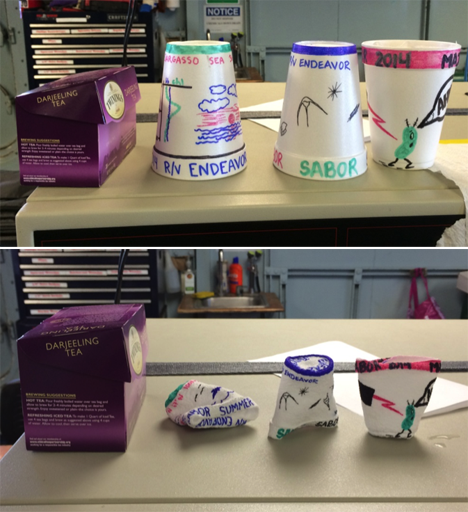
Styrofoam cups that were attached to the CTD and lowered to 1,000 meters, where the pressure compresses them (top = before, bottom = after; box of tea shown for scale). Credit: Ali Chase
I feel very fortunate to be included in this adventure at sea with such a great group of scientists and crew. I am constantly learning about the ocean and how we understand it as oceanographers, as well as all of the techniques and logistics that go into the collection of quality data. It is certainly humbling to be out on the ocean with nothing but blue all around, and I am reminded of why I am drawn to this field of study and how much of our planet is covered in this blue expanse. Thank you for taking the time to read our blog and I hope you’ve enjoyed this glimpse into our life and work at sea!
Ali Chase is a graduate student in oceanography at the University of Maine’s School of Marine Sciences.
Text by Robert Foster
City College of New York – CUNY
Here we are ending the 4th full day aboard the R/V Endeavor, and I can hardly believe it! Time really does fly when you’re having fun! Amid the rush of running cables, installing sensors, learning new and exciting science and making new friends, I couldn’t be happier. I am a 3rd year Ph.D student in the Electrical Engineering department of The City College of New York, and through extremely fortunate circumstance I found myself working in the Optical Remote Sensing Lab of NOAA-CREST.
Life aboard the R/V Endeavor is both exhilarating and exhausting! During our safety briefing I jumped into an immersion “Gumby” suit for the first time, giving my colleagues a good laugh as I tried to close the face flap with my lobster claw gloves.
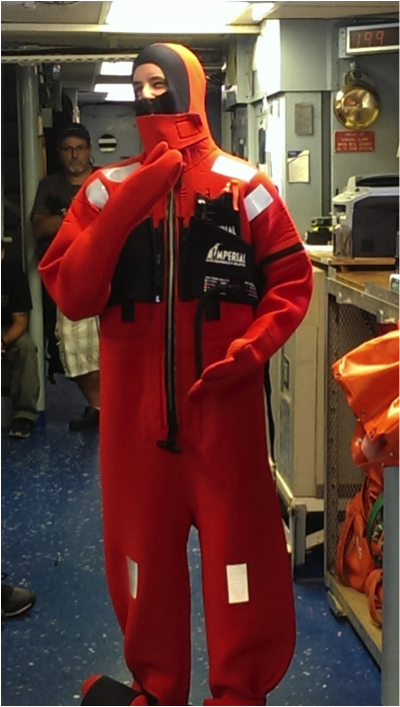
I’m trying on the immersion suit for the first time and posing “mannequin-style” for the safety briefing Friday morning. Photo courtesy of Ivona Cetinic, University of Maine
Although we’re currently 18 miles off the shore of New Hampshire, we’ve already had several visitors!
On Saturday morning we spotted a pod of whales in the distance. They were too far away to photograph, but we could clearly make out their sprays and tailfins when they dove.
And the dolphins! This was the best part. Just a couple hours after leaving port on Friday the entire science team was on deck learning how to deploy the CTD when a pod of dolphins started leaping out of the water not 20 feet from the ship! It was almost as if they wanted to see us off on our journey! We managed to snap some really fantastic photos.
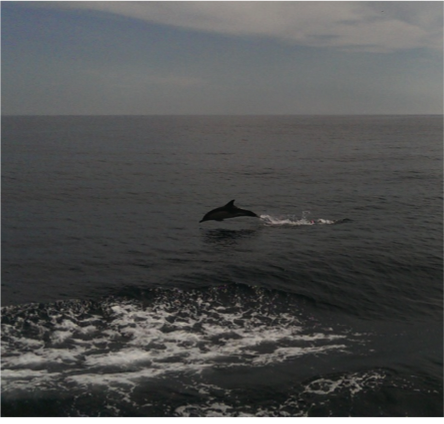
Dolphins jumping out of the water to see us off! Photo courtesy of Ivona Cetinic, University of Maine
Slightly more numerous than dolphins are the tiny phytoplankton which provide us with so much of the oxygen we breathe. Inside Endeavor’s main lab is an amazing instrument that can actually take pictures of these microscopic creatures and count them! Since one of SABOR’s primary science goals is to quantify how much carbon is being converted into oxygen by marine life, it is vital that we know exactly what species are present and in what concentrations.
Of course it’s impossible for the R/V Endeavor to be everywhere at once, so we must rely heavily on satellite observations. Current sensors such as MODIS (Moderate-Resolution Imaging Spectroradiometer) aboard the Aqua satellite and VIIRS (Visible-Infrared Imaging Radiometer Suite) aboard the Suomi NPP platform are designed to observe the ocean and atmosphere. Although they do it quite well in a general sense, there is still too much uncertainty to make absolute assessments of climate change and carbon cycling.
When we as humans look at an object, what is it that we’re actually seeing? (No, it’s not a philosophical question!) We see color and brightness. Seems sufficient, doesn’t it? But it turns out that there is actually another hidden property of light that we can’t see with our eyes, and it’s called polarization.
So if we can’t see the polarization of light, why do we care about it? Why is it a major focus of SABOR? The answer is because it’s becoming more and more difficult to increase the accuracy of satellite measurements using color and brightness alone. By incorporating polarization into our measurements, we are opening up a whole new dimension of information that was previously inaccessible. Our laboratory at the City College of New York is studying the way light becomes polarized in various conditions both above and below the surface of the ocean.
The first of the two instruments that we designed at City College is called HyperSAS-Pol. It is designed to automatically look at a fixed angle relative to the sun, regardless of the direction the ship is facing. HyperSAS-Pol measures both the polarization of sky light, and also light coming from the ocean.
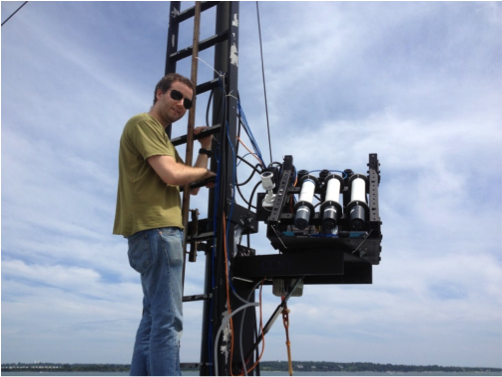
I’m setting up HyperSAS-Pol on the bow tower of the R/V Endeavor. Photo courtesy of Alex Gilerson, City College of New York
Our second instrument floats on the surface of the ocean and measures the polarization of light underwater. We can rotate the instrument by using propellers that are attached to its arms. The sensors themselves are attached to a stepper motor which can look up or down in the water. With these two motions we can measure polarized light in any direction. By the way, this instrument doesn’t have an awesome code name like HyperSAS. We just call it the polarimeter… pretty boring name, I know. Maybe you can think of a better one? Post a comment!
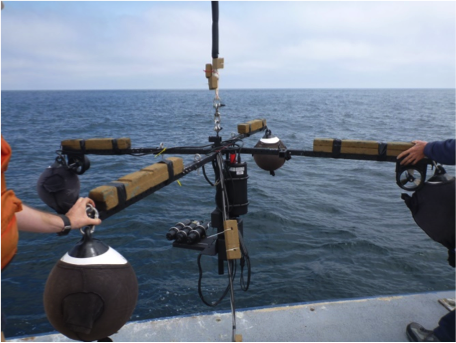
Our floating polarimeter. Photo courtesy of Alex Gilerson, City College of New York
While we are taking measurements on the R/V Endeavor, a plane will be crossing our path several times with a sensor capable of measuring polarization, as well as a LIDAR. During their test flight on Sunday afternoon we were able to watch the plane corkscrew down from the clouds to circle the ship! Too cool. They even took a picture of us!
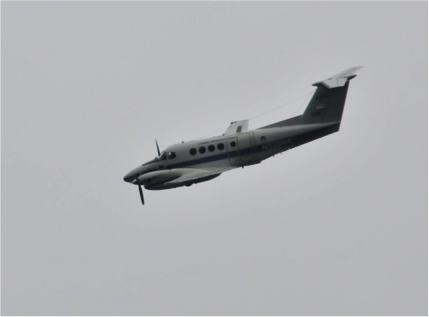
The NASA Langley plane circling the R/V Endeavor on Sunday afternoon. Photo courtesy of Wayne Slade, Sequoia Scientific
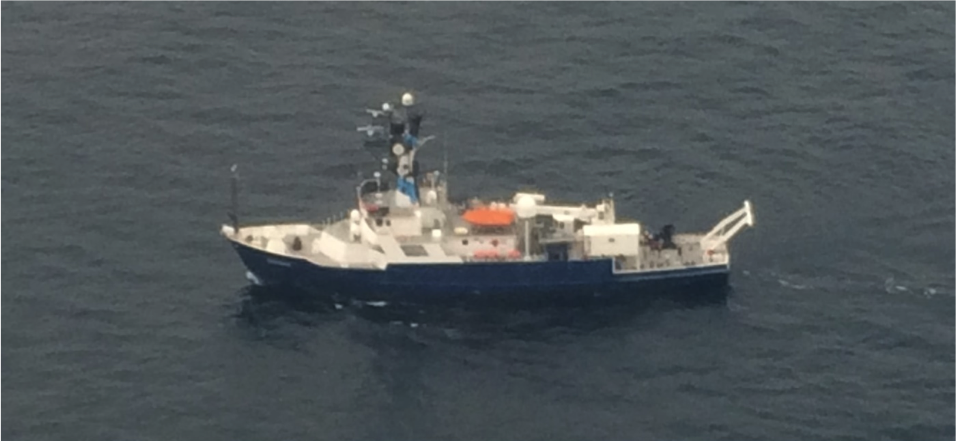
The R/V Endeavor as seen from the sky! Photo courtesy of David Harper, NASA Langley Research Center
Between the combined efforts of everyone onboard the R/V Endeavor and in the sky, we will be able to trace the complete path of polarized light coming from the sun, down through the atmosphere, into the water, interacting with all the little sea critters and finally emerging back into space to be captured by one of NASA’s Earth Observing satellites. If successful, our work here will be instrumental in the design of next generation satellites, such as the PACE mission.
We have one final visitor who is here in spirit, and his scientific value is without doubt. He makes sure that no light gets reflected off the white buoys and contaminates our underwater sensors. He is a childhood friend of mine, but I’m sure that you’ve met him before too!

Our very special colleague. Photo courtesy of Chris Armanetti, R/V Endeavor
Starting July 2014, scientists with NASA’s Ship-Aircraft Bio-Optical Research (SABOR) experiment will make observations from ship and aircraft off the U.S. Atlantic Coast aimed at advancing the technology needed to measure microscopic plankton in the ocean from space. For the next three weeks, follow SABOR researchers as they work toward finding out how and why plankton are changing around the planet, and where the carbon associated with plankton goes. Plankton play an important part of the climate system and deliver oxygen to the atmosphere, absorb carbon dioxide, and form the base of the marine food chain.
…
The following post is by Nerissa Fisher
Oregon State University
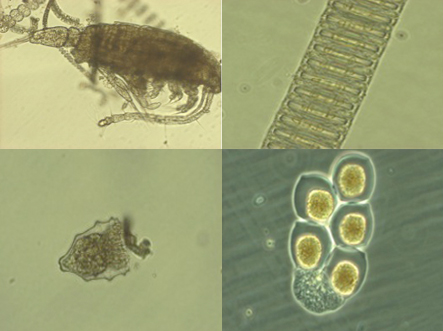
Clockwise from top left: a zooplankton species with a thalssiosira chain in the background; Paralia spp.; a colony of what may be dinoflagellates, and; a ciliate in a protective house — it is most likely that the ciliate ate the phytoplankton that made this outter shell and it now using the shell for protection against zooplankton.
Only three days until the SABOR cruise and I couldn’t be more excited! I have just finished my first year of graduate school in the Microbiology department at Oregon State University where I am pursuing my Master’s degree. I have been on several cruises before, one in the Gulf of Mexico and a couple in Bermuda, but this will be the longest cruise I have ever been on. This is also the first cruise where I have not worked at the research station where the cruise departs, so the entire process of preparing and packing for this cruise that is on the opposite coast has been a much different experience. In past cruises I was not so involved with preparation and my biggest concerns were making sure I had the right clothes and shoes for ship work or the packing list had already been determined and I made sure everything on the list got on the ship. Our research team has had several meetings to discuss the experiments and materials we need to pack. It seems like no matter how far in advance we started packing for this cruise we are still shipping boxes to the east coast. Silly things, like making sure we have beakers to mix solutions in, and all the little knick-knacks that are required for experiments have to be thought of in advance, because once you have left the dock there is no supply closet to run to if materials are missing.
Our research group is measuring how efficiently light energy is converted into phytoplankton biomass. To do this, we are making a number of different measurements simultaneously. Some of these measurements use a state-of-the-art flow cytometer, some use radioisotopes, and some are much simpler and involve filtering seawater and measuring chlorophyll, the pigment that phytoplankton use to absorb light for photosynthesis.
My life in the days leading up to this cruise has been most exhilarating. This past Friday and Saturday were completely booked doing phytoplankton bio-fractionation experiments for my thesis research. I wanted to finish those experiments so that I have data to analyze while on the cruise. Then Sunday, I absolutely HAD to watch the world cup final, which was a fantastic game!! As often as I could pull my attention away from the match, I was also sewing garments that will be used to shade seawater incubation bottles that will allow me to measure primary production at various light intensities.
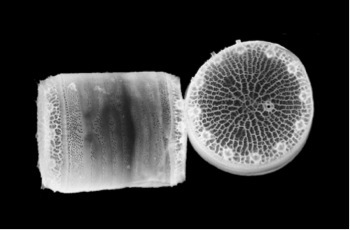
An SEM picture of Thalassiosira pseudonana provided by Alfred Wegener Institute.
Ok, so maybe this doesn’t sound all that exhilarating, but I love phytoplankton ecophysiology, and I could not be more excited to have this opportunity to be at sea for three weeks collecting data that could provide much clearer insights into marine carbon cycling and meet other scientists in the same field. I will have a unique opportunity to apply the measurements I have collected for my research in the laboratory to understand how photosynthetic energy is allocated to different cell compartments, to field samples. This work could potentially be the second chapter of my thesis and broaden my current findings for a single diatom species (Thalassiosira pseudonana, see image above) to natural populations. Without these amazing primary producers of the sea, life on Earth would not exist as we know it and I can’t think of more important work than trying to better understand their physiology, especially in a world that is changing more rapidly than ever before. I am ready to be surrounded by great people, fun, yet exhausting, experiments, and nothing but blue.
My apologies for the gap between blog posts. My day job has been pretty busy. And even though the NASA folks have already arrived safely to Tahiti as of May 5, 2014, I thought it was fitting to have one last blog post. We have talked a lot about ocean biogeochemical sampling, ocean chemistry, and ocean color radiometry. It is also important to touch on the societal benefits that ocean color radiometry can provide.
In 2007, the International Ocean-Colour Coordinating Group or IOCCG published a report and an additional brochure entitled: “Why Ocean Colour? The Societal Benefits of Ocean-Colour Technology” and “Why Ocean Colour.” I will not go into all of the information detailed in each document here (though feel free to follow the links below at your leisure.)

IOCCG reports
A number of critical uses for ocean color are of particular importance in today’s society. For instance, detection of high algal biomass can indicate the location of potential fishing zone. Fish that eat algae or fish that eat fish that eat algae (did you get all of that?) will be en masse in these blooms. Inter-annual variation in timing and extent of phytoplankton blooms can also affect the survival of larval fish. Satellite imagery can be used to monitor this variation. Moreover, satellite derived sea surface temperature (SST) and wave height information can help aquaculture developers plan where to establish new fish farms. Satellite imagery can be used to detect and monitor blooms of harmful algae, algae (phytoplankton) that ether produce toxins or can clog the gills of fish and invertebrates because of high biomass.
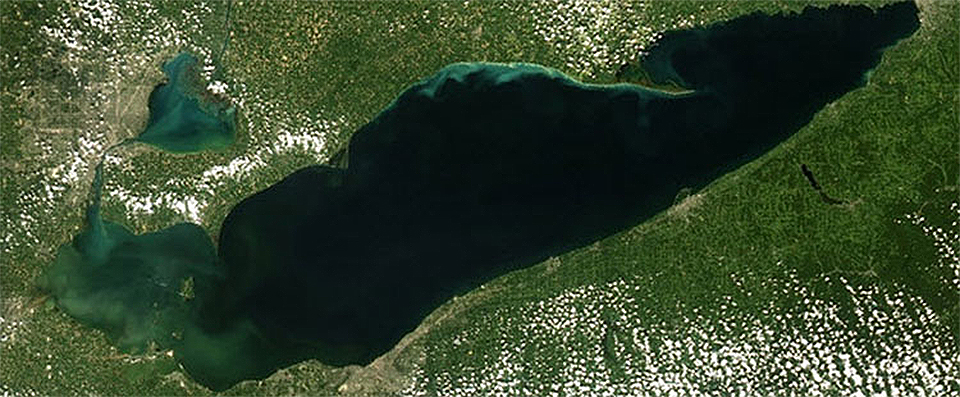
Harmful Algae Bloom in Lake Erie
http://oceanservice.noaa.gov/hazards/hab/
Satellite ocean color imagery is also very important for monitoring delicate ecosystems, particularly in global coastal environments. For example, the European Space Agency (ESA) has developed a program called CoastWatch that helps scientists harness the power of satellite imagery for monitoring water quality in shipping channels and coastal environments. The Medium Resolution Imaging Spectrometer (MERIS) on the Envisat platform (similar to NASA’s MODIS instruments) can be used to monitor sediment deposition onto coral reefs, which can smother the corals. The imagery can also be used to monitor water quality in shipping channels after dredging. Dredging can increase suspended sediments and negatively affect water quality.
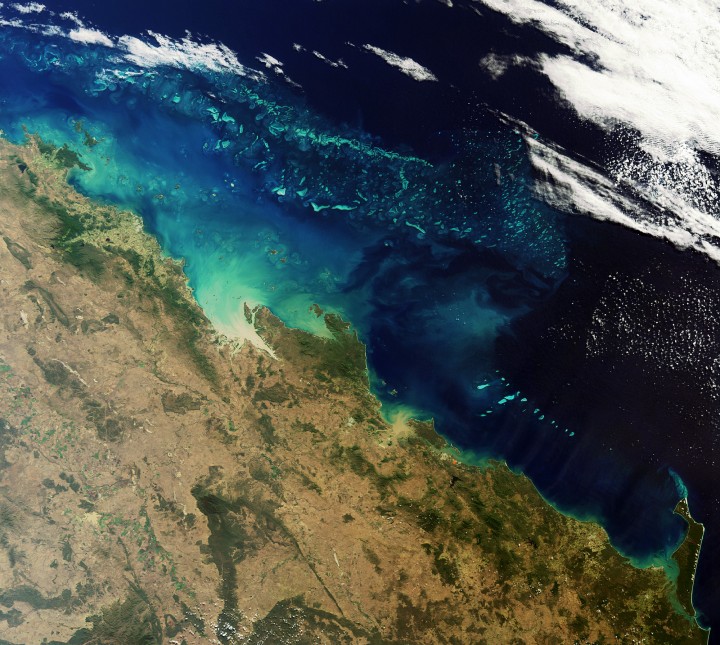
MERIS image: sediments flowing onto the Great Barrier reef in Australia
http://www.esa.int/Our_Activities/Observing_the_Earth/ESA_s_sharp_eyes_on_coastal_waters
Let’s consider a recent ecological disaster: the Deepwater Horizon oil spill. The Deepwater Horizon oil spill has been called the ‘worst oil spill in U.S. history’. The oil spill resulted from an oil platform explosion that occurred on April 20, 2010, and leaked an estimated 4.9 million barrels of oil by the time it was capped on July 15, 2010. This type of disaster can have long-term impacts on coastal wildlife and fisheries. Immediately following the spill, fishing areas around the Gulf Coast were closed to prevent human exposure to dangerous chemicals, polycyclic aromatic hydrocarbons, found in the oil. These chemicals are known to cause cancer. The fisheries were deemed safe and reopened on April 19, 2011.

Oil in the marshes of the Mississippi Delta
http://ocean.si.edu/gulf-oil-spill
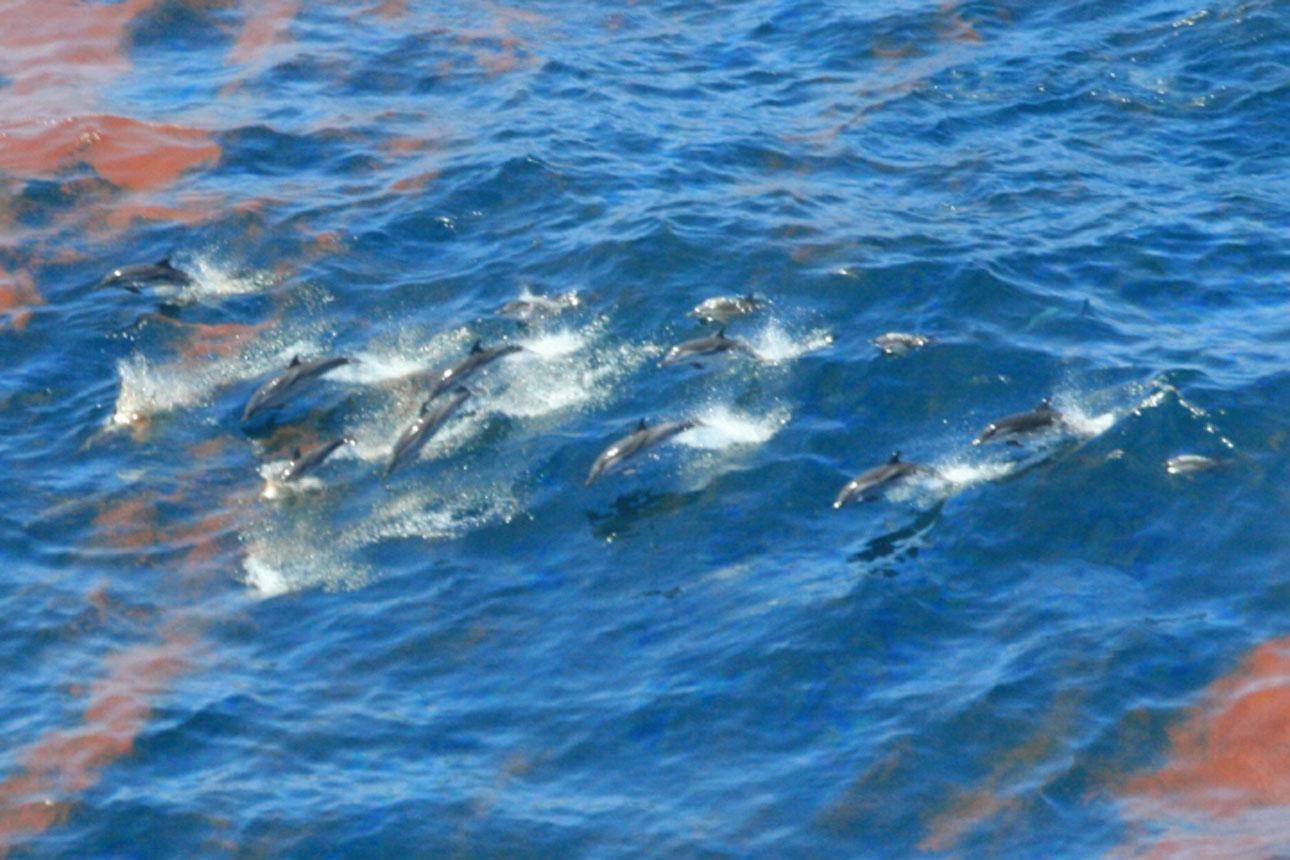
Dolphins swimming through the oil patches from the Deepwater Horizon spill
http://ocean.si.edu/gulf-oil-spill
Satellite ocean color imagery can be used to locate and monitor oil spills of this magnitude. Although this type of imagery is complex, the technology is a great asset. The video below, developed by video producers here at NASA Goddard, shows a timeline of NASA MODIS satellite images. Such imagery allowed scientists to follow the track of the oil slicks. These images can help us prepare for the impact of these disasters when we know where it is headed next. You can find satellite images of the oil spill here.
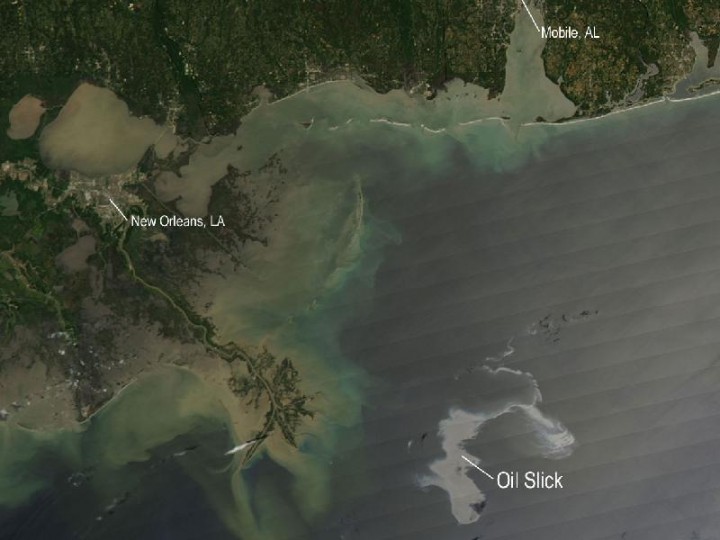
Satellite image of oil slick in the Gulf of Mexico following the sinking of the Deepwater Horizon platform
http://www.nasa.gov/multimedia/imagegallery/image_feature_1649.html
We have truly enjoyed sharing our experiences with all the blog readers. I hope we can do this again very soon. Until next time, make sure you check out all of the NASA field campaigns here at the Earth Observatory website.
http://www.ioccg.org/reports/report7.pdf
http://www.ioccg.org/reports/WOC_brochure.pdf
http://www.esa.int/Our_Activities/Observing_the_Earth/ESA_s_sharp_eyes_on_coastal_waters
http://www.esa.int/Our_Activities/Observing_the_Earth/New_ESA_project_supports_aquaculture
http://ocean.si.edu/gulf-oil-spill
http://www.nasa.gov/topics/earth/features/oil-spill-video.html
http://www.nasa.gov/topics/earth/features/oilspill/index.html
