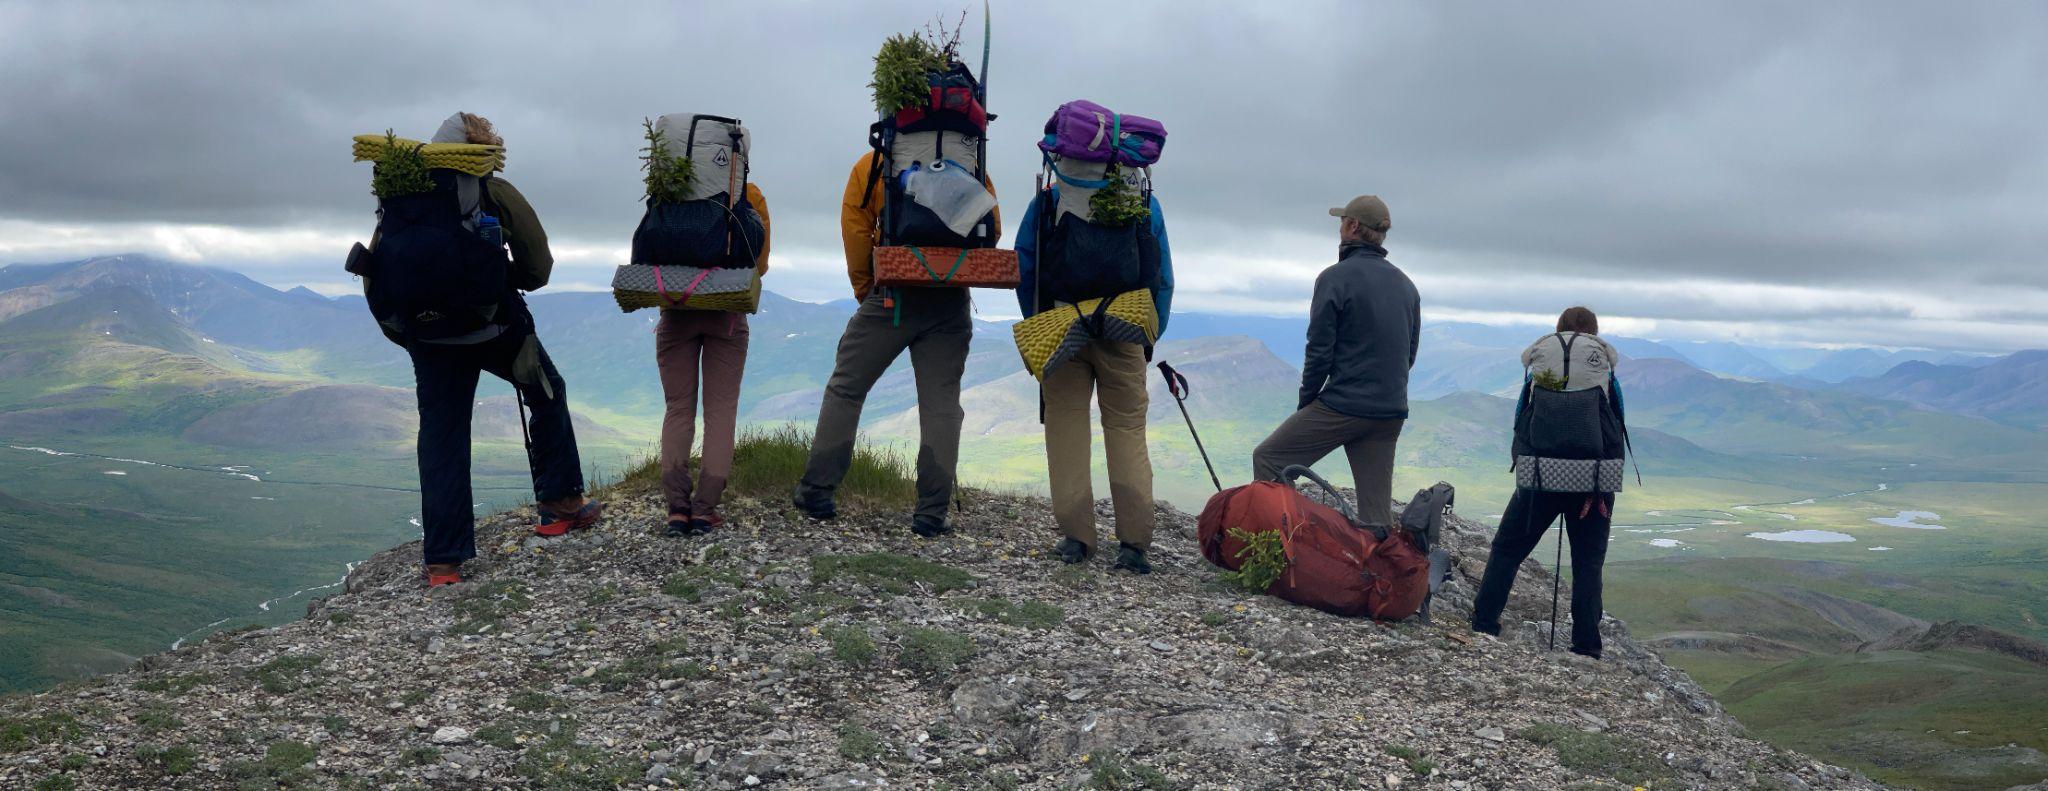
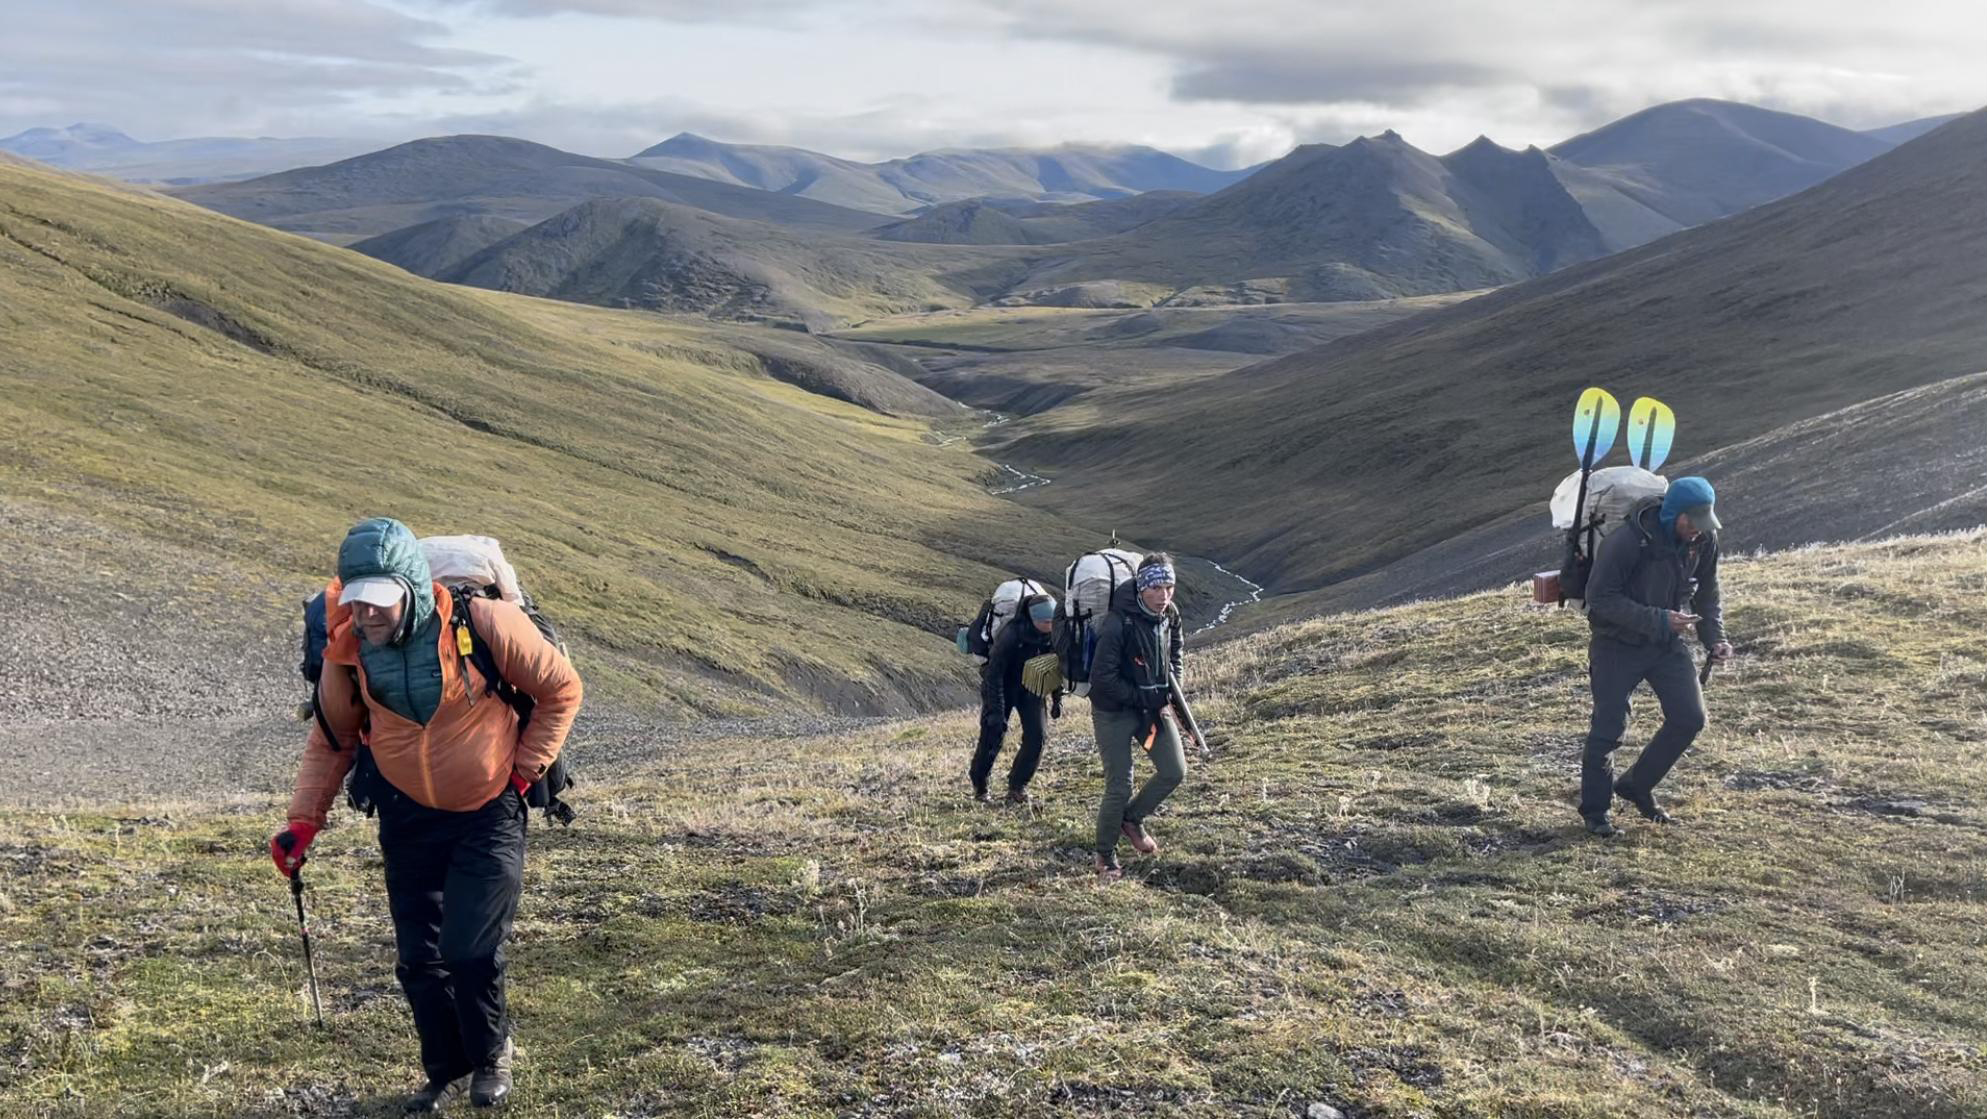
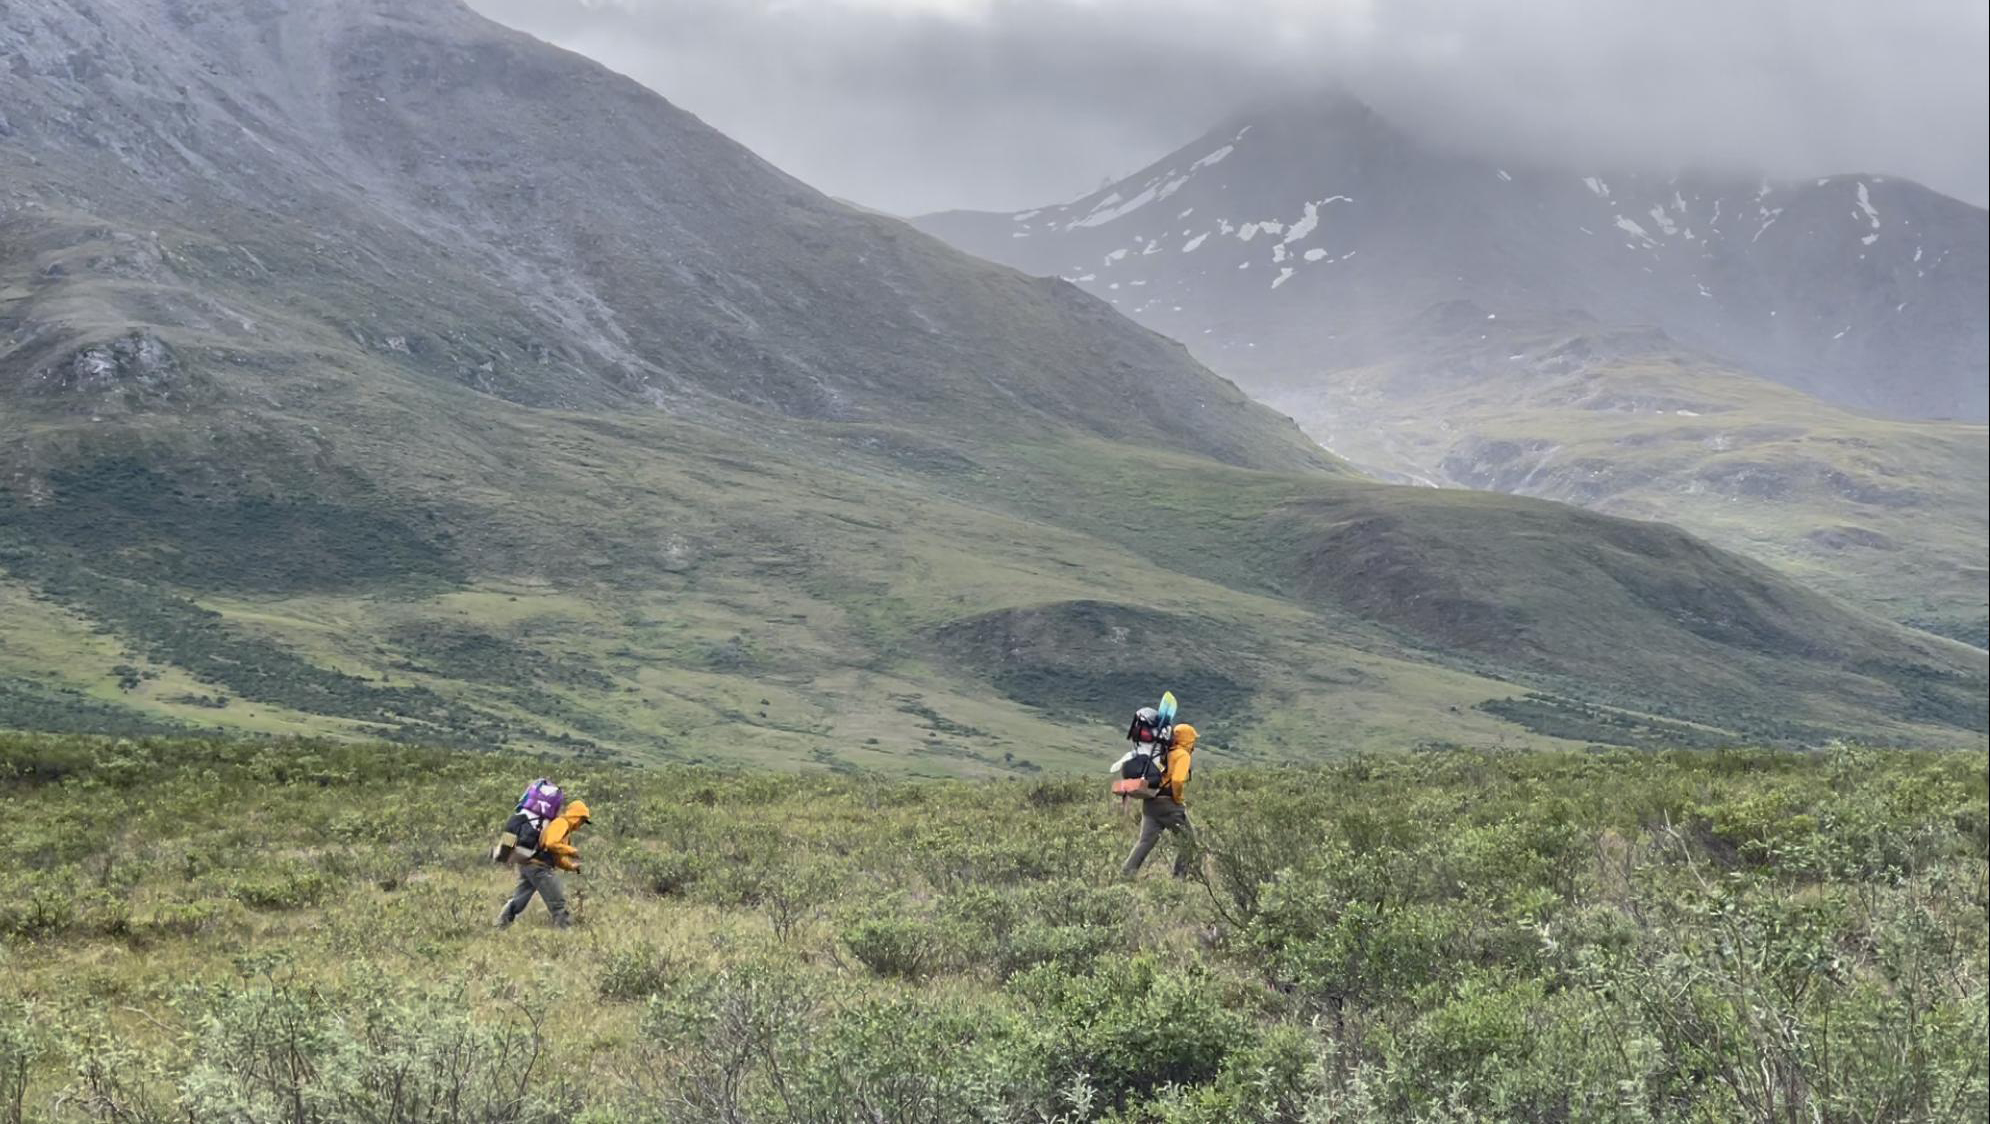
Following caribou and brown bear trails when possible, a small NASA-supported research team trekked 800 miles across Alaska’s Brooks Range last summer. With additional support from NSF, the Alaska Space Grant Program, and the Explorers Club/Discover, the research team is collecting extensive ecological field data that will be linked with satellite observations to better understand long-term changes in vegetation, including impacts of climate warming. The Arctic is warming nearly twice as rapidly as the rest of the planet and the impacts are becoming increasingly evident as glaciers melt, permafrost thaws, and tundra greens.
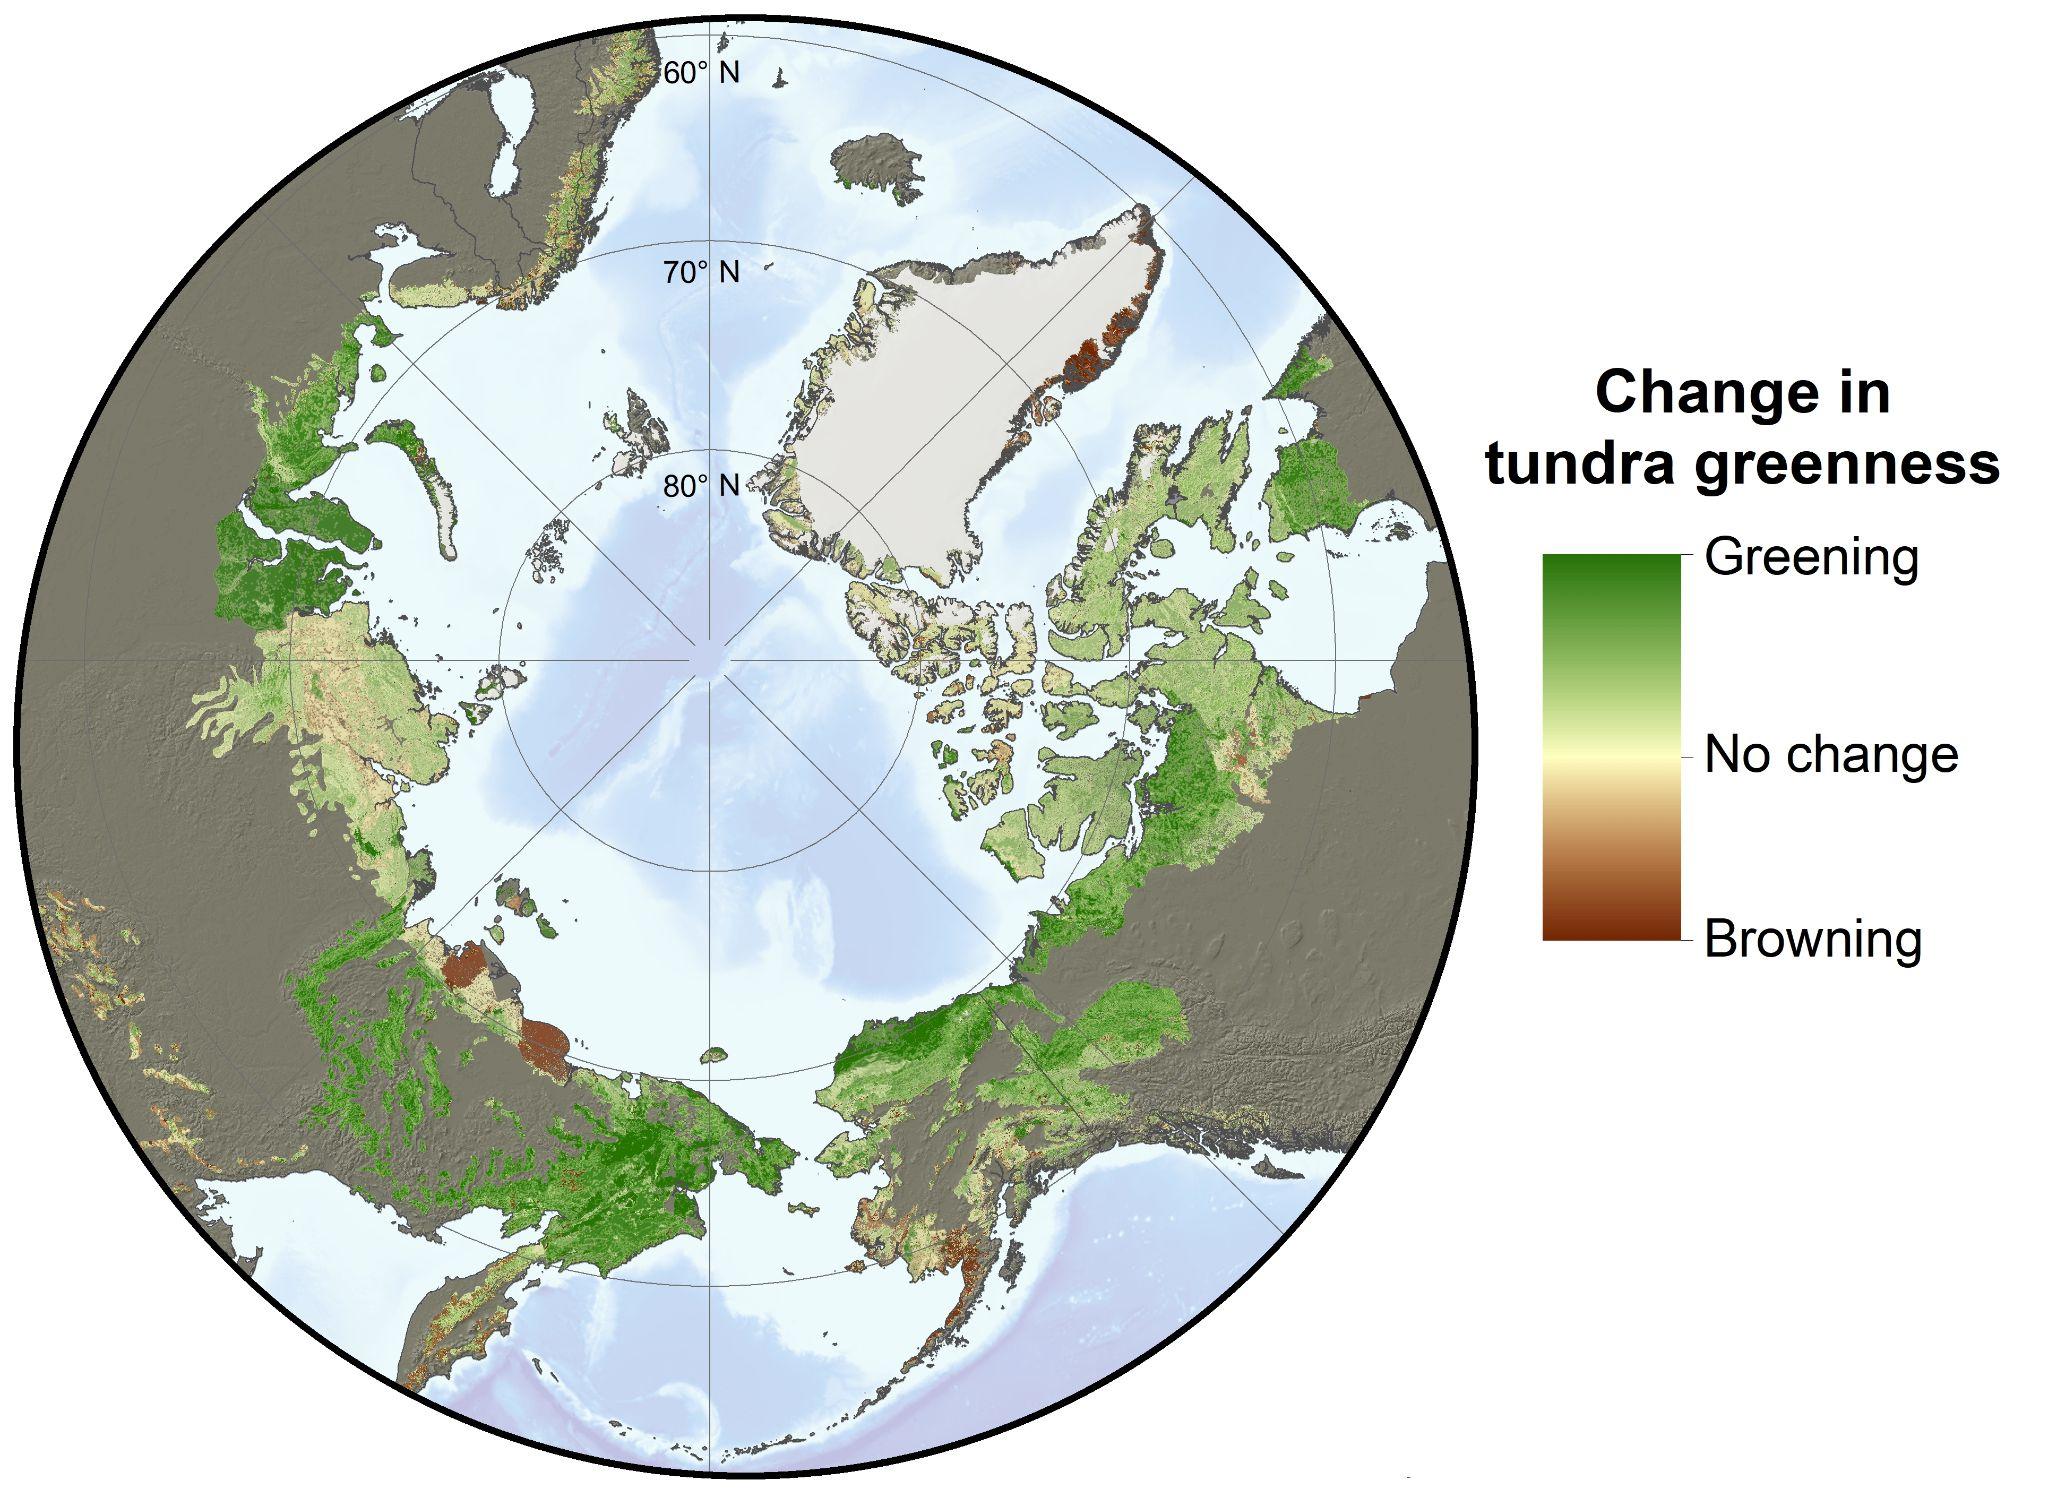
Earth-observing satellites have detected widespread increases in tundra greenness in the Arctic over the last four decades. The phenomena is caused, in part, by increases in vegetation growth as summers have become warmer and longer, and has been termed “Arctic greening.” On the other hand, satellite observations have also detected localized declines in tundra greenness attributed to surface flooding, extreme weather, and other disturbances. This has been termed “Arctic browning.” Satellite observations of greening and browning show that extensive changes are occurring in the Arctic, but much remains unclear about why specific regions have greened or browned in recent decades.
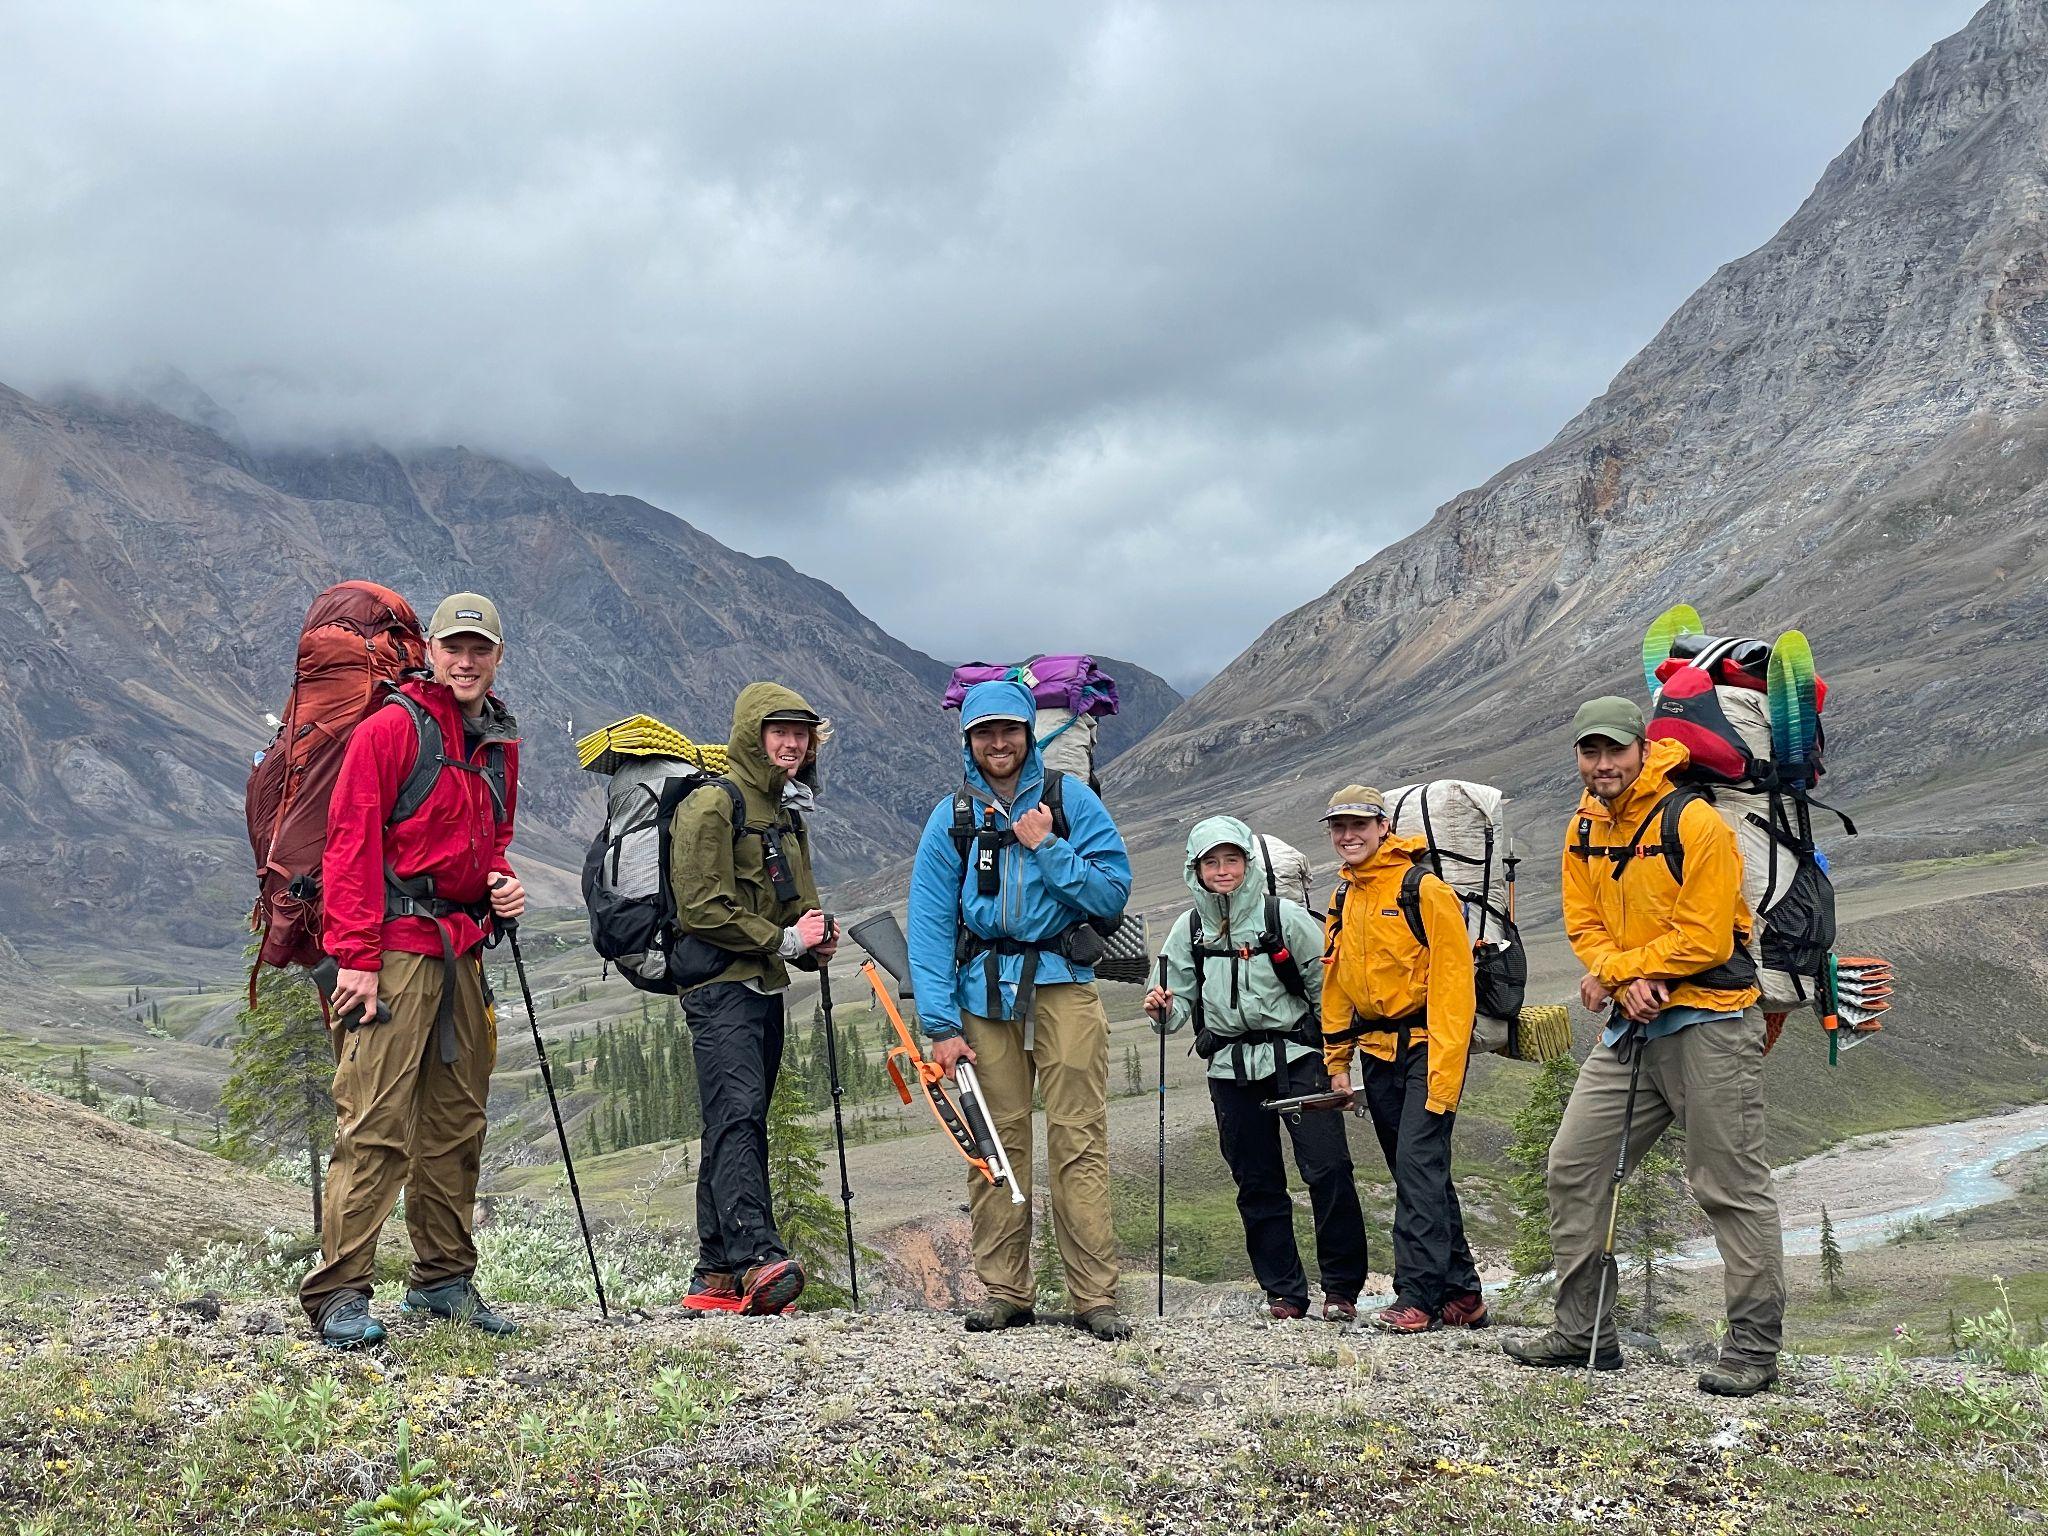
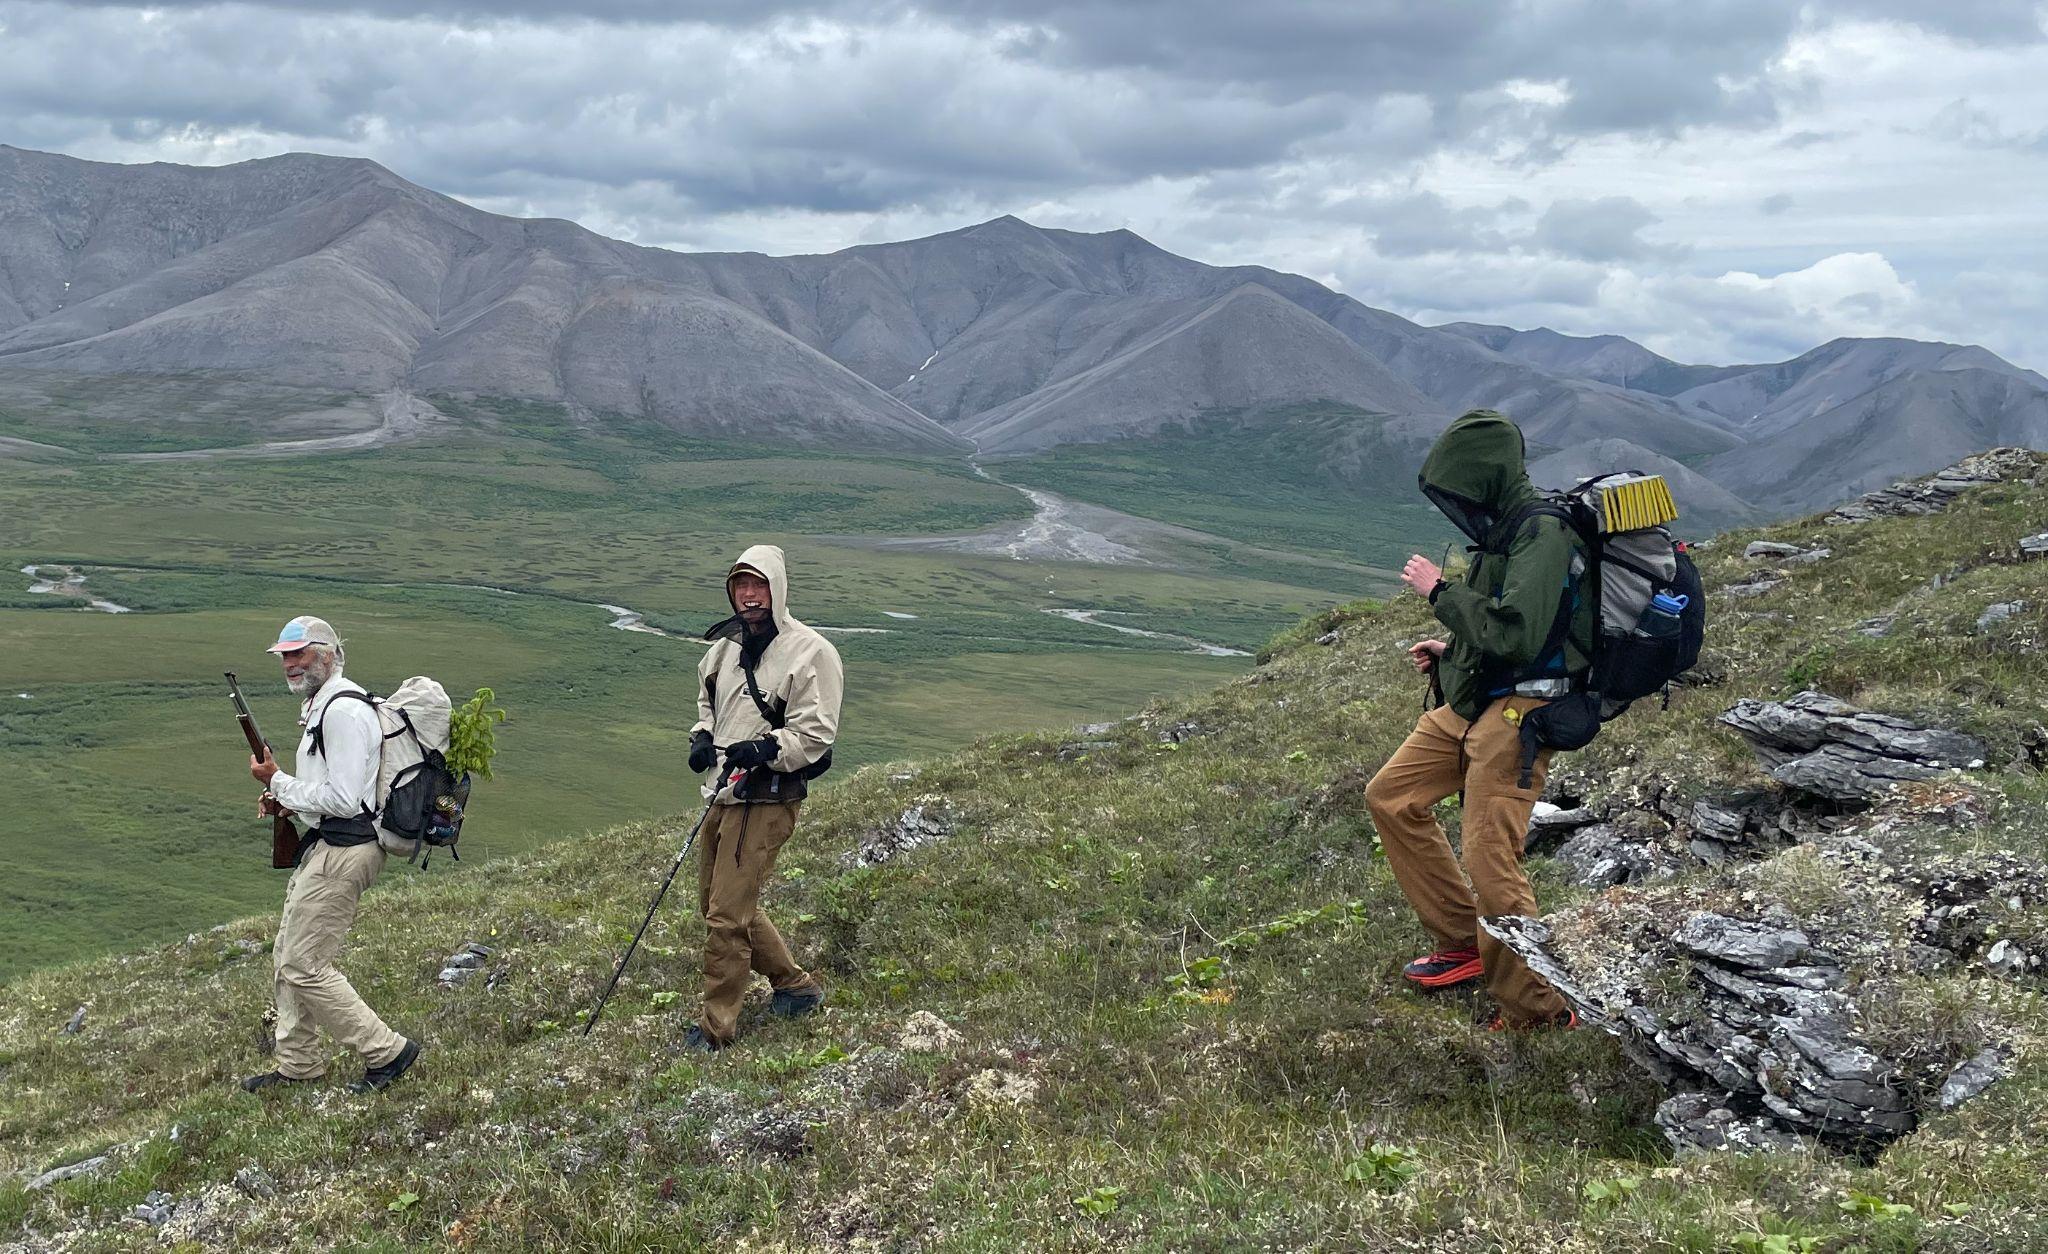
To better understand recent greening and browning in northern Alaska, Professor Roman Dial’s team from Alaska Pacific University (APU) has been collecting extensive ecological observations while trekking throughout Alaska’s Brooks Range. For nearly forty years, Dial has studied and traversed the Alaskan wilderness, including nearly 2,000 miles by foot and packraft throughout the Brooks Range during the last three field seasons. For 11 days last summer, Dial’s team was joined by Dr. Logan Berner and Patrick Burns who are research ecologists from Northern Arizona University (NAU) and members of NASA’s Arctic-Boreal Vulnerability Experiment (ABoVE). While Dial is an expert in field ecology and wilderness travel, Berner and Burns are experts in satellite remote sensing and ecological informatics. By combining their expertise, these researchers hope to shed light on the extent, nature, and causes of vegetation changes during recent decades in the Brooks Range.
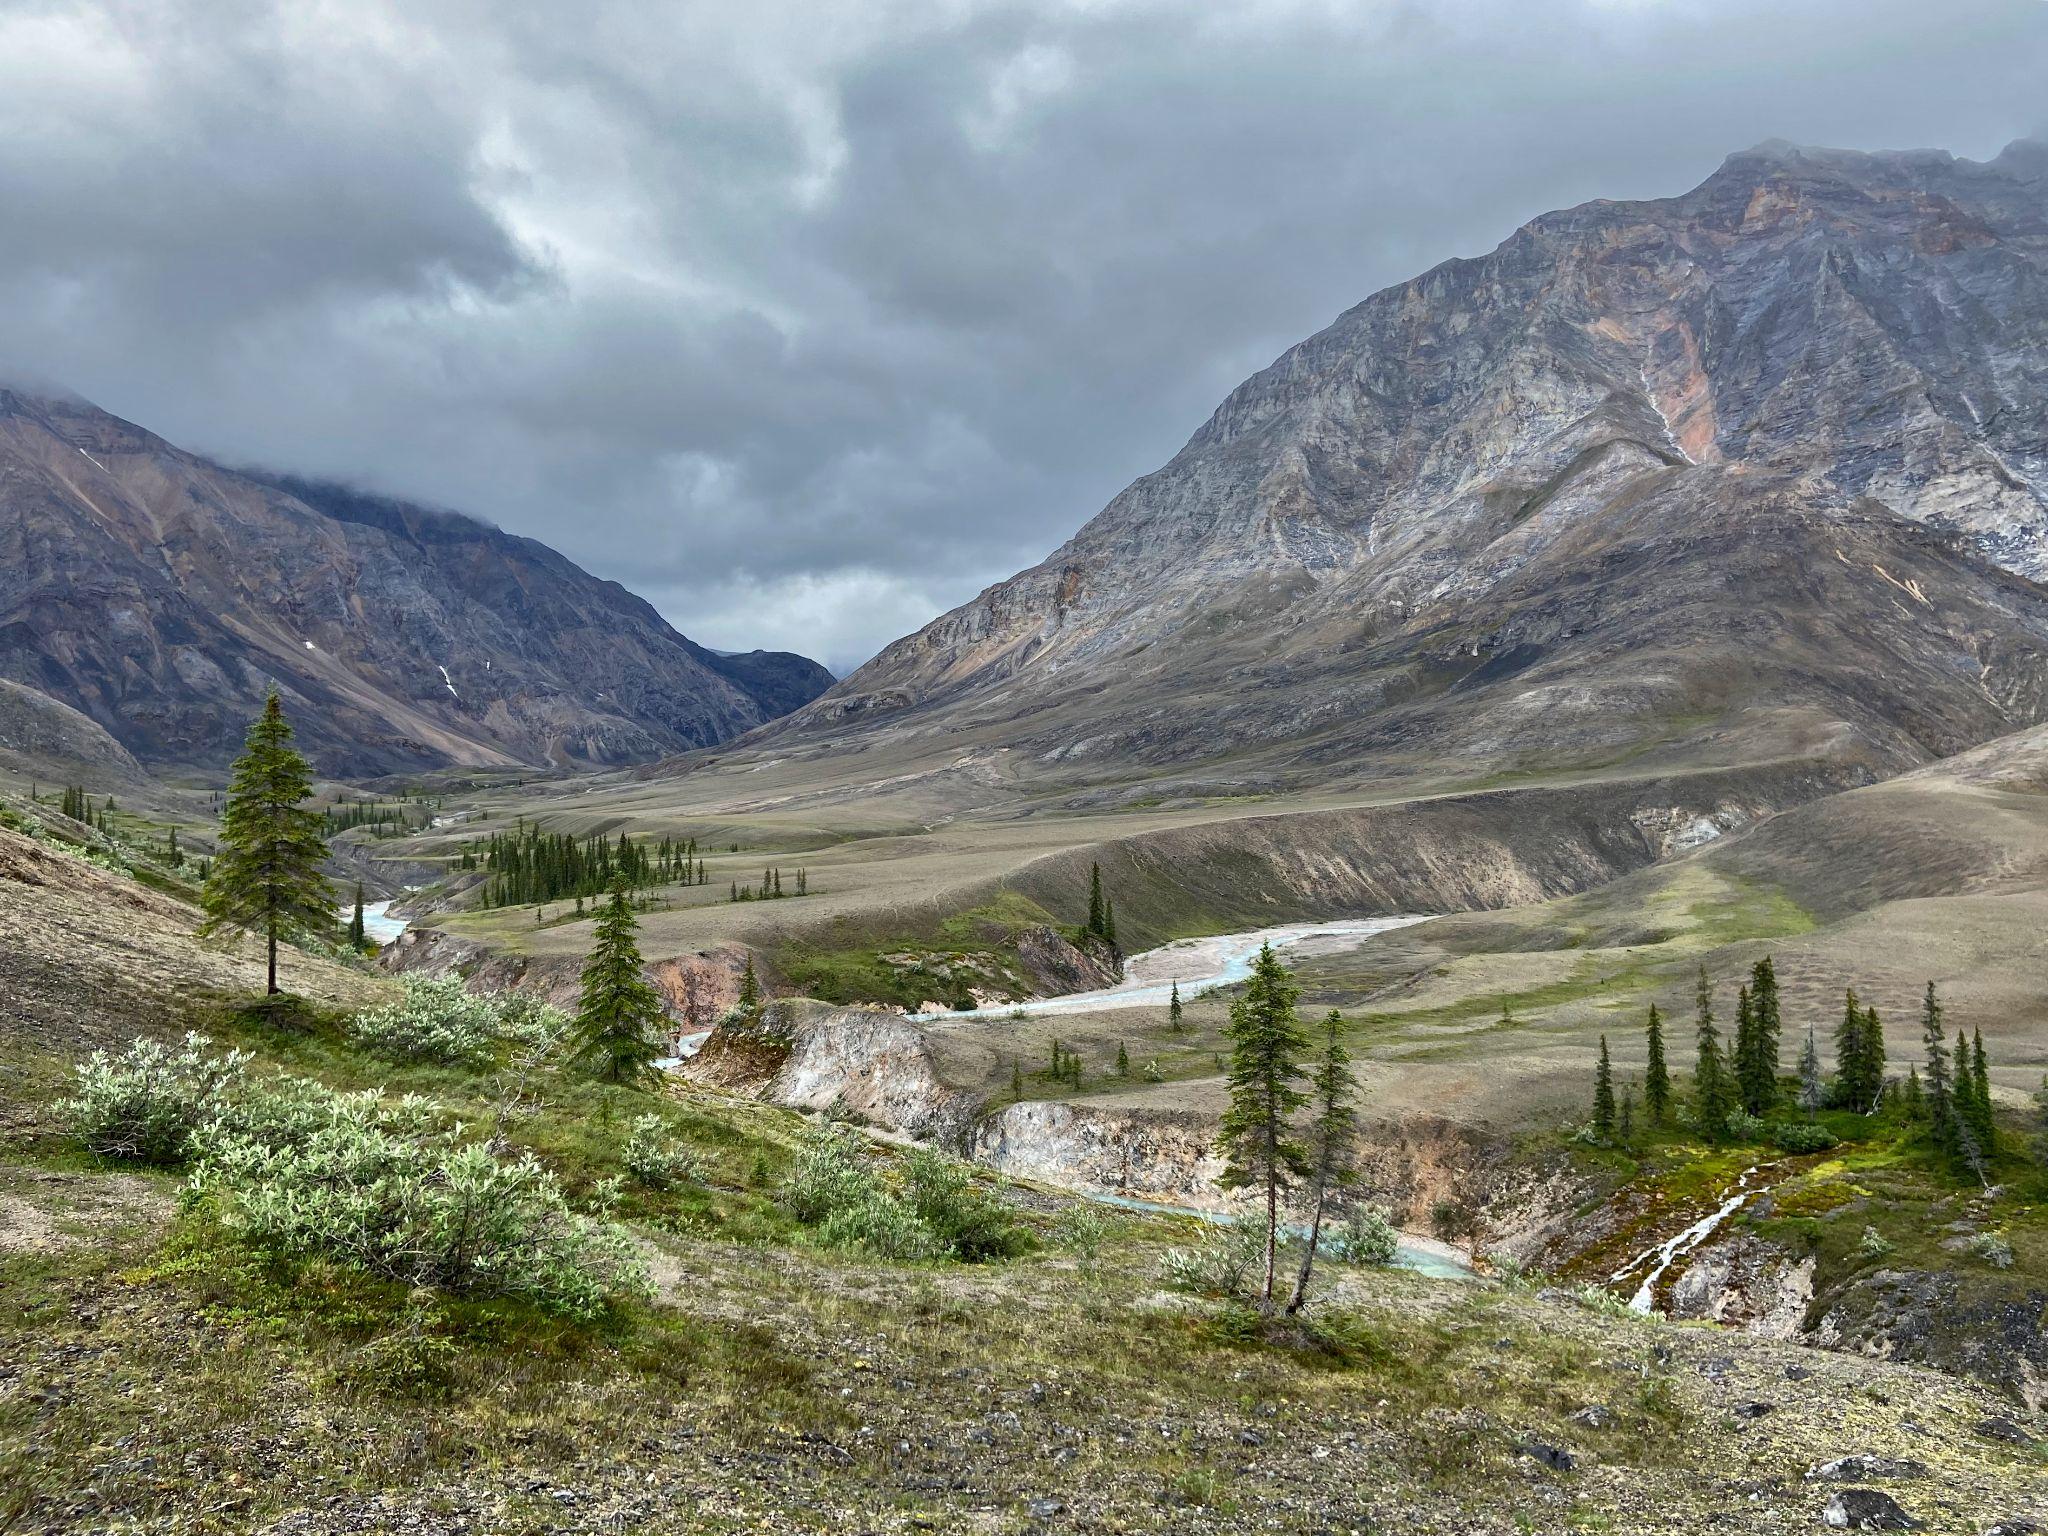
The Brooks Range forms a natural barrier that separates the boreal forest of Alaska’s interior from the arctic tundra of Alaska’s North Slope. This mountain range includes the largest complex of protected wilderness in the United States, including 21,000,000 acres among the Arctic National Wildlife Refuge, Noatak National Preserve, and Gates of the Arctic National Park. Berner and Burns joined Dial’s research team as they trekked from the northern edge of boreal forest into the Noatak Wilderness where trees give way to thickets of shrubs, wetlands, and barren rocky ridges. During the course of 11 rain-soaked days, the team followed caribou and brown bear trails through verdant valley bottoms and over cloud-choked mountain passes as they traversed about 80 miles from the Ambler River to the Cutler River. While trekking, the researchers collected ecological field data to be linked with measurements of vegetation greenness from NASA Earth-observing satellites.
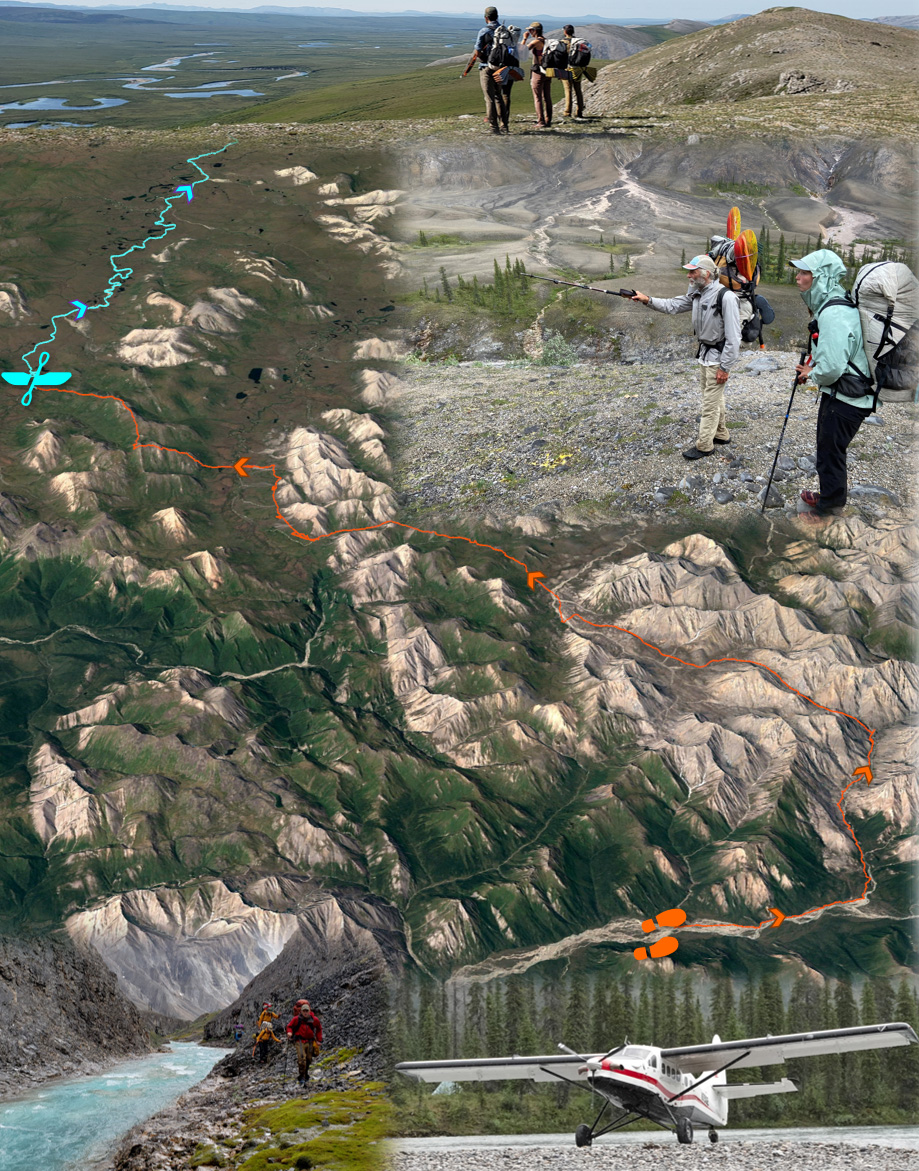
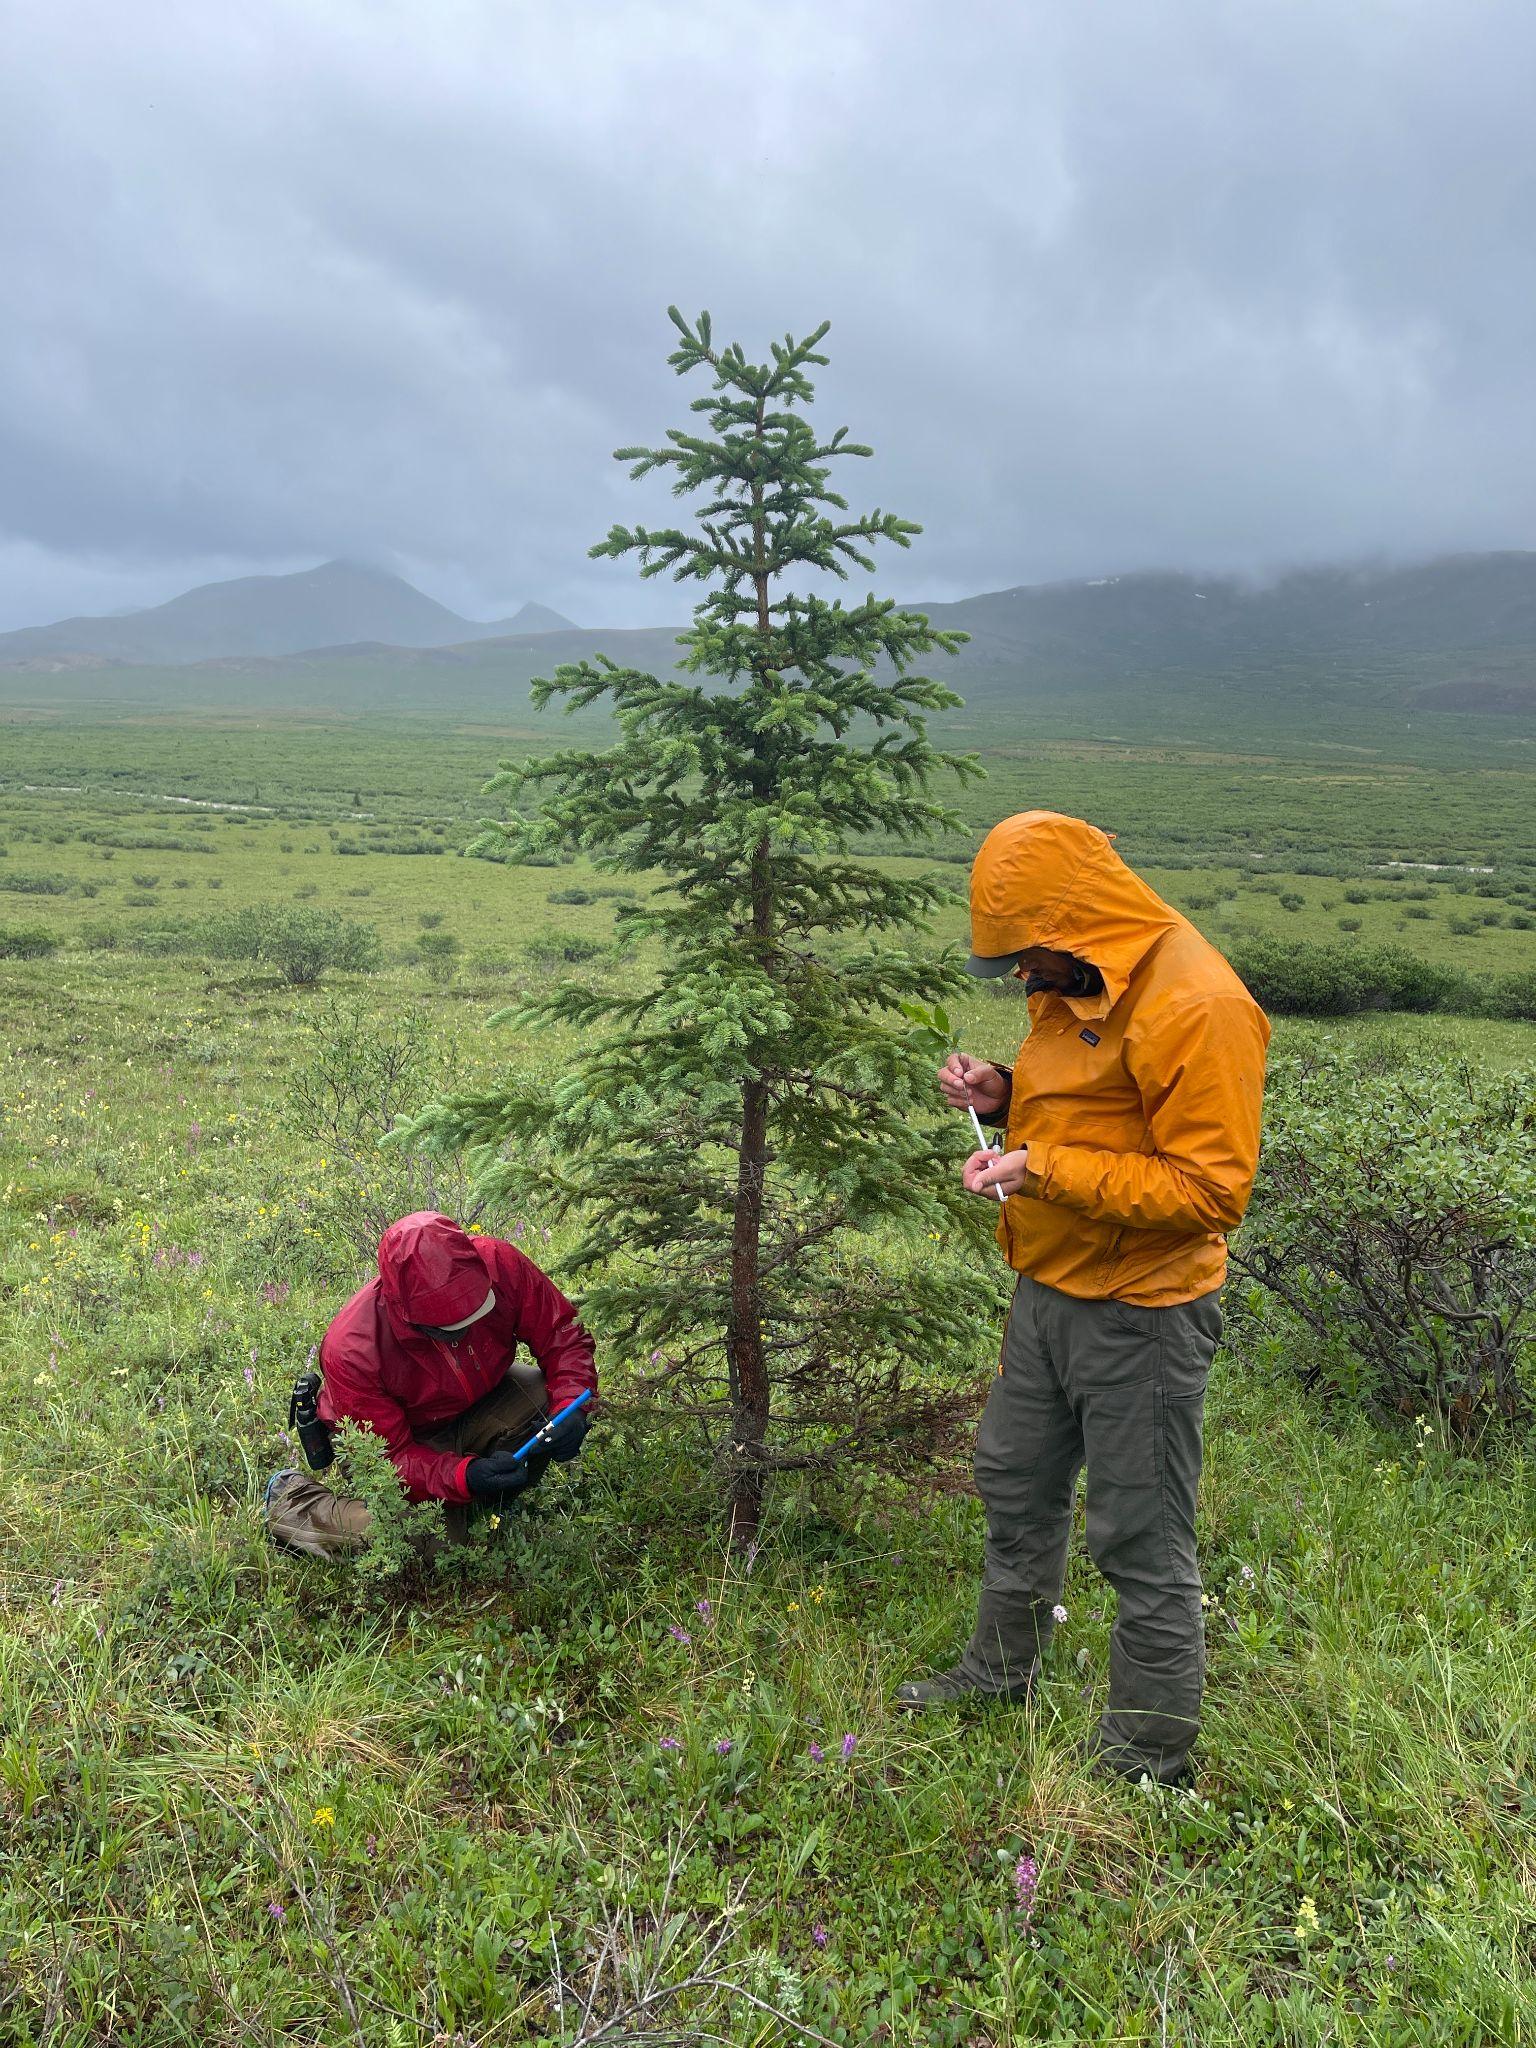
Ecological research often involves establishing field plots and then meticulously characterizing the composition and other attributes of the plant community in each field plot. Plot sampling provides valuable information, but the time consuming nature of the approach limits the spatial extent over which measurements can be made. Dial recognized that to better understand recent greening and browning, there is a need for more spatially extensive information on plant community composition than can be provided by field plots alone. He thus has pioneered an alternative approach that involves continuously documenting plant community composition and other attributes while trekking across the landscape. Termed “pixel-walking”, this approach harnesses the multifunctionality of smartphones to record and geolocate visual observations of vegetation composition and density for the overstory, midstory, and understory. While pixel-walking, researchers record a new observation every time they visually detect a change in vegetation composition or density at about a 30 meter spatial scale, corresponding to one pixel from the Landsat satellites. These spatially extensive field observations are thus collected with the explicit goal of being linked to decades of Landsat satellite observations.
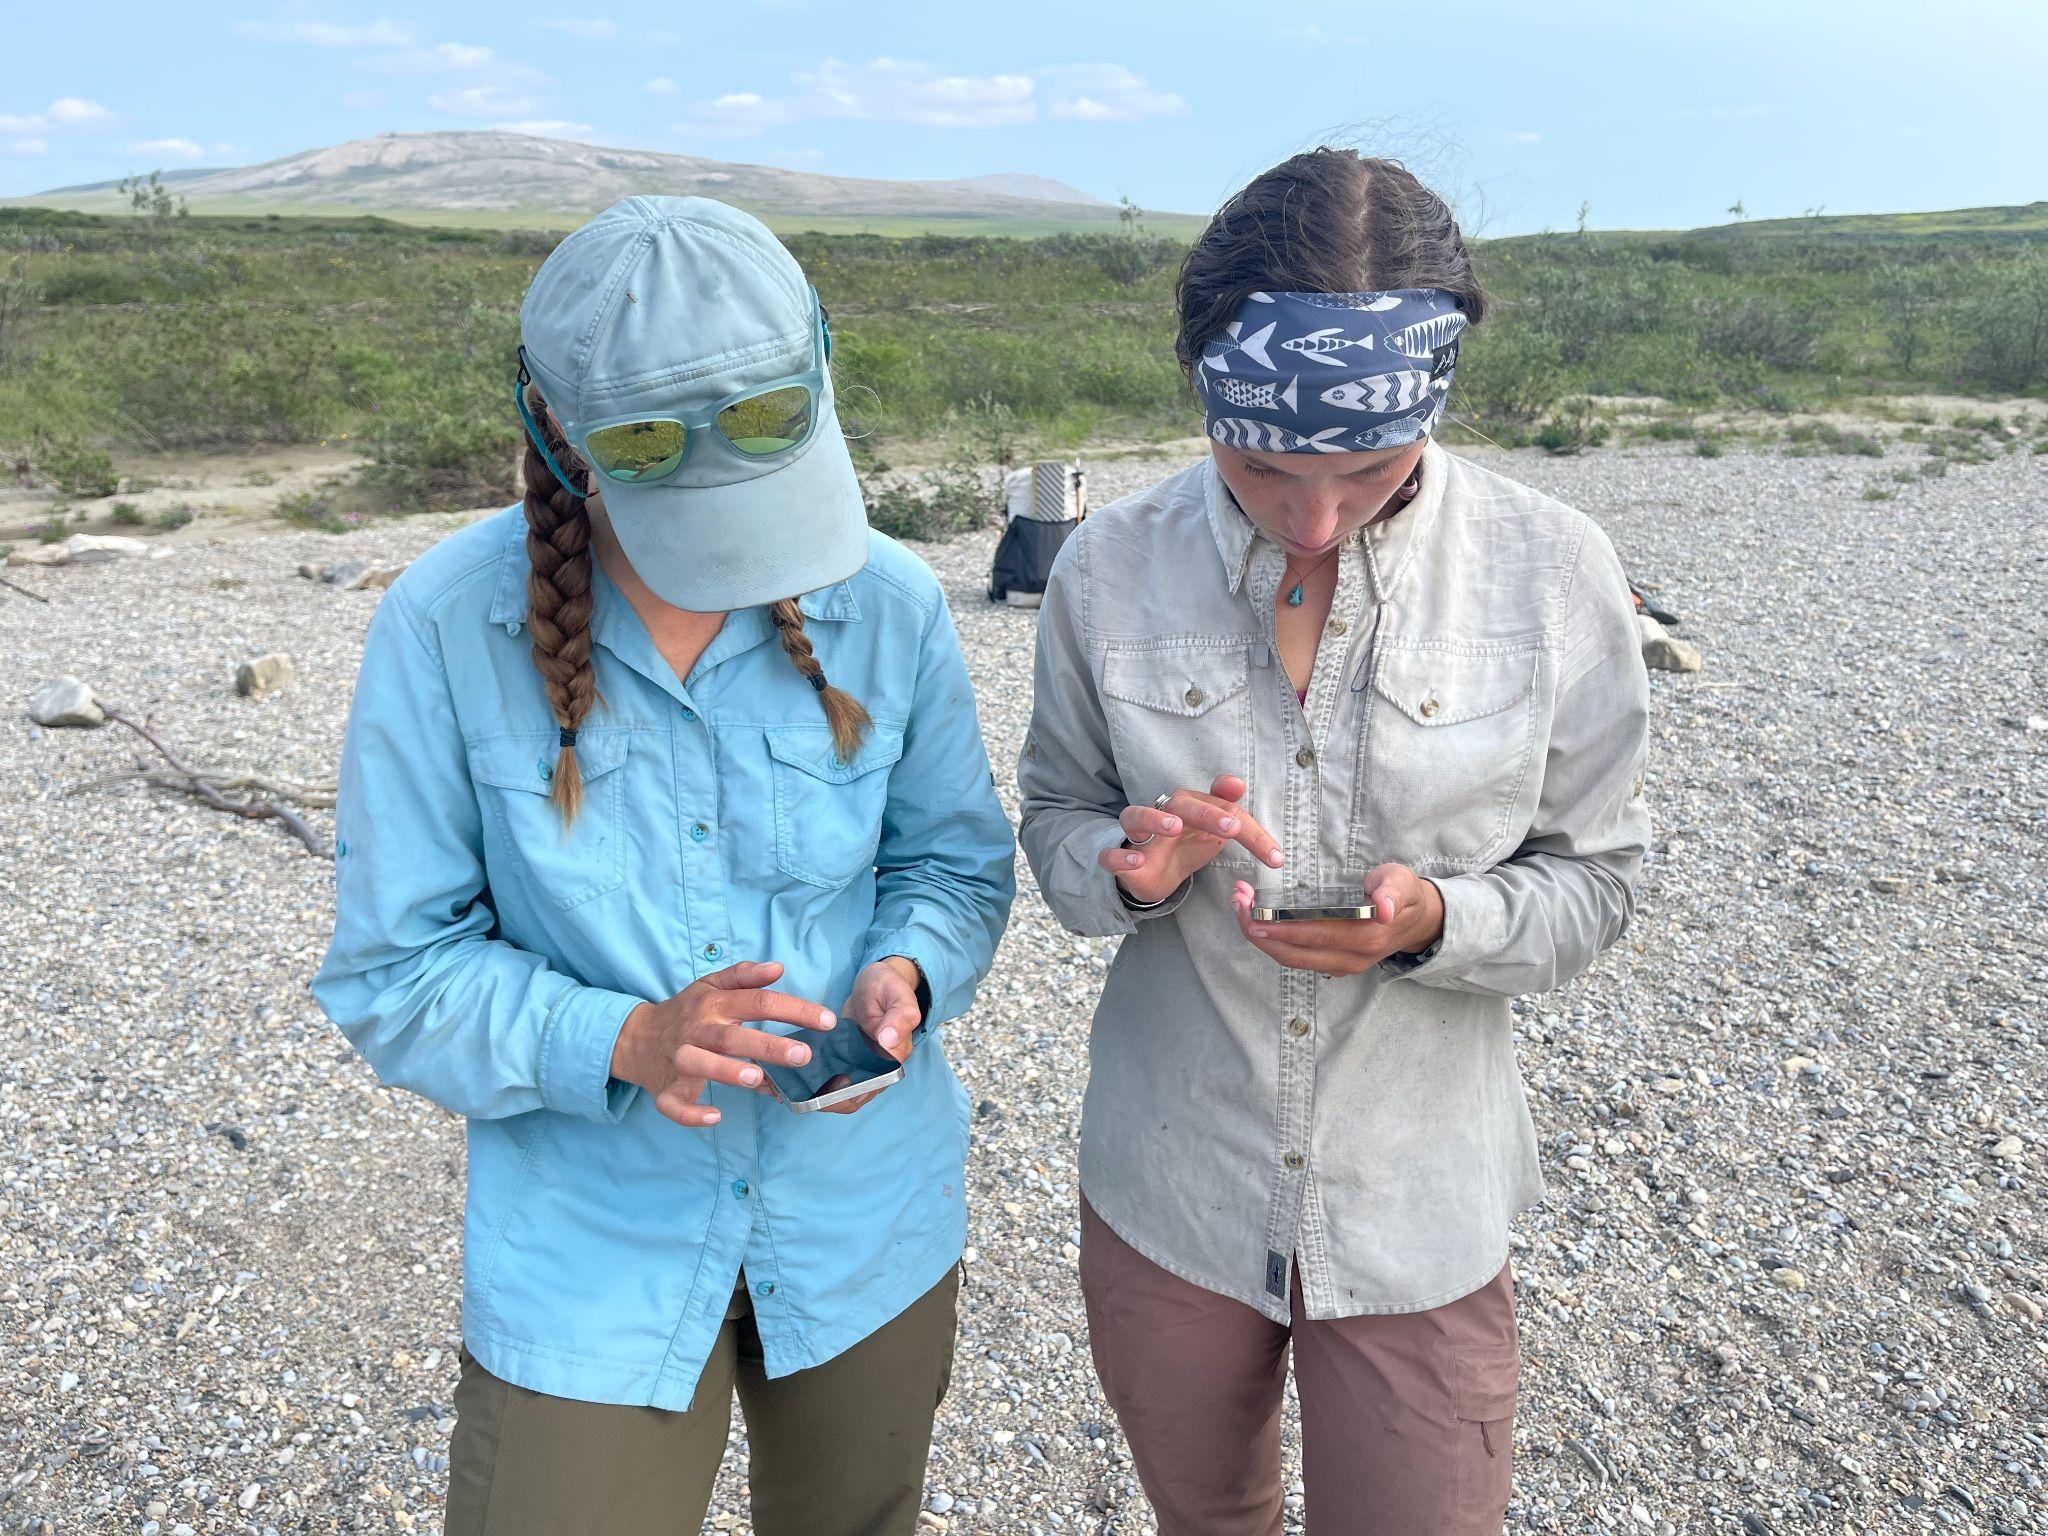
During summer 2021, Dial’s research team pixel-walked over 800 miles from east to west through the Brooks Range, collecting data on vegetation composition for about 100,000 Landsat pixels. Over the coming year, Dial’s team will work with Berner, Burns, and Professor Scott Goetz (ABoVE Science Team Lead) at NAU to link these extensive field data with several decades of Landsat satellite observations provided by NASA. This collaboration will help unravel the mysteries of Arctic greening and browning by shedding light on where, how, and why plant communities changed in recent decades. NASA’s Earth-observing satellites provide long-term observations that are crucial for monitoring and understanding ongoing environmental changes in the rapidly-warming Arctic, especially when complemented by field data collected across large regions.
“Landsat 9 provides a critical extension of the Landsat data record for monitoring our food supplies and helping to inform and address crucial decisions in how we manage, grow and adapt our food production sustainably under a warming climate, with an increasing population and growing demand for food.”
– Chris Justice, NASA Harvest Chief Scientist, Program Scientist for NASA’s Land Cover Land Use Change (LCLUC) Program, Land Discipline Leader for the NASA Moderate Imaging Spectroradiometer (MODIS) and the Soumi-NPP VIIRS Science Team, co-chair of the GEOGLAM Initiative.
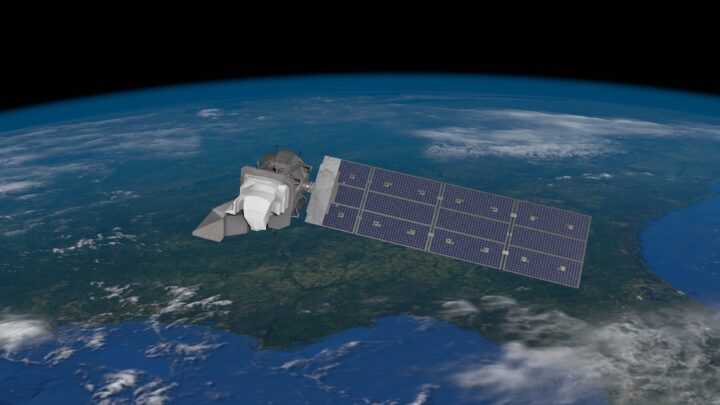
The next generation of Earth observation satellites is scheduled to launch in just a few short days. The ninth sensor in the NASA/USGS Landsat program will continue the mission’s critical work in monitoring how the surface of the Earth has changed in the near-50 years since the first Landsat satellite was launched. Landsat has enabled a number of applications in diverse fields including forest management, fire, and climate. The system has also found extensive use in monitoring global agriculture and food security applications.
Landsat revolutionized what it means to monitor agriculture, analyze crop conditions and estimate crop yields. Provided by advancements in satellite imagery and technology, the ability to remotely monitor crops over large areas and in difficult to access places on a regular basis has lowered on-the-ground labor requirements while simultaneously increasing the amount of analysis that can be performed. Advancements in spatial and temporal resolution, or how “zoomed in” and frequently the imagery is obtained, combined with new computing capabilities have created a variety of novel applications that have completely shifted what is possible in terms of agricultural monitoring and research.
NASA’s Role in Agriculture and Food Security
The first Landsat mission launched in 1972 was designed with agricultural monitoring as a key application for the Earth observations data that would be provided by satellite imagery. These initial Landsat observations were the primary tool for developing early programs for agricultural monitoring which laid the foundation for using satellite data to monitor where and when crops are growing, to observe crop condition as the growing season progresses, and to estimate crop yields and total production from space. As advances in technology and computing capabilities have increased exponentially in the last several decades, NASA has continued to play an important role in monitoring Earth’s agrifood systems.
Recognizing the growing need for a dedicated program focused on food production and access, NASA Harvest was established in 2017 to serve as NASA’s official Agriculture and Food Security program. NASA Harvest combines Earth observation (EO) data, machine learning, and the knowledge of agricultural experts around the world to better inform agricultural decision-making at every level. NASA Harvest partners have made significant use of the Landsat program’s rich data archives in terms of advancing research in mapping crop types, monitoring agricultural conditions, estimating crop yields, and analyzing how management decisions affect productivity and market responses across agrifood systems.
Senior members of the NASA Harvest team such as Dr. Chris Justice, Dr. Matt Hansen, and Dr. Eric Vermote have been at the forefront of EO data usage and Landsat applications for several combined decades. While the first Landsat images were simply photographic products, as digital data became available in the 1970s, Dr. Justice started working on data from the first Landsat satellite (ERTS-1) and subsequent missions for land cover classification. Dr. Eric Vermote has been responsible for developing the atmospheric correction procedures for Landsat, which have been adopted by the USGS for operational use, as they moved to distributing Applications Ready Data.
Reflecting on the program, Chris Justice said “The first Landsat mission was designed with agricultural monitoring as a key application. These early Landsat observations laid the foundation for using satellite data to monitor where crops are growing; crop condition as the growing season progresses; and estimating crop yields and total production from space. Landsat allowed the USDA to develop its Cropland Data Layer program. This approach has become a gold standard among agricultural ministries for annual identification of which crops are growing in their country.
Landsat Joined By Other EO Satellites
Over the years, Landsat capability has been bolstered by other moderate resolution Earth Observation (EO) satellites from the international community, starting with the French SPOT mission in 1986. In 2014, the European Space Agency began launching its Sentinel series of satellites in close collaboration with the Landsat mission, significantly increasing the frequency of observations and adding to the amount of EO data available for research and analysis. These two programs share in the benefits of providing free and openly available medium resolution EO data to the public. As crops change and develop rapidly throughout the growing season, timely and frequent observations are critical and Landsat 9 will play an important role in increasing the frequency of observations. Between two Landsats and two sentinels, available satellite data will provide almost daily observations to observe every field across the globe.
Despite some differences in spectral and spatial resolutions, the two programs complement each other particularly well especially for agricultural applications. A recent study co-funded by NASA Harvest and co-authored by researchers of the University of Maryland’s Global Land Analysis and Discovery (GLAD) group explores how the Landsat and Sentinel satellites compare in crop classification capabilities. This research found that medium-resolution imagery from Landsat 7 and 8 performs on par with the higher spatial resolution offered by the European Space Agency’s Sentinel-1 and Sentinel-2 satellites. Specifically, both sets of satellites are able to classify corn and soybean crops with accuracies above 94% and when their imagery was combined, the team was able to reach accuracy levels of 97%.
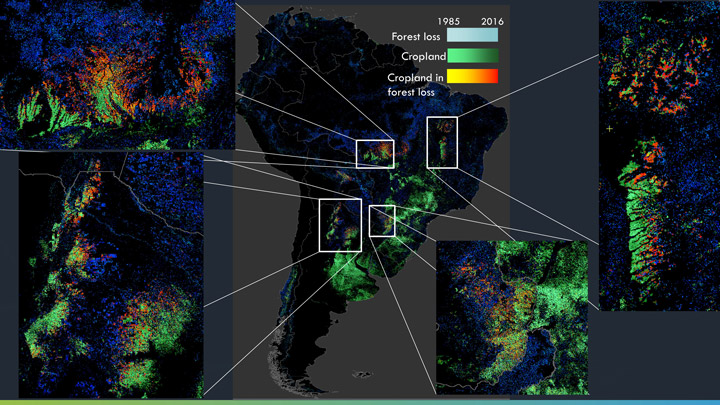
Dr. Matt Hansen has also used Landsat data and imagery to create the Global Forest Watch (GFW) product which provides an annual Landsat-based, global tree cover map allowing users to see how the global forest footprint grows and shrinks in different locales every year. Given the relationship between cropland expansion and deforestation, GFW’s annual tree cover data product allows for better analysis of how agricultural production drives forest loss.
Decades of Data Enabling Long Term Analysis
The Landsat program is especially unique and useful thanks to its longevity, providing researchers with an unmatched historical data archive. Collecting data for just under fifty years, the satellite mission has enabled longitudinal studies of agricultural change that would otherwise be impossible. One team based at Stanford’s Center on Food Security and the Environment (FSE) which includes NASA Harvest partners Dr. David Lobell, Dr. Jillian Deines, and Dr. Sherrie Wang, have demonstrated this by using Landsat imagery to greatly expand the temporal range of currently available U.S. crop maps. The country-wide crop maps currently produced by the USDA as part of the Cropland Data Layer (CDL), while very accurate, only include information on crops dating back to 2008. The FSE team makes use of the Landsat archive to bolster the existing CDL dataset and map corn and soybean production across the U.S. midwest, going all the way back to 1999.
Utilizing even more of the Landsat historical data, this team has also explored how agricultural irrigation has changed in the U.S. midwest over more than three decades. Led by Dr. Jillian Deines, FSE was able to create an annual series of maps showing irrigated cropland within the High Plains Aquifer in the Central United States from 1984 to 2017. This time series of irrigated maps proves vital in understanding how irrigated agriculture is changing in one of the most agriculturally productive regions on the planet, as well as building a strong base for further research into how water conservation can preserve natural aquifers while also increasing farmer profits.
Enabling New Landsat Applications
Landsat 9 provides a critical extension of this 50 year data record for monitoring our food supplies and helping to inform and address crucial decisions in how we manage, grow and adapt our food production sustainably under a warming climate and with an increasing population. Whether it is informing farmer decisions on management practices that support soil health, supporting transparent and stable agricultural commodity markets, providing early warning of impending crop shortfalls, supporting more efficient and effective agricultural insurance schemes, or tracking agricultural expansion, the Landsat program has had an enormous impact on how we understand farming and food security since its inception. With the launch of Landsat 9, new applications can be developed and the legacy of Earth observations for informed decision making continues on.
Visit Landsat Science to learn more about the Landsat program and the upcoming launch.
