In loving memory of Larry Corp.
Goddard’s LiDAR, Hyperspectral, & Thermal Imager (G-LiHT) is an airborne instrument designed to map the composition of forested landscapes.
The G-LiHT instrument has a number of sensors that each serve a specific purpose. There are two LiDAR sensors that produce a series of LiDAR-derived forest structure metrics including a canopy height model, surface model, and digital terrain model. These models allow us to measure tree height and biomass volume.
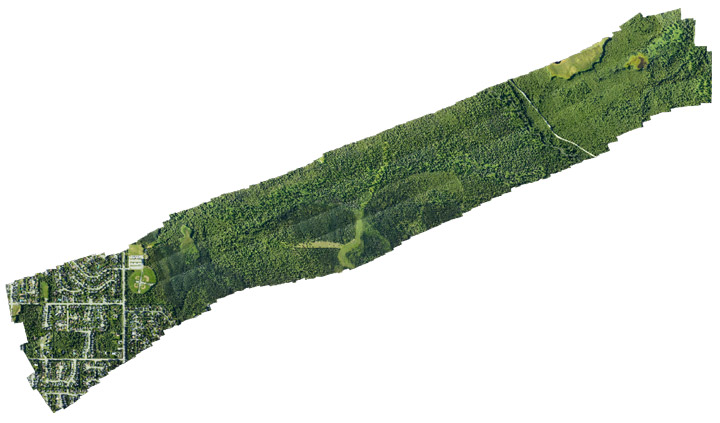
Additionally, there are two cameras: one visible and one near-infrared (NIR). The visible and NIR bands acquired by the two cameras are paired to produce 4-band imagery. The 3-centimeter resolution photos taken by these cameras are aligned to build orthomosaics, which allow us to visually observe and identify changes in forest composition.
G-LiHT also has a hyperspectral sensor to acquire spectral information at a coarser resolution. These data can be used to identify vegetation composition and measure photosynthetic function as well as calculate vegetation indices at a fine spectral scale of 1 meter using radiometrically calibrated surface reflectance data.
The thermal sensor measures radiant surface temperature which allows us to create 3D temperature profiles derived from structure-for-motion. Thermal data provides us with information on the functional aspects of forest canopies. As photosynthetic function is related to evapotranspiration, we can observe that hotter canopies are more stressed relative to surrounding canopies.
The G-LiHT airborne mission supports multiple groups including the U.S. Forest Service (USFS), the USFS Geospatial Technology and Applications Center (GTAC), and the University of Alaska Anchorage.
The USFS is creating a forest inventory for the state of Alaska, and G-LiHT measurements collected over Forest Inventory and Analysis (FIA) plots are a cost-effective method of forest inventory. G-LiHT data will also help to improve regional estimates of aboveground forest biomass and terrestrial ecosystem carbon stocks. GTAC uses G-LiHT data measurements for algorithm development. USFS Geospatial Technology and Applications Center will use G-LiHT data acquired over FIA- and GTAC-measured ground plots and between these plots to map forest characteristics on federally managed lands, including forest type, biomass, vegetation structure, tree and shrub cover, and more. Data will also be used to guide future inventory efforts in coastal Alaska using methods developed for interior Alaska.
This field campaign also acquired repeat data over Fairbanks, Alaska, to measure changes in permafrost.
G-LiHT image data was reacquired over spruce beetle monitoring transects stretching from the Kenai Peninsula in the south to Denali National Park in the north. These transects were last measured on the ground and with G-LiHT in 2018, during the peak of a spruce beetle outbreak, and changes in vegetation structure and spectral reflectance will be used to evaluate the long-term mortality and growth of these forests.
Our Alaskan field campaign started with an integrative test flight in June. Our team of three loaded up G-LiHT into a vehicle much too small and drove to Dynamic Aviation in Bridgewater, Virginia. We spent the first day installing the instrument into a 1960s King Air A90.

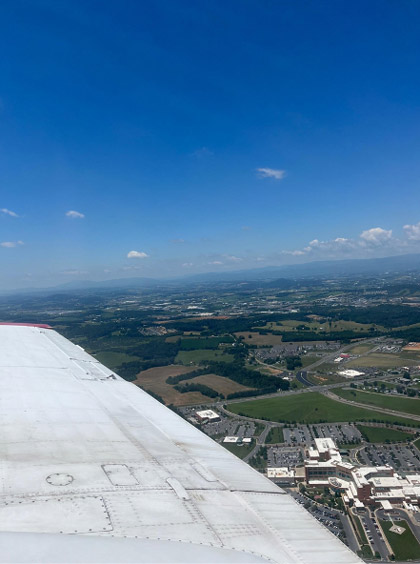
The second day was all about flying. We needed to make sure G-LiHT didn’t interfere with any of the aircraft’s systems. Additionally, the functional test flight over Harrisonburg, Virginia, allowed us to verify that G-LiHT was functioning properly. We flew in a grid pattern over the city which allowed us to geospatially align the data products from all of G-LiHT’s sensors.
The integrative test flight was a success. We installed G-LiHT properly with no issues and obtained the information we needed. Once we received the thumbs up to proceed with our campaign, the pilots loaded up the plane with supplies and headed out to Kodiak, where we would meet them the following week.
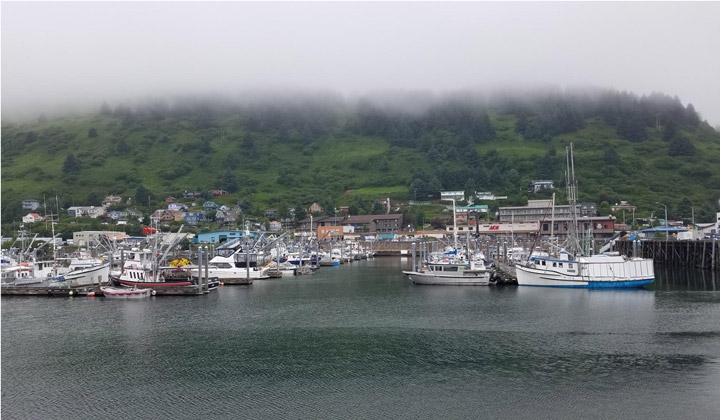
Our plan for the field campaign was to arrive in Kodiak, Alaska on July 6 and stay until the end of the month. We chose Kodiak as our hub because it was a convenient location to our flight lines. Unfortunately, despite the ideal location, poor weather prevented us from flying for the first three days of the campaign.
Once we were finally able to get in the air, we collected data over the forests near Iliamna.
Most of our days consisted of our team meeting in the hotel for breakfast at 8 a.m., discussing weather and flight plans for the day, and then driving to the airport to prepare the plane and G-LiHT for flying. Depending on how many flight lines we were able to complete, we often stopped in King Salmon or Iliamna to refuel the plane and then went back out to fly more lines before returning to Kodiak.
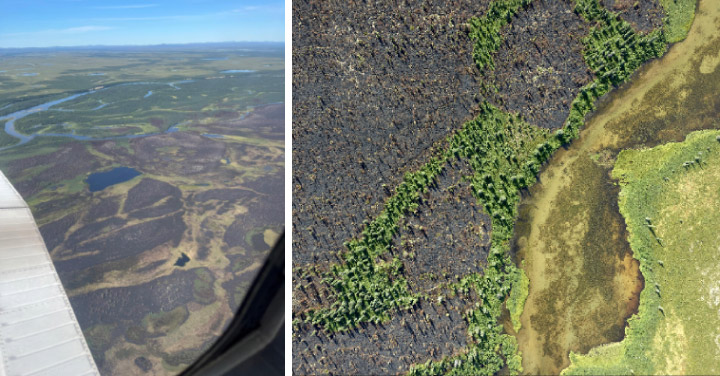
Our group was interested in measuring the effects of forest fires on vegetation in the Dillingham region. There were several burned areas to the west of the Nuyakuk River and east of Cook Inlet.
Toward the end of the campaign, we decided to transit to Fairbanks because the weather over the rest of our other flight lines didn’t look promising. If there were clouds below the plane at 1,100 feet, they would obstruct the instrument’s view and cast shadows on our data. We had to closely monitor the weather every morning. Additionally, we were unable to fly in rain or smoke as it would adversely affect the LiDAR sensors’ data returns.
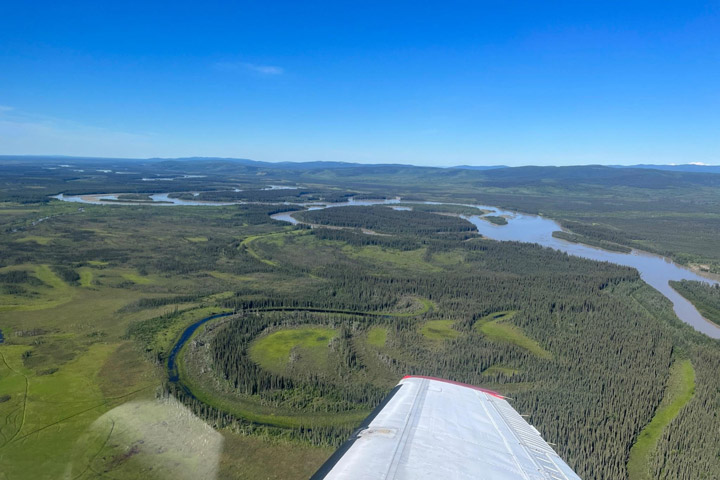
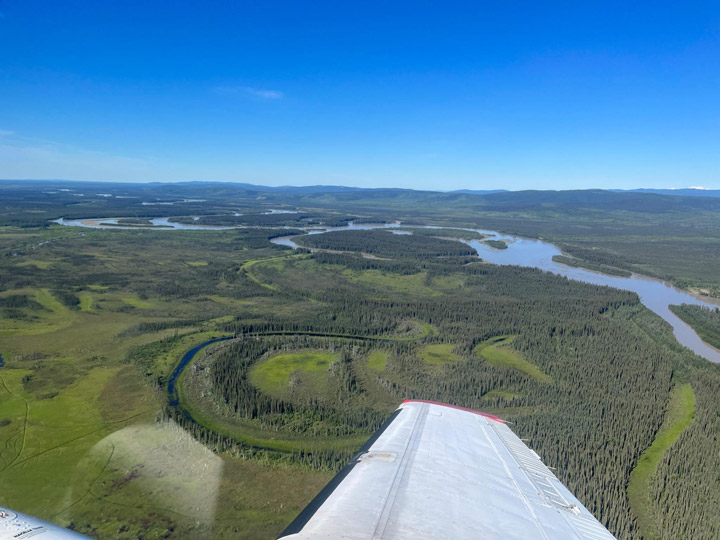
One geological feature we saw extensively in the southwest was the oxbow lake. Also called cut-off lakes, these lakes have formed when meandering rivers erode at points of inflection because of sediments flowing along them to the point where two parts of the river will join together, creating a new straight part of the river—essentially “cutting off” the curved lake piece. This created an oxbow lake. Once the lake has fully dried out, it becomes a meander scar. We noted the difference in vegetation growing back within the oxbow lakes and meander scars and how this differs from surrounding vegetation patterns.
We had only planned to spend one night in Fairbanks, then transit back to Kodiak the following day. However, the weather had other plans for us. We ended up having to fly to Anchorage the following day because of extremely low cloud ceilings in Kodiak that made it too dangerous to land there. It worked out in the end, and the team was able to see more of beautiful Alaska and collect data over Anchorage and the Chugach region. It just goes to show how quickly things can change during a field campaign.
We collected data in the Campbell Creek region west of Anchorage. The data include visible and near-infrared photos which were composited into 4-band high-resolution orthomosaics and used to visually observe and identify changes in forest composition.
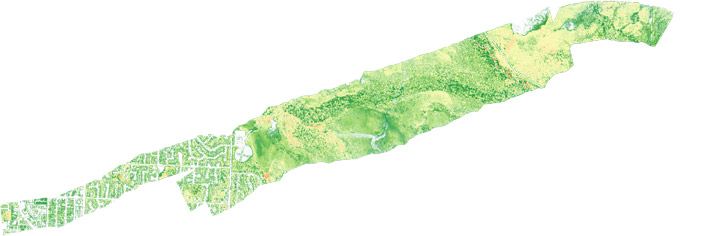
In addition to the high-resolution orthomosaics produced from the G-LiHT’s near-infrared and visible cameras, LiDAR data was processed to create various 1-meter resolution forest structure metrics including Digital Terrain Model (DTM), Digital Surface Model (DSM) and Canopy Height Model (CHM). These metrics are used to measure tree height and biomass volume. The CHM raster below was created by subtracting the DTM from the DSM.

After collecting data in Anchorage and the Chugach region of Alaska, the team flew back to Kodiak and finished data acquisition in the southwest.
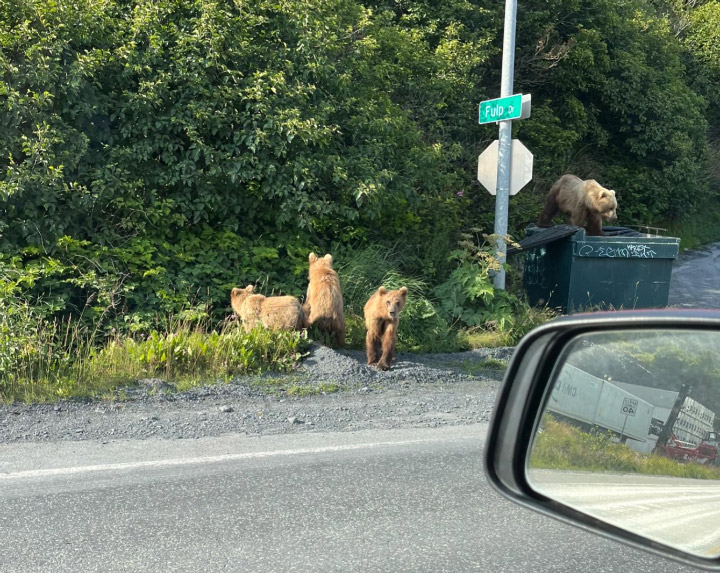
And of course it wouldn’t be Alaska without some wildlife. The day before leaving Kodiak, I got to see not just one bear—but a family of four! Cars were honking to scare the bears out of the road, but luckily I had enough time to snap a picture before the bears ran off into the woods. It was the perfect end to an exciting field campaign.
This summer a team of scientists from NASA Goddard, American University, and the Forest Service are conducting joint field work and flights with Goddard’s LiDAR, Hyperspectral, and Thermal Imager (G-LiHT) within south-central Alaska to study the ongoing spruce beetle outbreak and develop methods for early detection of beetle infestation. The spruce beetle is an aggressive bark beetle that feeds and reproduces in the inner bark of various species of spruce trees. Currently, spruce beetles are affecting over 400,000 acres in the Matanuska-Susitna Valley, resulting in widespread mortality of spruce trees. This infestation has been ramping up over the past few years in Alaska, causing concern for both scientists and Alaskans. Data collected by G-LiHT may provide the ability to detect early stages of infestation, before they would be visible in aerial surveys conducted by the Forest Service, which would allow forest managers and scientists to better predict future infestation locations and extent.
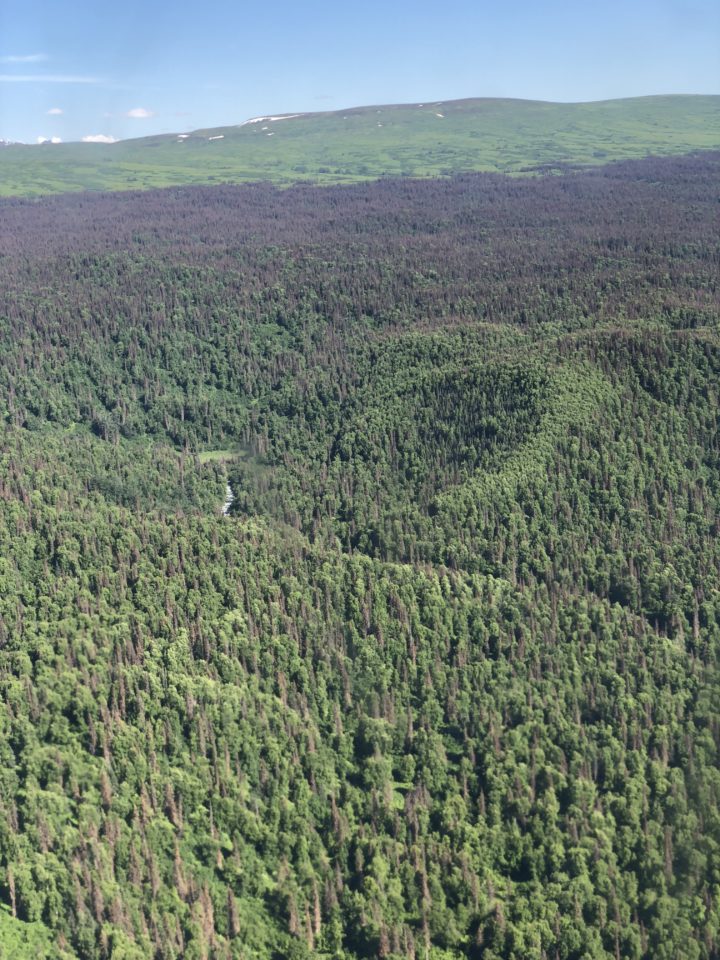
As we pass over the Susitna Valley we can see how far this outbreak has spread. The red-brown and gray trees have been infested for several years. Some of the green trees may be the early stages of spruce beetle infestation.
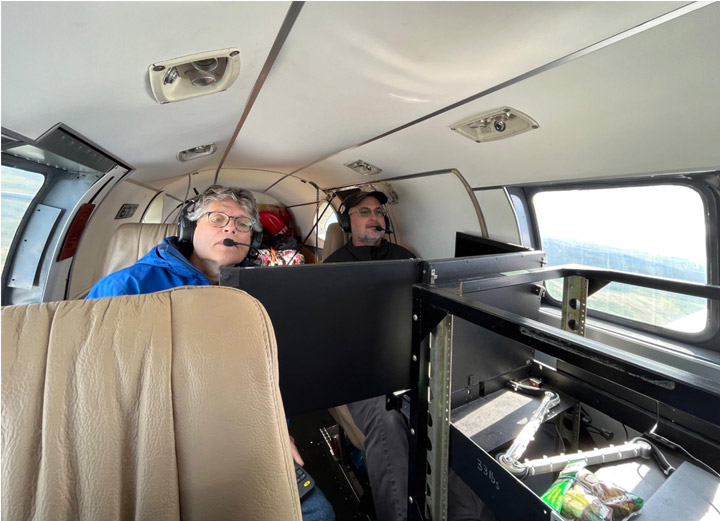
This past week we have been flying with G-LiHT and visiting areas where G-LiHT data was collected to identify and GPS trees infested with spruce beetles. The infested trees can later be located and analyzed within the collected imagery. This summer, the G-LiHT instrument is flying on a King Air A90. The pilots have to maintain an altitude of 1,100 feet for the best imagery, and this makes for quite an exciting ride over the various mountain ranges in Alaska. The swoops and dives the plane makes as it follows the terrain feel more like a roller coaster than a plane ride.
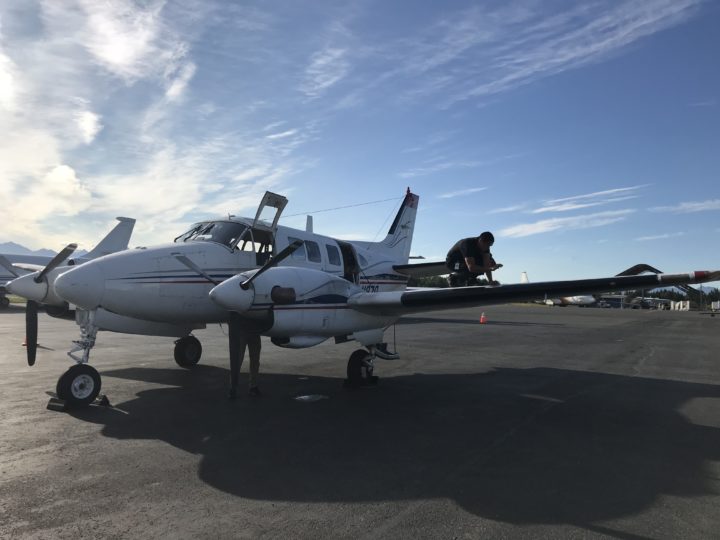
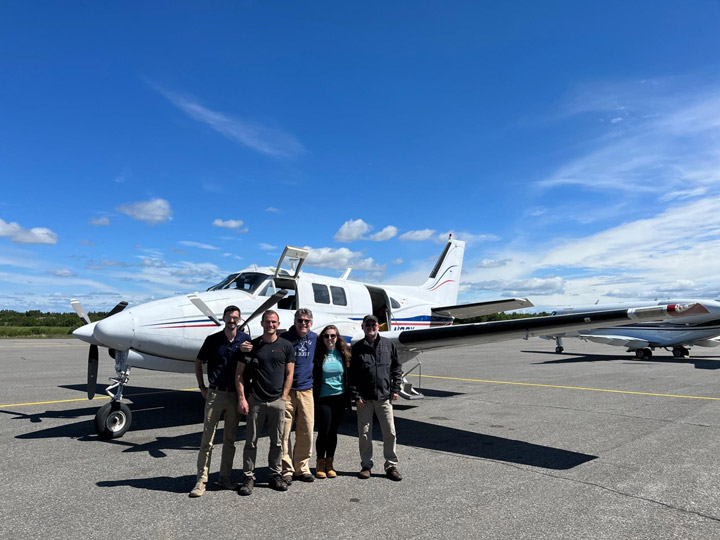
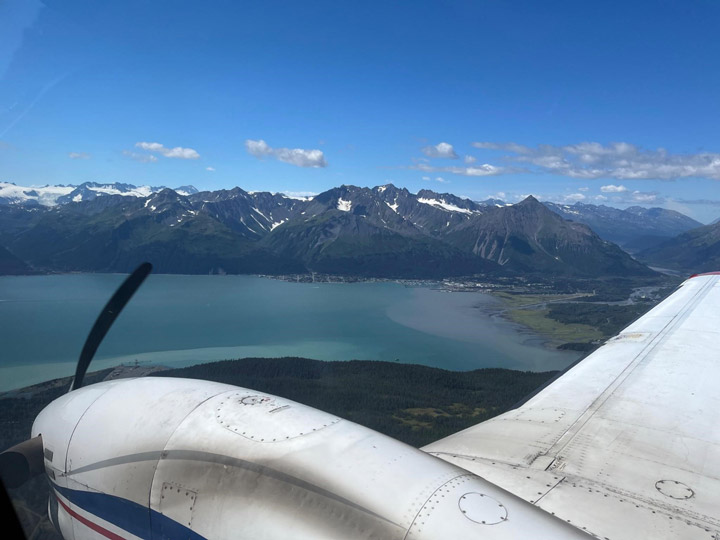
Our pilot Justice Pousson (on the wing) and co-pilot Sam Wilson (behind the propeller) work on the King Air A90 before take-off.
Outside the windows we get a full view of Alaskan landscape. We pass over the jagged peaks of the Talkeetnas into rolling spruce forests. From up here we can really see the extent of the beetle outbreak. Tendrils of red-brown and gray trees climb northward up the Matanuska-Susitna Valley. The red trees have likely been infested for over a year, and these needles will after three years turn gray and eventually fall off the tree. Though there are still some green spruce that we can see from the plane, there’s a good possibility that many of them are in fact already infested, as infested spruce trees generally maintain green needles for at least a year. The aerial Forest Service surveys can detect trees that have red or gray needles, but detecting trees that have only been infested for one year currently requires on-the-ground inspection of tree trunks. We are hoping these flights with G-LiHT will provide the imagery required to develop algorithms for green-stage detection.
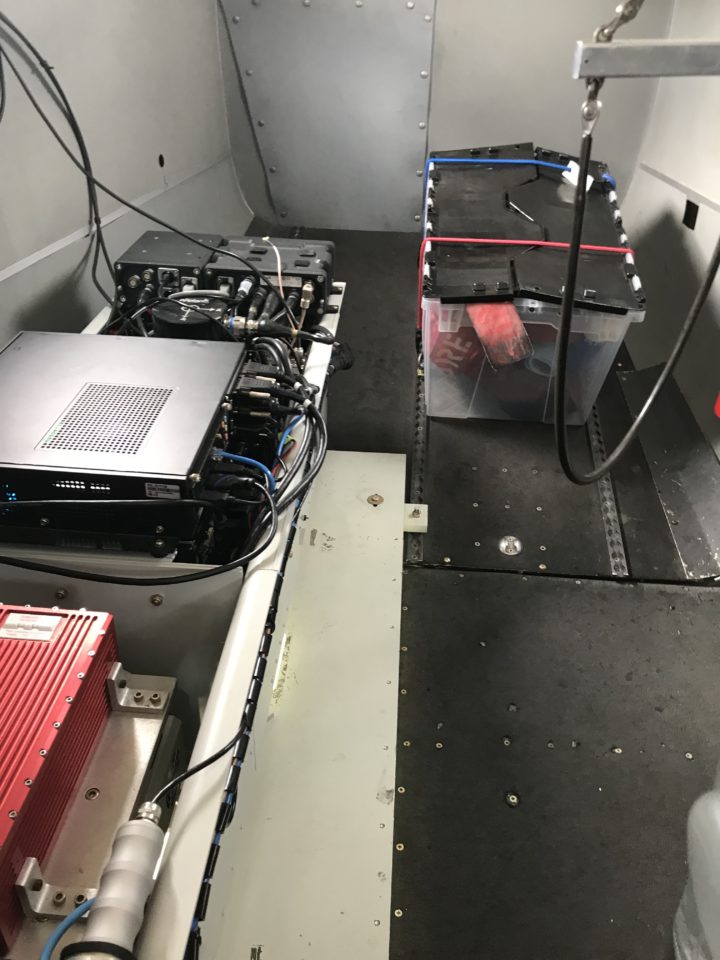
The G-LiHT instrument in the back of the plane. It includes a 3 cm camera and a hyperspectral, thermal, LiDAR, and solar-induced fluorescence sensor.
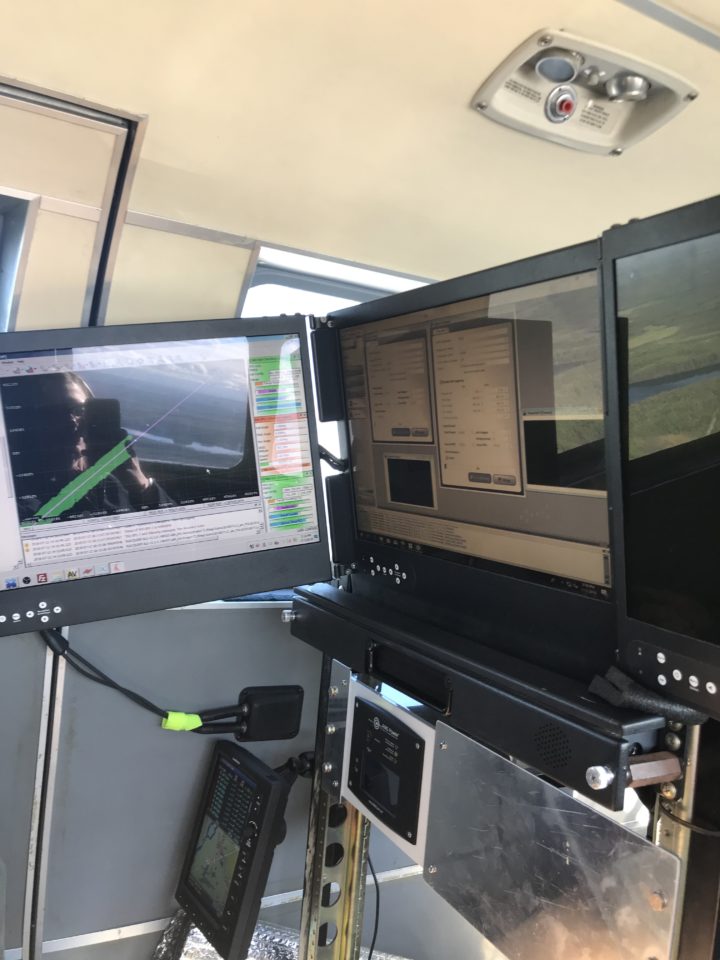
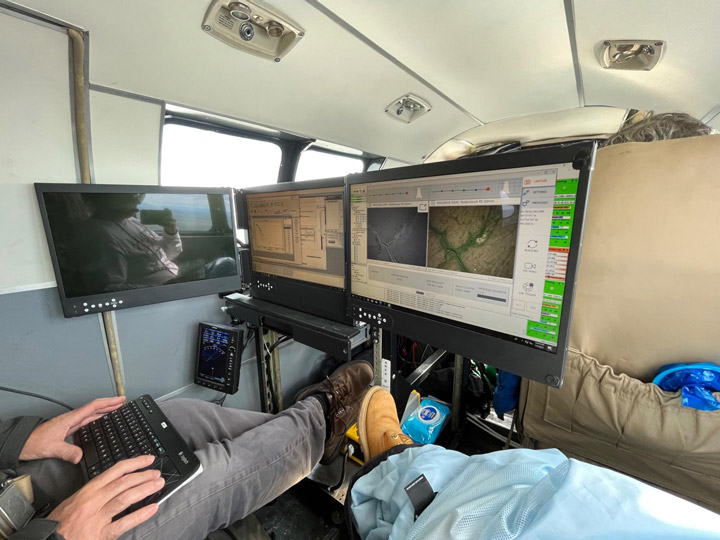
The computer used to operate G-LiHT during flights. We have to make sure we turn on and off all the sensors at the right times.
The weather sometimes prevents us from completing all of that day’s planned flight lines. On Thursday we had hoped the clouds that had been hanging low over the Chugach Mountains would dissipate as the day wore on, but we ended up having to turn back after only a few flight lines were collected. While this was disappointing, on the way back to the airport we got a spectacular view of Denali rising above the clouds.
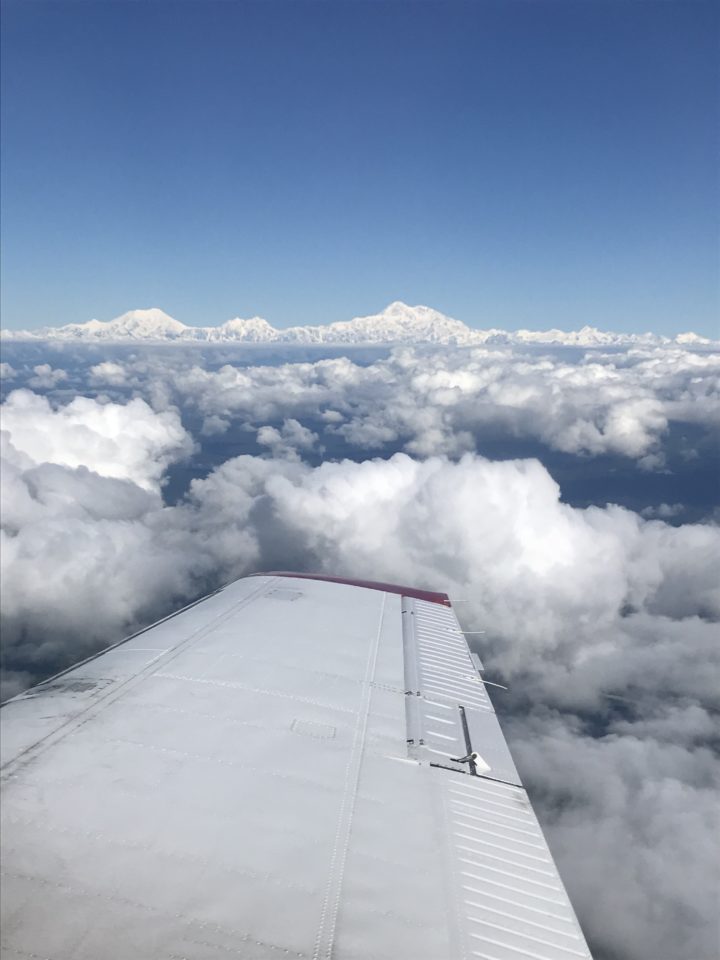
As we transited home we got a great view of Denali to the west.
Earlier this week we drove north from our base at Alaska Pacific University in Anchorage towards Denali State Park, armed with a Trimble GPS, DBH tape, and plenty of bear spray. We stopped off where G-LiHT had flown overhead the previous week and found trees to GPS. As we made our way around moose droppings and hoped not to come upon any bears, we picked out the infested from the healthy spruce trees and measured their position and size. We can identify the infested trees by the characteristic globs of pitch-out sap running down the trees’ trunks as well as red-brown dust along the bark crevices and at the base of the tree. The sap is a defense mechanism used by the trees to trap and kill the attacking beetles. Young, healthy trees are usually successful at fending off these attackers, however older or more stressed trees often succumb to the beetles’ offensive. Swarming pheromones given off by the beetles attract others in a “mass attack” which can overwhelm the defenses of even the more vigorous trees. This snowballing effect of more and more beetles attacking more and more trees, which then leads to more beetles reproducing and attacking in subsequent years is the mechanism behind the growing spruce beetle outbreaks.
Back at the cabins where we are staying we relax by a campfire and grill steaks, veggies, and salmon. I’m still trying to get used to the sunrise and sunset times in Alaska. With a sunrise time of 4:50am and a sunset time of 11:20pm, it barely gets dark at all. On the plus side this allows us to stay out later in the field collecting data without having to worry about daylight hours. On the down side it makes it pretty difficult to discern the time of day (or when you should probably head to bed…).
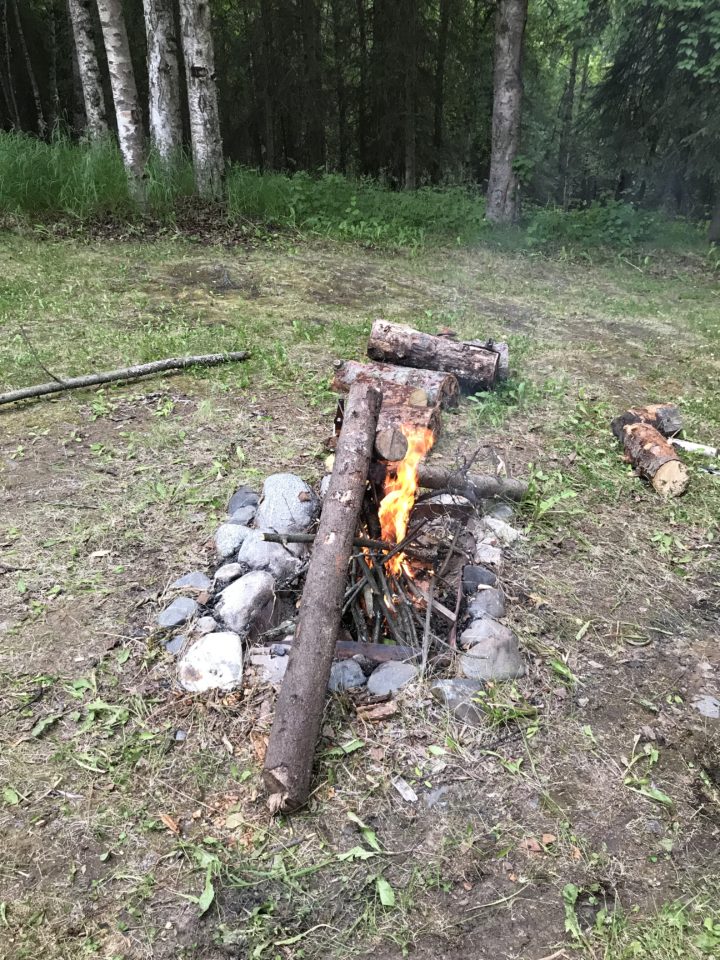
Our campfire (note: it was 9pm when I took this picture).
Next week we have more plans for field work, including flights with some unmanned aerial vehicles to collect data over the infestation areas. Also on my to-do list: more moose and other wildlife sightings!
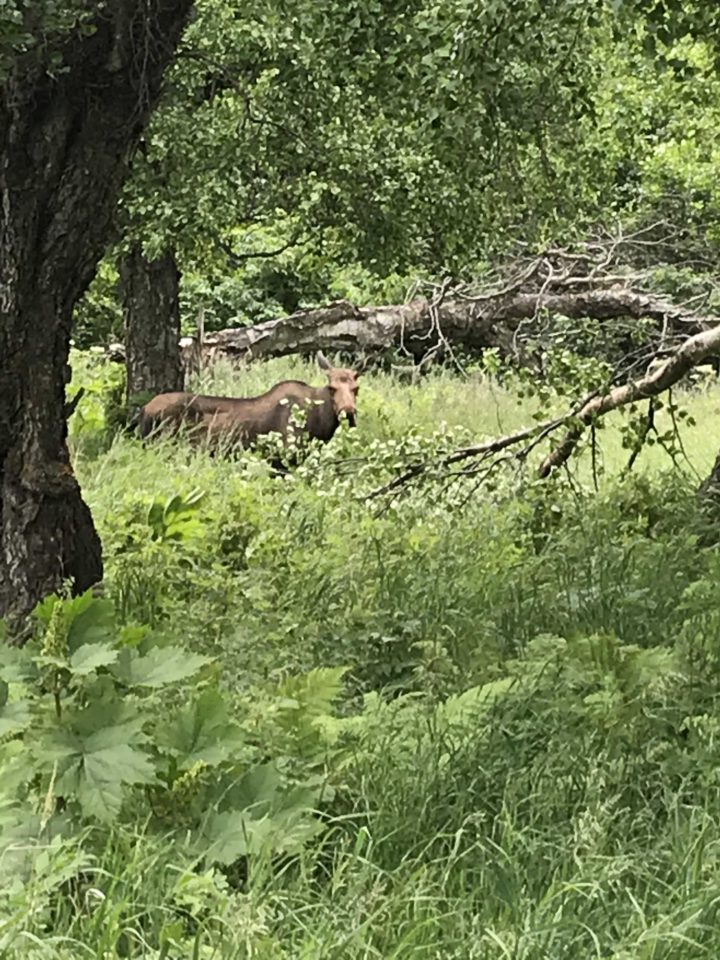
A moose we spotted during field work
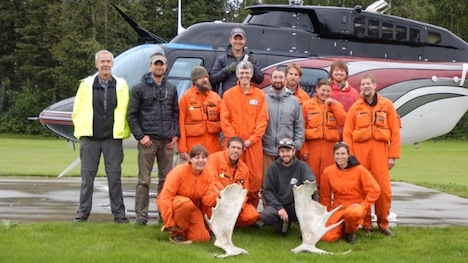
The USFS Forest Inventory & Analysis (FIA) crew before departing Delta Junction by helicopter to sample a remote field plot. Front Row: Katie Rigby, Misha Yatskov, Dan Irvine, Ashley Lehman; 2nd Row: Ken Winterberger, Chad Oukrop, Eric Straley, Seth Ayotte, Brendt Mueller, Michelle Hansen, Warren Childe, Ray Koleser; and 3rd Row: Pilot Josh Toal, Matt O’Driscoll, Warren Childe.
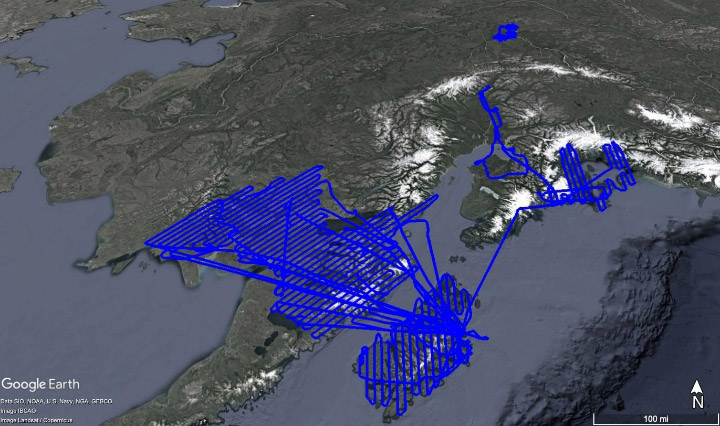
The Alaska G-LiHT Campaign is a partnership between scientists and NASA and the U.S. Forest Service (USFS). The design for the research is to link field measurements of forest structure, vegetation composition, and soils with airborne remote sensing data from G-LiHT. At this stage of the mission, the flight planning looks a little like a technicolor version of Pac-Man. Pink lines on the flight GPS units intersect points showing the location of ground measurements. In flight, the goal is to gobble as many of these dots as possible. Sometimes you wonder if the familiar “wocka wocka” noise of the old video game can be heard above the noise of the engine.
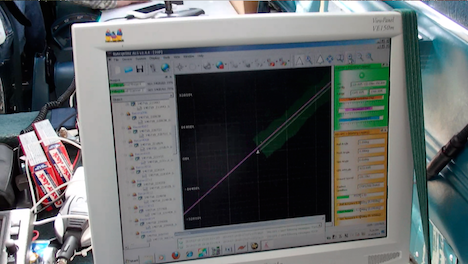
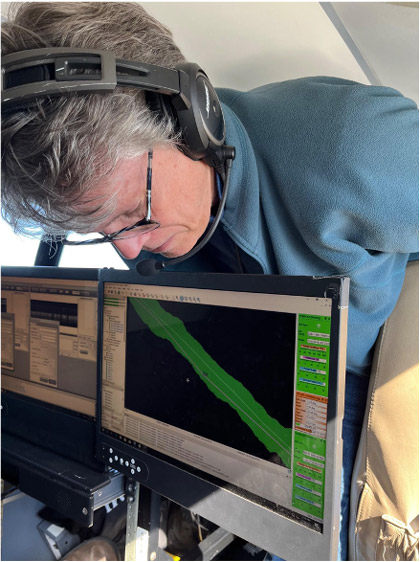
G-LiHT flight computer during data acquisition. The swath of lidar data appears green, the flight line pink, and real-time information on ranging distance and laser returns.
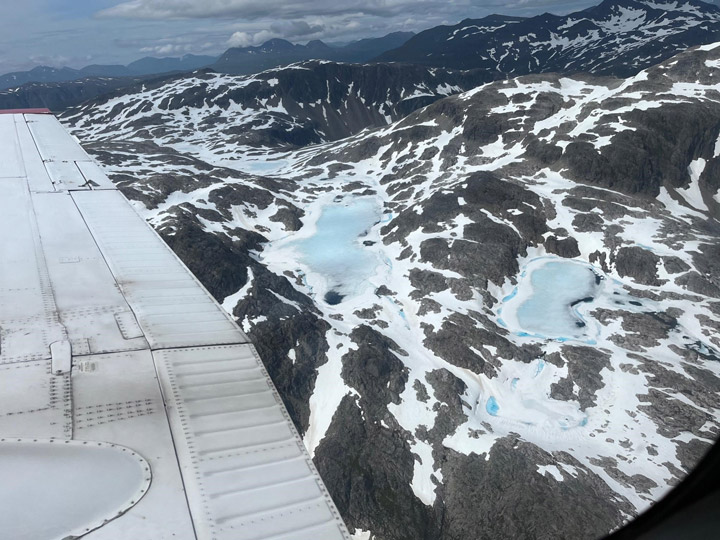
NASA and USFS partners have also worked hard to connect G-LiHT flights to other research activities in the valley. Within NASA, overlapping G-LiHT and MABEL flights are planned to characterize ice cover high in the Alaska Range west of Denali and across the Nebesna Glacier in Wrangell-St. Elias. Overlapping coverage is also planned with two hyperspectral missions from USGS (PI Ray Kokaly) and the U.S. Army Corps of Engineers (PI Steve Newman), offering the chance to compare different hyperspectral imaging systems and share ground calibration data.
G-LiHT flights will also cover a range of existing forest inventory plots collected by collaborators at the Department of Defense lands (Dan Rees), National Park Service (Carl Roland, Colin Malone), and the Alaska Department of Natural Resources (Chris Maisch, Doug Hanson). A dense network of flight lines is planned in and around the Bonanza Creek Experimental Forest and the Caribou Poker Creek Research Watershed to cover research plots established by scientists at the University of Alaska Fairbanks (Jaime Hollingsworth, Glenn Juday, and David McGuire, among others).
Further afield, still more dots on the flight plan represent long-term studies of forest recovery from fire. More than 40 percent of the watershed has burned since 1950, and G-LiHT will sample about 80 percent of large wildfires that have burned over the past 60 years. Record rainfall this summer has kept fire activity in check, but G-LiHT data from 2014 will also provide a benchmark for assessing changes from fires in coming years. Each of these intersecting lines and points represents a new opportunity for collaboration with the Alaska G-LiHT Campaign in 2014.
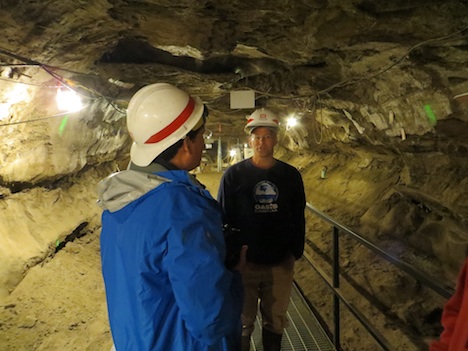
G-LiHT PI Bruce Cook talks with Tom Douglas (US Army Corps of Engineers) during a tour of the Permafrost Tunnel Research Facility before a joint field visit to the Cold Regions Research and Engineering Laboratory (CRREL) field sites outside Fairbanks, Alaska.
Text by Doug Morton
NASA’s Goddard Space Flight Center
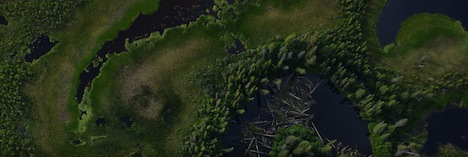
G-LiHT DSLR image of forests and open water near the Tetlin National Wildlife Refuge east of Tok, Alaska. Credit: NASA
I have always enjoyed looking out the window of a plane. From the typical cruising altitude of a commercial jetliner, the view of lakes and fields and mountains is familiar (but still fascinating) to a NASA scientist used to looking at Earth from space. Vegetation and land use follow the topography in predictable ways — agricultural fields on the flattest lands and dense forest cover on the warm, south-facing slopes.
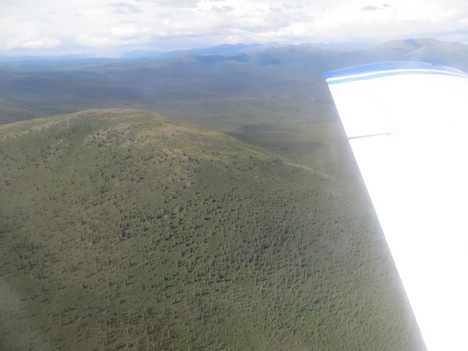
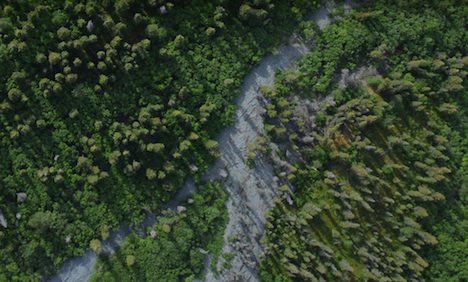
Spruce forest in the Yukon-Charley Rivers National Preserve north of Delta Junction, Alaska. Credit: Ross Nelson/NASA’s Goddard Space Flight Center
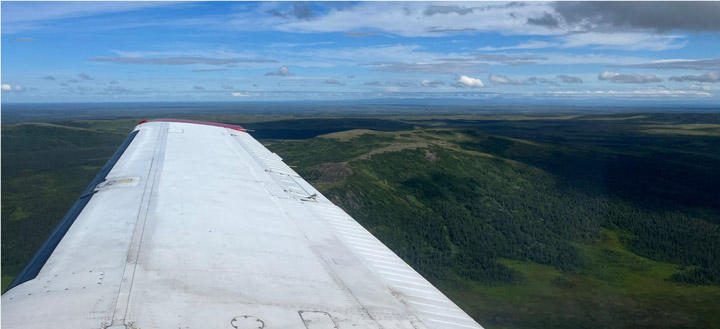
In Alaska, the G-LiHT campaign is flying low and slow to provide a very detailed look at forest structure, topography, wetlands, and forest health. At 1,100 feet above ground level, the view from above is stunning. Looking down, you see individual trees, small polygons formed by permafrost, and subtle changes in topography that allow vegetation to flourish on dry ground or wallow in the wetlands of the Tanana flats. Small black spruce trees, barely head high and the width of a dinner plate, are packed together in stands too thick to walk through. Looking out, you can see the vast expanse of the Tanana Valley, a lush green carpet of forest. The braided channels of the river flash in the sunlight as the milky white water heads out of the mountains. Ahead, the steep rise of the Alaska Range signals the end of another flight line.
Seeing the landscape from the same perspective as the G-LiHT sensors provides essential context for the project. The G-LiHT operators on the plane can switch between the real-time view of the incoming data stream and the landscape below. G-LiHT PI Bruce Cook noted, “it’s a little dizzying to watch the imagery fly by on the screen, but matching the bird’s eye view to the data gives an idea of what is possible with the analysis and interpretation of the G-LiHT data.”
Update: As of July 19, the piper had flown more than 70 hours for data collection (9,300 miles), and with more than half of the planned flight lines in the Tanana region completed.
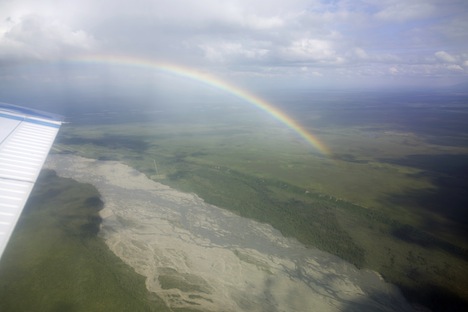
Rainbow over the Tanana River. Credit: Bruce Cook/NASA’s Goddard Space Flight Center
Text and photos provided by Doug Morton
NASA’s Goddard Space Flight Center
Credit: NASA/Doug Morton
NASA and USDA Forest Service scientists are collaborating on an ambitious project to inventory forest resources in the Tanana Valley of interior Alaska, a region the size of Iowa. The pilot project, funded by the USDA Forest Service Pacific Northwest (PNW) Research Station and NASA’s Carbon Monitoring System (CMS), combines forest inventory plots and airborne remote sensing data from NASA Goddard’s Lidar, Hyperspectral, and Thermal Airborne Imager (G-LiHT). The remote forests of interior Alaska have never been included in national inventories of U.S. forest resources based on the costs and complexity of acquiring field data in remote and difficult terrain.
The partnership between NASA and the Forest Service leverages unique capabilities for airborne remote sensing and ground surveys of forest structure and composition. For NASA, key research questions include the spatial distribution of forest carbon stocks, disturbance and recovery from fire, and data fusion—including the opportunity to characterize forest composition using a combination of lidar, hyperspectral, and thermal data from G-LiHT. G-LiHT data collections will also benchmark conditions across the Tanana Valley, an important part of the research domain for NASA’s Arctic and Boreal Vulnerability Experiment (ABoVE). For the Forest Service, the project will test the tradeoffs between a traditional ground-based surveys of forest resources and a hybrid approach to combine a limited ground sample with extensive coverage using G-LiHT airborne lidar and image data. Both NASA and the Forest Service are interested to track changes in forest cover and composition from wildfires and warming climate in coming decades.
As of July 14, the G-LiHT team had completed 40 percent of the planned flight lines across the Tanana region, totaling 3 TB of raw data and more than 2 billion laser shots fired. The flight crew is currently based out of Tok and Fairbanks, Alaska.
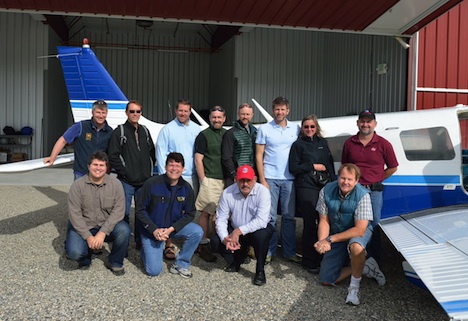
On July 14, 2014, NASA and USFS collaborators in Fairbanks, Alaska, prepare for G-LiHT flights. Top row: Hans Andersen (USFS PI), Tom Wirth (EPA), Grant Domke (USFS), Hobie Perry (USFS), Chris Woodall (USFS), Doug Morton (NASA), Gretchen Nicholas (USFS), Larry Corp (NASA/Sigma Space). Bottom: Matt Fagan (NASA/ORAU), Bruce Cook (NASA), Greg Reams (USFS), Ross Nelson (NASA)
