I’m writing this post on our last day in St. Mary’s, Alaska. This tiny village of about 560 inhabitants had its surroundings ravaged by two large tundra fires in the summer of 2022. The East Fork fire was the second largest tundra fire in Alaska in over 40 years and the biggest in Southwest Alaska. These events were historic, and I could start this post by writing about the intense and productive three weeks of work we had here. However, this whole project started much earlier.
I started this Ph.D. with plans to do field work in Siberia. However, halfway through, due to the pandemic and geopolitical issues, I saw all those plans slip through my fingers. Despite being from a country with among the greatest biodiversity in the world (Brazil), the arctic-boreal environments have always fascinated me. So in the winter of last year, when I came across these fires while analyzing satellite images, I knew this was a unique opportunity to pack my bags and finally be in the tundra. I remember showing the first satellite images and data of these fires to my supervisor, Dr. Sander Veraverbeke, and he confirmed that these fires were indeed scientifically very interesting and logistically feasible for our expedition. From then on, a long process of preparation began.
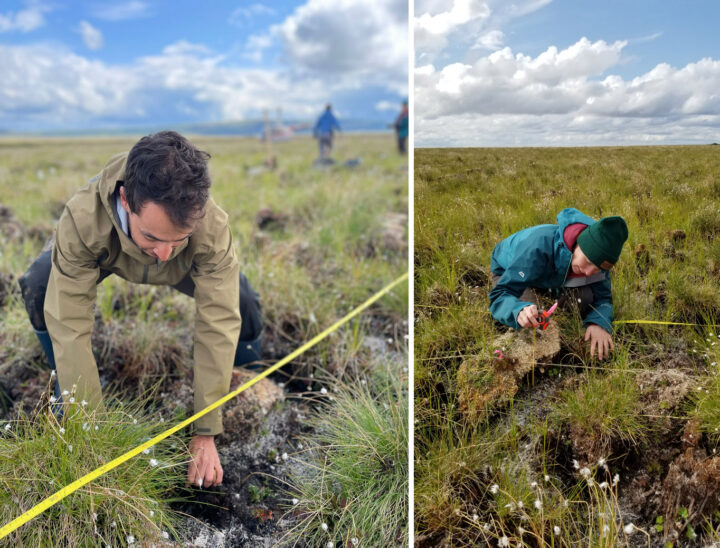
As this field campaign is part of my Ph.D. project, I was responsible for planning both the scientific and logistical aspects. Now, reflecting after the final day of sampling, it is incredibly rewarding to see that the planning has paid off. We sampled 11 days by boat along the Andreafsky River sampling the East Fork fire and another five days by helicopter sampling the Apoon Pass fire. Our main goal was to estimate the carbon combustion from these fires, that is, the area-normalized emissions in grams of carbon per square meter. Field measurements are the prime way to accurately quantify carbon combustion. To do it, we collected soil samples and estimated the burn depth of the soil organic layer. It is crucial to advance the quantification of tundra fire carbon combustion and understanding its environmental drivers.
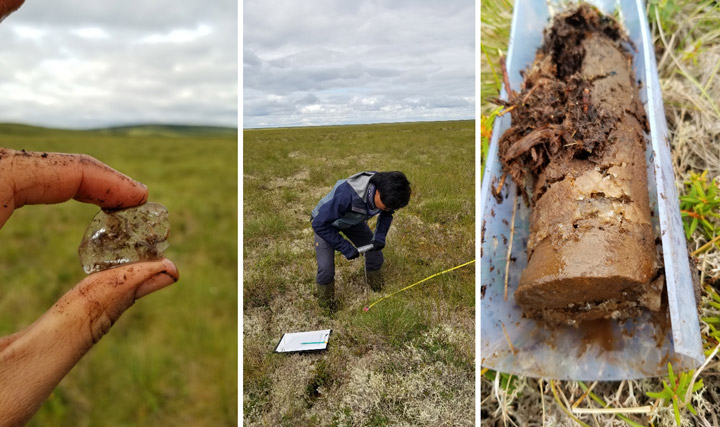
In addition to carbon emissions, another key point of our expedition is to understand the effects of fires on permafrost. Previous research has shown that fires in the boreal forest increase the thaw depth of the active layer above permafrost, which can lead to permafrost degradation. We are curious to investigate this mechanism in the tundra, even more so now that we have found ice-rich permafrost during our fieldwork.
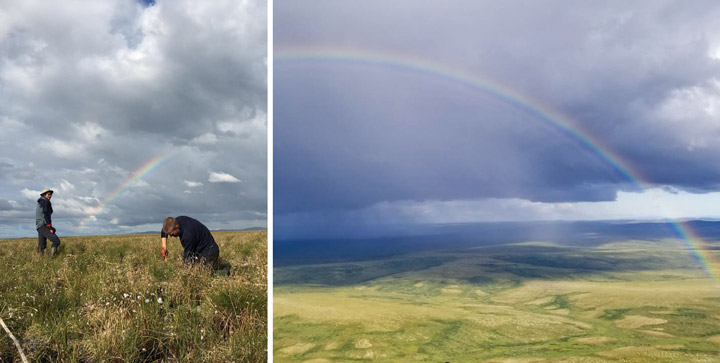
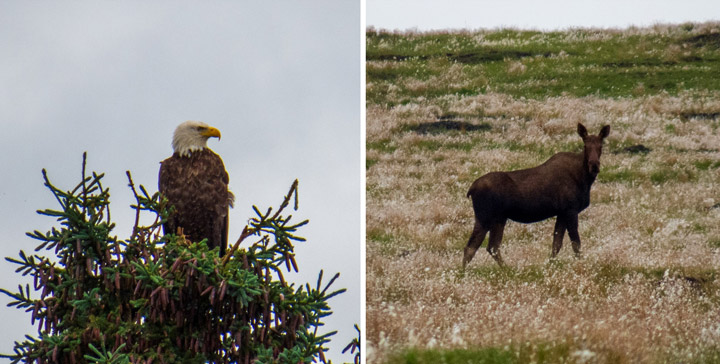
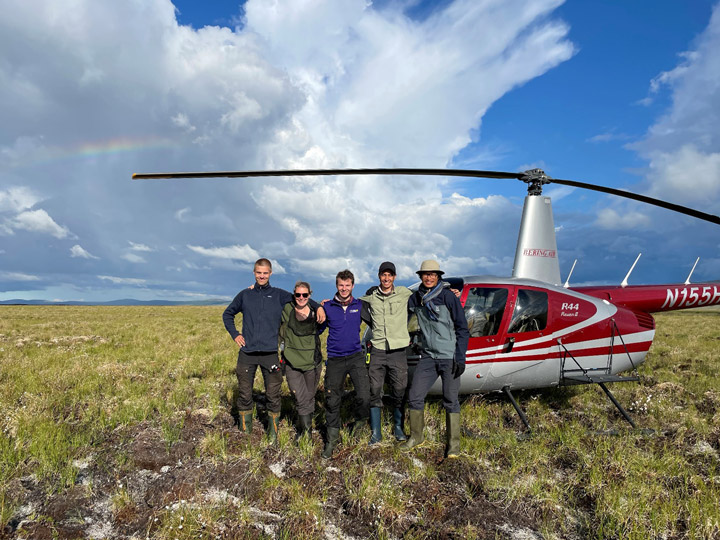
But it was not just the work that was amazing during this campaign. The tundra landscape was always breathtaking. Both from above with the helicopter and along the river from the boat. We were presented with a stunning rainbow on our first day using the helicopter. Wildlife was always around: moose, bears, beavers, eagles, geese, and countless other bird species.
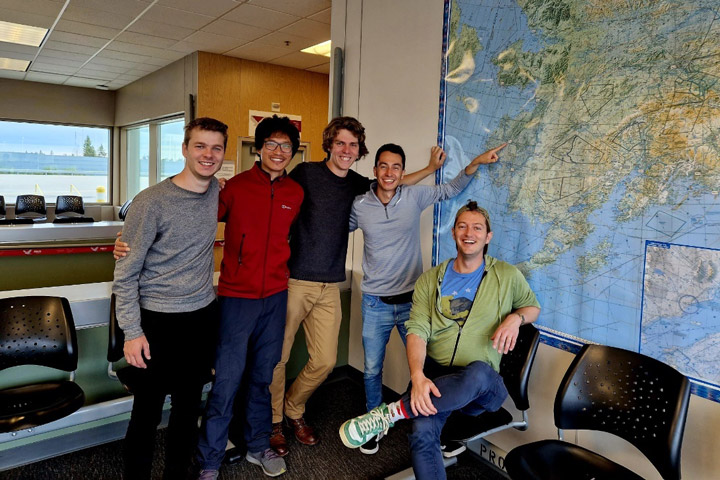
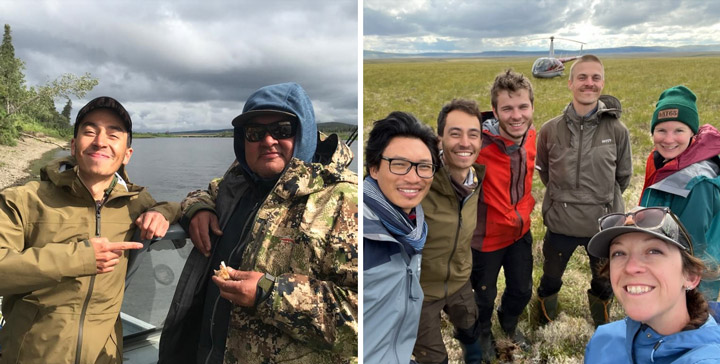
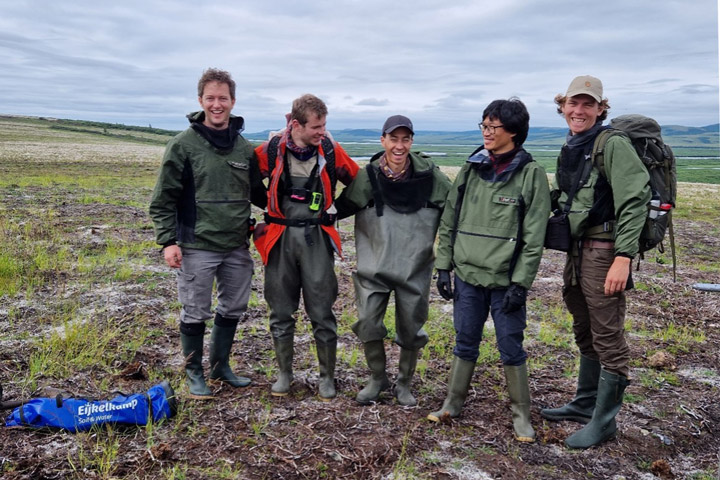
Lucas Ribeiro Diaz, Max van Gerrevink, Rebecca Scholten, Sonam Wangchuk, Thomas Janssen, Thomas Hessilt, and Sander Veraverbeke were part of this field expedition. Our team is part of the Climate & Ecosystems Change research group at the Vrije Universiteit Amsterdam. However, the success of this campaign would not have been possible without the help of our boat driver, David ‘Matty’ Beans, and our helicopter pilot, Savanna Paulsen. We are also grateful to the city of St. Mary’s and its people for warmly welcoming us during these weeks. Finally, Dr. Lisa Saperstein from the U.S. Fish and Wildlife Service in Alaska has provided tremendous help when we were organizing our campaign.
45 plots, 1,383 tussocks measured, 255 soil samples, 495 thaw depth measurements—numbers like these make us believe that we have just concluded a field campaign on some of the most densely sampled tundra fires in the history of science. Now, we have three more weeks of work ahead of us at the USGS soil laboratory in Anchorage. With lots of ideas in my head, I’m excited to see the new findings this valuable data can reveal!
I have just finished writing this post and I realize that perhaps it is too personal. But it could not be otherwise. Our science often blends in with who we are, our dreams and expectations. I leave St. Mary’s feeling fulfilled, I think I have always dreamed of being here. I leave the tundra sure that moments like this are the reason I decided to embark on this journey of doing research.
This tundra fires field expedition is part of FireIce (Fire in the land of ice: climatic drivers & feedbacks). FireIce is a Consolidator project funded by the European Research Council. FireIce is affiliated with NASA ABoVE. This blog post was written by Lucas Ribeiro Diaz, a Ph.D. student at Vrije Universiteit Amsterdam, studying arctic-boreal fires by combining field and remote sensing approaches.
Just like the undulating terrain of the tussocky tundra we traverse, our days also take unexpected twists and turns. After a beautiful last day of sampling the East Fork fire scar along the Andreafsky River, where three moose visited us and delivered a personal goodbye, we were all excited for our first day of sampling the Apoon Pass fire scar via helicopter. But our spirits were momentarily dampened by news of Savanna, our pilot flying in from Nome, getting stuck in a thunderstorm on her way to our base in St. Mary’s, Alaska. Her arrival, delayed until early afternoon, was just the prelude to a challenge-laden morning.
Further issues emerged with our satellite communications device, requiring transatlantic collaboration with our colleagues in Amsterdam (many thanks to Thomas for his unwavering support!) These obstacles left us momentarily uncertain about the feasibility of flying at all that day. Miraculously, by 2 p.m., the looming cumulus of problems and bad weather began to disperse, and by 2:30 p.m., with a renewed sense of purpose, we embarked on our mission to sample the second fire of our field campaign.
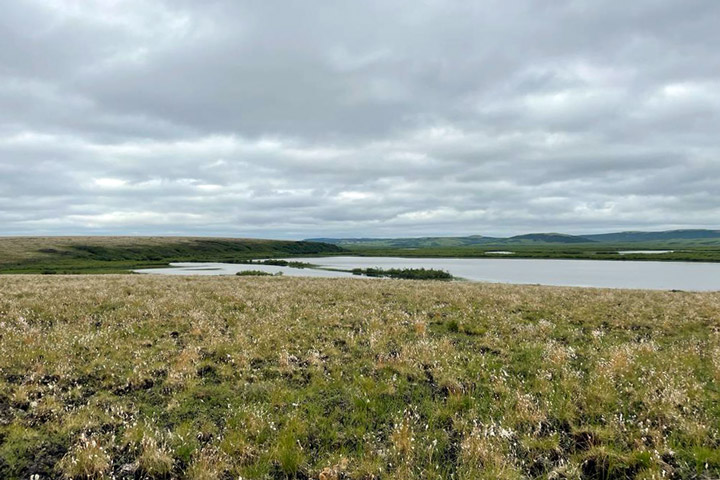
The flight itself proved to be a standout experience, treating us to a breathtaking panorama over the hilly tundra that we had sampled along the Andreafsky River in the preceding days. The Apoon Pass fire scar, though not far from the East Fork fire, is geographically quite different, as it is located in very flat lowland terrain. Flying over the last crests of the hill range provided a captivating sight of the vast lowlands extending in all directions.
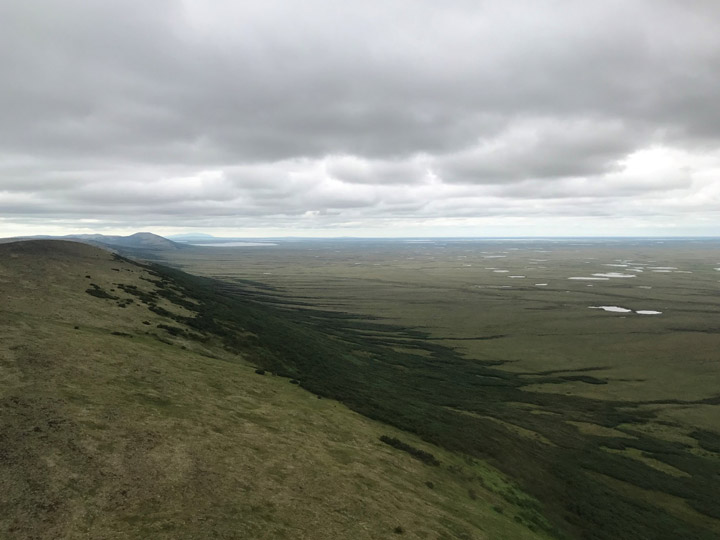
To our surprise, we were only able to spot the difference between burned and unburned tundra when descending to a relatively low altitude. This observation, together with the satellite imagery prepared by our campaign lead Lucas, led us to an initial conjecture that fire severity would be lower than what we had previously seen.
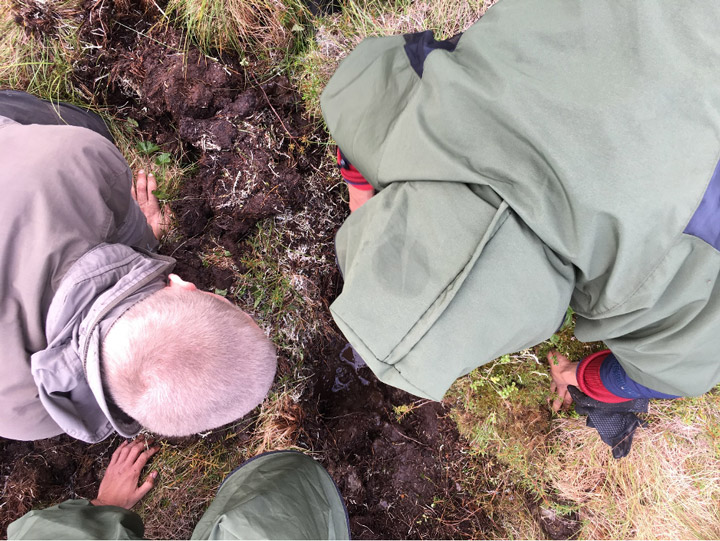
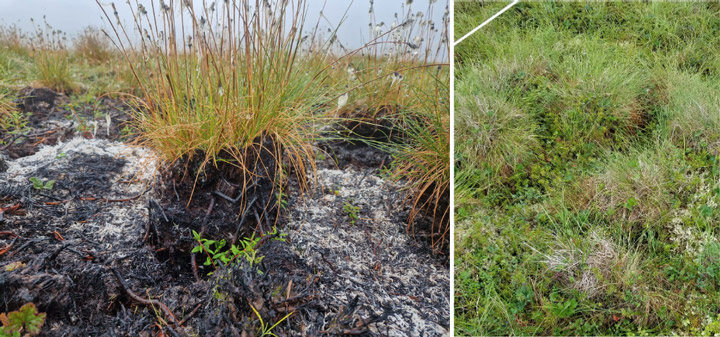
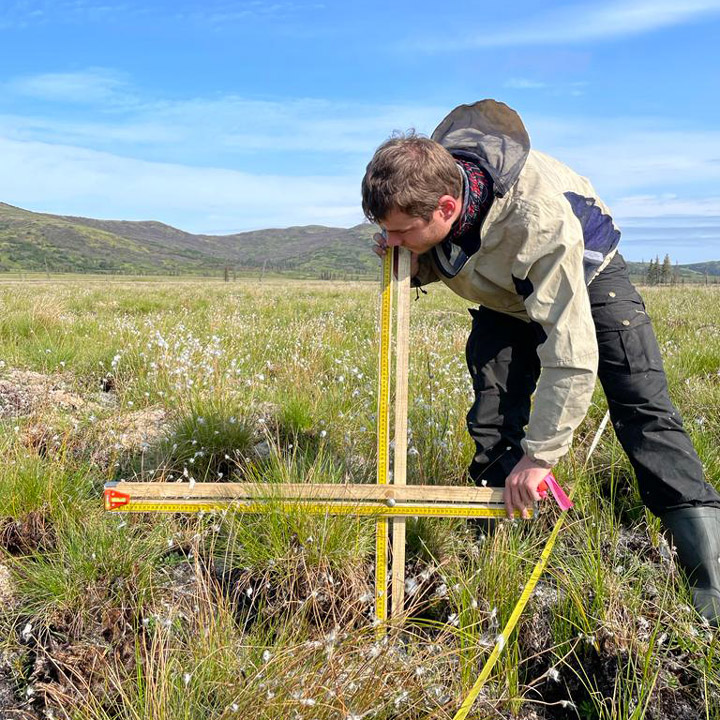
To systematically assess fire severity and carbon emissions in our plots, we are following protocols established by Mack et al. (2011) and Moubarak et al. (2023) for tundra fires in Alaska. We use two independent methods to estimate the burn depth based on the height of tussocks and Sphagnum (peat moss) patches in our plots. For the tussock-based method, we compare the height of tussocks that survived the fire with the height of tussocks in unburned locations. This gives us an estimate how much duff and other organic material has been combusted. For the Sphagnum-based method, we connect different moss patches of similar height with a thread and measure the distance from the thread to the surface at 25-centimeter intervals. This will give us an overview of the variability in burn depth within our sampling locations.
These two measurements will allow us to quantify the amount of carbon combusted per plot, which we can relate to the satellite imagery, as well as to the thickness of the active layer we are measuring at each plot to assess how the fire is affecting the permafrost.
In the end, to our surprise, our first helicopter day turned into one of the best sampling days we had during the campaign so far. We were gifted with beautiful, sunny weather until 9 p.m., and sampled even more plots than we had initially expected. We have now become a well-oiled machine, capable of sampling a plot within a mere hour and a half. Having the helicopter with us at all times offered an invaluable advantage—the ability to swiftly transport parts of our team to nearby sampling sites. After having returned to our base, we are excited for another day in the beautiful tussock tundra of southwestern Alaska—keeping our fingers crossed for another couple of days of good weather!
In 2022, severe lightning ignited many fires in Alaska. Notably, several exceptionally large fires burned in the tundra of Southwest Alaska, an ecosystem that is traditionally less prone to fire. While our understanding of the carbon emissions of boreal forest fires in Alaska and Canada has strongly advanced in recent years thanks to the work of several teams within NASA’s Arctic-boreal Vulnerability Experiment (ABoVE), the impacts of these tundra fires on the ecosystem’s carbon balance and permafrost has remained less well known.
Our Climate and Ecosystems Change research group from the Vrije Universiteit Amsterdam in the Netherlands is currently in Southwest Alaska to fill these critical knowledge gaps. Our team received tremendous help of Dr. Lisa Saperstein from the Alaska Fish and Wildlife Service in organizing the campaign. Lisa will also start a field campaign in the same fires in the next few days and we plan to pool our datasets to maximize synergies between our efforts.
The 2022 East Fork and the Apoon Pass fires together burned more than 100,000 hectares (380 square miles) of primarily tundra landscapes in Southwest Alaska. They were among the largest tundra fires on record for the region.
Our basecamp is the village of St. Mary’s, located just west of the East Fork fire on the Andreafsky River. For the first part of our campaign, we are taking a boat upstream to access the fire scar. We are looking for burned tussock tundra sites, where we can measure the effects of the fire on the vegetation, soils, and permafrost in our plots. We are also sampling unburned tundra sites, which provide us a reference of the conditions without fire disturbance. During the last part of our campaign we will access sites in the remote Apoon Pass fire by helicopter.
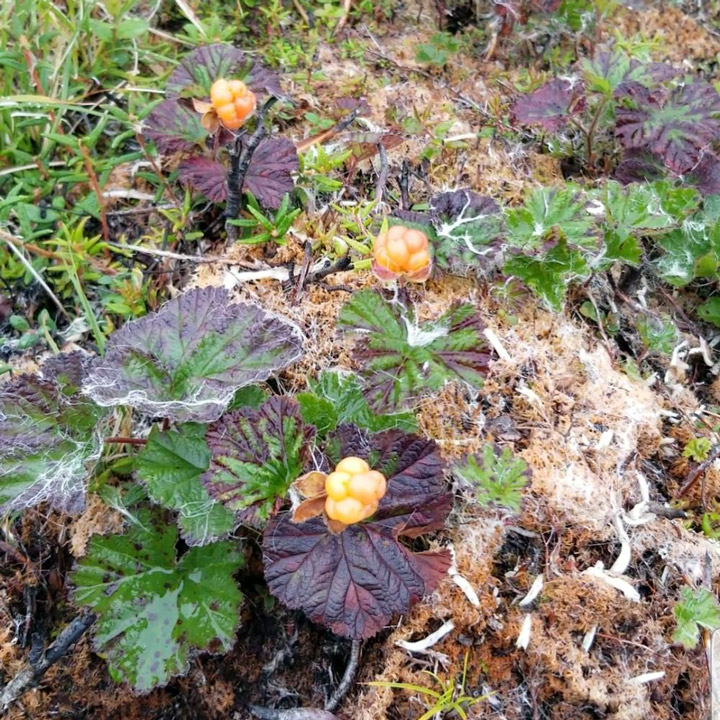
The local community heavily relies on the landscape for subsistence activities, like hunting and berry picking. Our boat driver, Matty Beans, is native to the area and is extremely helpful in bringing us to the right places. A large concern of the community is how the fire has effected the abundance of berries in the burned tundra. Our preliminary observations indicate that the cloudberries, locally also called salmonberries, were abundantly present in the burned sites. However, this was not the case yet for blueberries.
So far, we have been extremely lucky with mostly dry weather and only a little bit of rain. However, the dry weather has affected the water levels in the Andreafsky River. We came across collapsed river banks and exposed sand banks in the river. Our boat driver has switched to his jet boat so that we can continue on, even in more shallow parts of the river. The weather is changing though, with rain coming in for several days. This is good for the water levels, but the colder and rainy weather may make our sampling efforts more challenging.
After seven days and 19 plots of sampling, we are now taking a well-deserved rest day. I used this rest day to write this blog and digitize some datasheets. Over the next four days, we will continue sampling along the river and then use a helicopter to access the Apoon Pass fire site for more sampling.
This field expedition is part of FireIce (Fire in the land of ice: climatic drivers & feedbacks). FireIce is a Consolidator project funded by the European Research Council. FireIce is affiliated with NASA ABoVE.
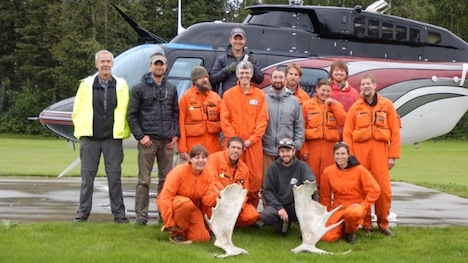
The USFS Forest Inventory & Analysis (FIA) crew before departing Delta Junction by helicopter to sample a remote field plot. Front Row: Katie Rigby, Misha Yatskov, Dan Irvine, Ashley Lehman; 2nd Row: Ken Winterberger, Chad Oukrop, Eric Straley, Seth Ayotte, Brendt Mueller, Michelle Hansen, Warren Childe, Ray Koleser; and 3rd Row: Pilot Josh Toal, Matt O’Driscoll, Warren Childe.
The Alaska G-LiHT Campaign is a partnership between scientists and NASA and the U.S. Forest Service (USFS). The design for the research is to link field measurements of forest structure, vegetation composition, and soils with airborne remote sensing data from G-LiHT. At this stage of the mission, the flight planning looks a little like a technicolor version of Pac-Man. Pink lines on the flight GPS units intersect points showing the location of ground measurements. In flight, the goal is to gobble as many of these dots as possible. Sometimes you wonder if the familiar “wocka wocka” noise of the old video game can be heard above the noise of the engine.
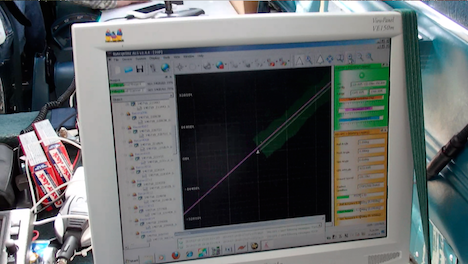
G-LiHT flight computer during data acquisition. The swath of lidar data appears green, the flight line pink, and real-time information on ranging distance and laser returns.
NASA and USFS partners have also worked hard to connect G-LiHT flights to other research activities in the valley. Within NASA, overlapping G-LiHT and MABEL flights are planned to characterize ice cover high in the Alaska Range west of Denali and across the Nebesna Glacier in Wrangell-St. Elias. Overlapping coverage is also planned with two hyperspectral missions from USGS (PI Ray Kokaly) and the U.S. Army Corps of Engineers (PI Steve Newman), offering the chance to compare different hyperspectral imaging systems and share ground calibration data.
G-LiHT flights will also cover a range of existing forest inventory plots collected by collaborators at the Department of Defense lands (Dan Rees), National Park Service (Carl Roland, Colin Malone), and the Alaska Department of Natural Resources (Chris Maisch, Doug Hanson). A dense network of flight lines is planned in and around the Bonanza Creek Experimental Forest and the Caribou Poker Creek Research Watershed to cover research plots established by scientists at the University of Alaska Fairbanks (Jaime Hollingsworth, Glenn Juday, and David McGuire, among others).
Further afield, still more dots on the flight plan represent long-term studies of forest recovery from fire. More than 40 percent of the watershed has burned since 1950, and G-LiHT will sample about 80 percent of large wildfires that have burned over the past 60 years. Record rainfall this summer has kept fire activity in check, but G-LiHT data from 2014 will also provide a benchmark for assessing changes from fires in coming years. Each of these intersecting lines and points represents a new opportunity for collaboration with the Alaska G-LiHT Campaign in 2014.
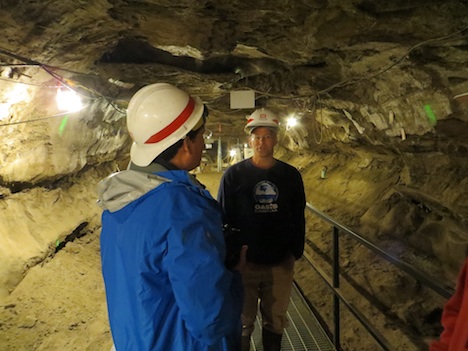
G-LiHT PI Bruce Cook talks with Tom Douglas (US Army Corps of Engineers) during a tour of the Permafrost Tunnel Research Facility before a joint field visit to the Cold Regions Research and Engineering Laboratory (CRREL) field sites outside Fairbanks, Alaska.
Text by Doug Morton
NASA’s Goddard Space Flight Center
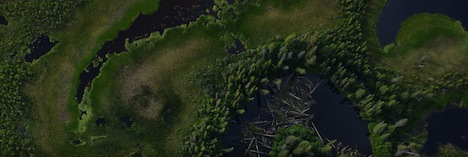
G-LiHT DSLR image of forests and open water near the Tetlin National Wildlife Refuge east of Tok, Alaska. Credit: NASA
I have always enjoyed looking out the window of a plane. From the typical cruising altitude of a commercial jetliner, the view of lakes and fields and mountains is familiar (but still fascinating) to a NASA scientist used to looking at Earth from space. Vegetation and land use follow the topography in predictable ways — agricultural fields on the flattest lands and dense forest cover on the warm, south-facing slopes.
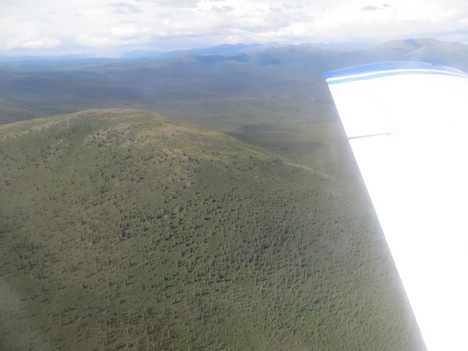
Spruce forest in the Yukon-Charley Rivers National Preserve north of Delta Junction, Alaska. Credit: Ross Nelson/NASA’s Goddard Space Flight Center
In Alaska, the G-LiHT campaign is flying low and slow to provide a very detailed look at forest structure, topography, wetlands, and forest health. At 1,100 feet above ground level, the view from above is stunning. Looking down, you see individual trees, small polygons formed by permafrost, and subtle changes in topography that allow vegetation to flourish on dry ground or wallow in the wetlands of the Tanana flats. Small black spruce trees, barely head high and the width of a dinner plate, are packed together in stands too thick to walk through. Looking out, you can see the vast expanse of the Tanana Valley, a lush green carpet of forest. The braided channels of the river flash in the sunlight as the milky white water heads out of the mountains. Ahead, the steep rise of the Alaska Range signals the end of another flight line.
Seeing the landscape from the same perspective as the G-LiHT sensors provides essential context for the project. The G-LiHT operators on the plane can switch between the real-time view of the incoming data stream and the landscape below. G-LiHT PI Bruce Cook noted, “it’s a little dizzying to watch the imagery fly by on the screen, but matching the bird’s eye view to the data gives an idea of what is possible with the analysis and interpretation of the G-LiHT data.”
Update: As of July 19, the piper had flown more than 70 hours for data collection (9,300 miles), and with more than half of the planned flight lines in the Tanana region completed.
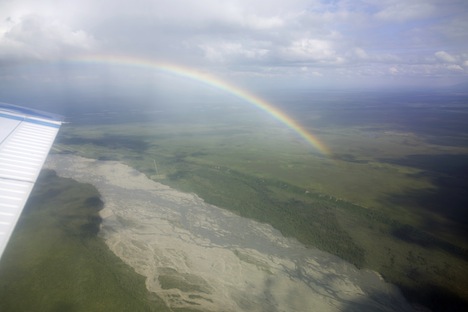
Rainbow over the Tanana River. Credit: Bruce Cook/NASA’s Goddard Space Flight Center
