The boreal forest is Earth’s northernmost forest. It circles the Earth at high latitudes, covering large parts of Russia, Canada, Scandinavia, and Alaska. These forests are some of the largest intact forests on Earth. They store a large amount of carbon—as much as (if not more than) is stored in tropical forests. The trees use photosynthesis to grow, and in the process, they take in carbon dioxide from the atmosphere. Carbon dioxide is an important greenhouse gas and a driver of global climate change, which is why it is vital to understand the rates of the transfer and storage of carbon between the atmosphere and the boreal forest.
Due to their vast area and remoteness, boreal forests are difficult to monitor from the ground. Data from satellites provide the means for observing these forests’ condition and detecting change across wide areas. In our project, “Clarifying Linkages Between Canopy Solar Induced Fluorescence (SIF) and Physiological Function for High Latitude Vegetation,” our team from University of Maryland Baltimore County, NASA’s Goddard Space Flight Center, and the University of Texas El Paso is working to develop advanced approaches to using satellite data to describe boreal forest productivity and detect stress responses. Our project is part of the NASA Terrestrial Ecology program’s Arctic-Boreal Vulnerability Experiment (ABoVE), a large-scale field study in Alaska and western Canada, whose overall goals are to make use of NASA technology to gain a better understanding of ecosystems at high latitudes, their responses to environmental change, and the effects of those changes.
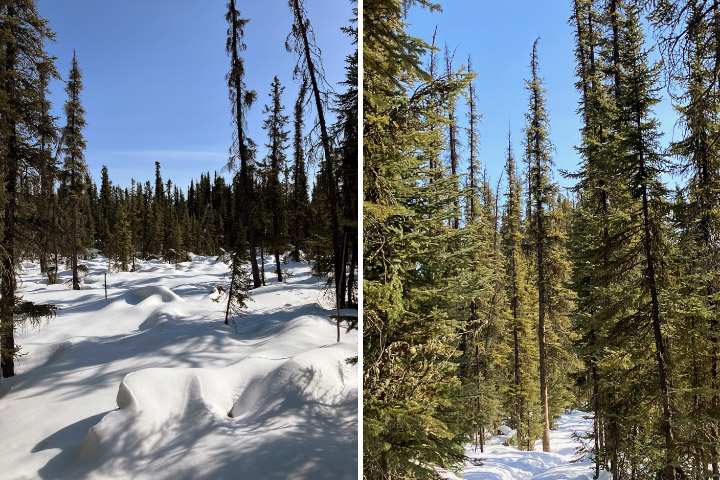
A large proportion of the trees in the boreal forest are conifers, such as spruce trees (images above). These trees keep their green needles all year long. This makes it hard to determine when they start photosynthesizing in the spring, compared to deciduous trees, like oaks, where we can clearly see the growth of new green leaves in the spring.
The timing of the start of the growing season is key to determining the overall productivity of the forest and can be a useful predictor of possible stress events later in the summer. So, one of the goals of our project is to find ways to use light to detect when these evergreens “turn on” photosynthesis in the spring and actively start taking up carbon from the atmosphere.
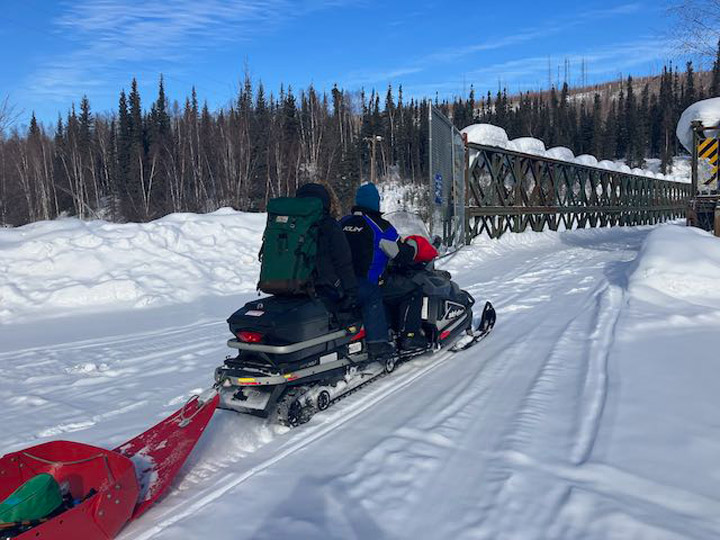
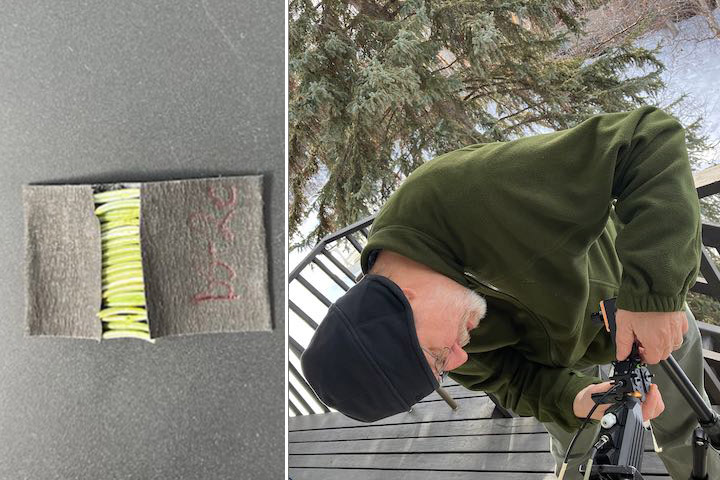
This brought team members to Fairbanks, Alaska, right in the heart of the boreal forest. We arrived with our instruments in April 2023 to observe the very start of the boreal growing season. Our instruments use different methods to detect the onset and rate of photosynthetic activity in plants. One method we are using to identify photosynthetic activity in the evergreens is based on light that is actually emitted from the trees. Plants absorb light to power photosynthesis, but in the process of photosynthesis some of that light energy is radiated out from the plant; this is called chlorophyll fluorescence. This fluoresced light is very dim, which is why we don’t see plants glowing, but we can use sensitive instruments to measure fluorescence at leaf and canopy scales, which can even be done with instruments on satellites from space.
A second method is to detect very subtle changes in the color of the needles that are related to changes in the pigments in the leaves. Pigments such as chlorophyll, which makes leaves green, and carotenoids, which cause the yellow color of leaves in the fall, control potential rates of photosynthesis as well as provide protection to the leaves when stressed. These color changes are also subtle enough that we don’t see them with our naked eyes, but our instruments can measure and detect these pigment changes.
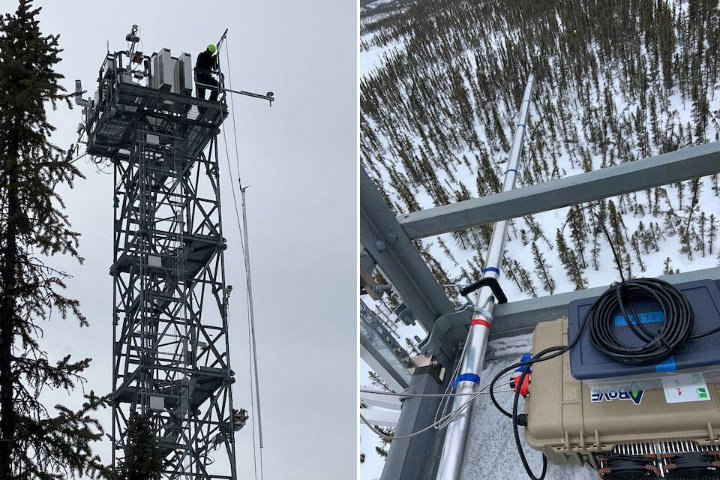
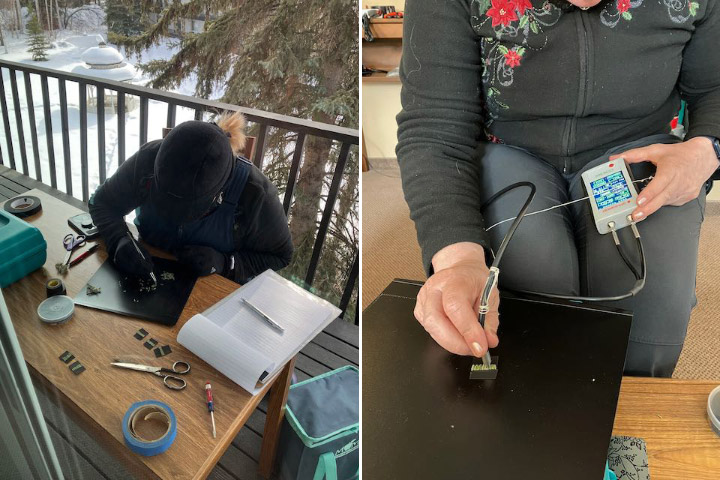
Instruments that are already on the flux tower measure the transfer of heat, moisture, and carbon dioxide between the atmosphere and the forest (images below).
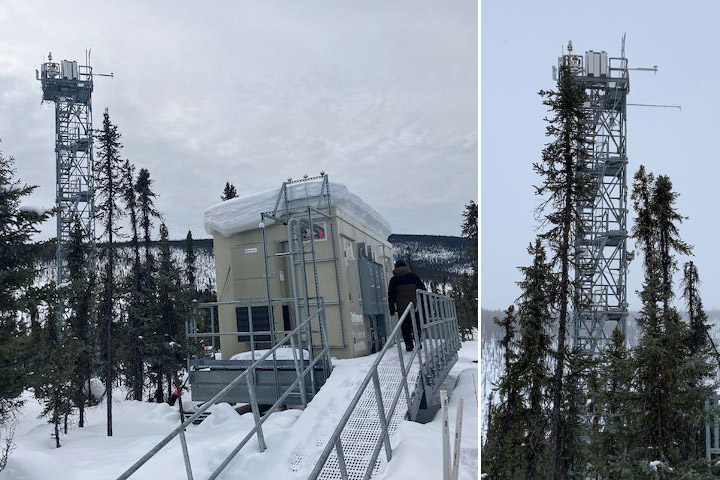
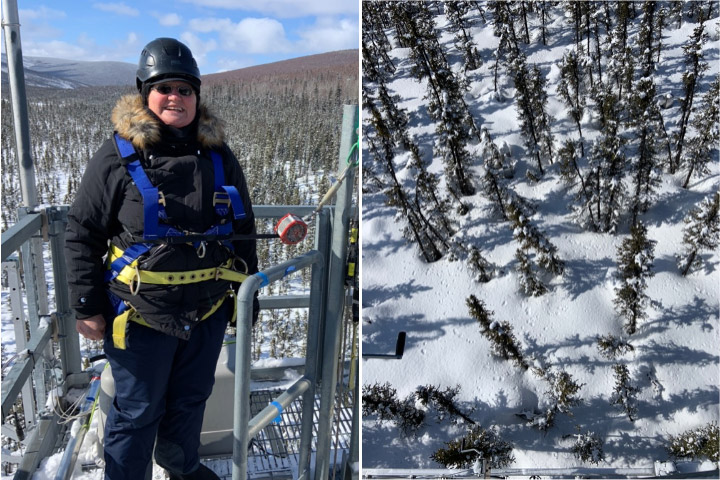
With the help of Jeb Timm, a NEON tower lead technician, we mounted our FLoX (Fluorescence Box) on the top of the tower. The FLoX looks down on the forest and measures the reflected light and solar induced chlorophyll fluorescence every few minutes continuously through the growing season (images below). FLoX measurements are similar to the data satellites provide, but with far more detail.
From the flux data we can determine photosynthesis rates and compare them with our fluorescence and reflectance measurements for relating the remotely sensed optical measurements to forest productivity. The continuous measurements allow us to examine the effects of varying light levels, moisture, and temperatures on the forest.
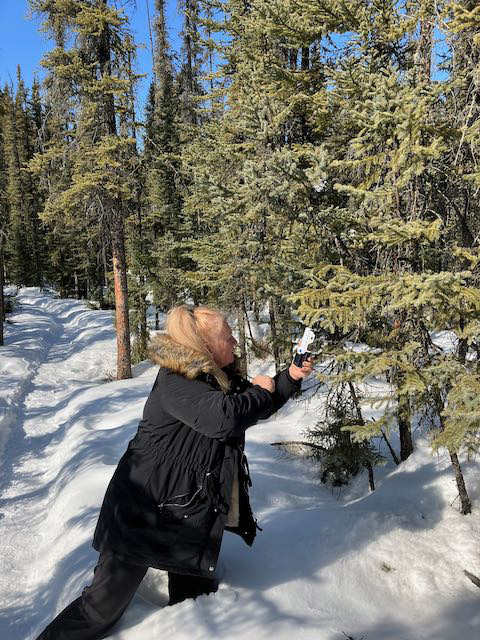
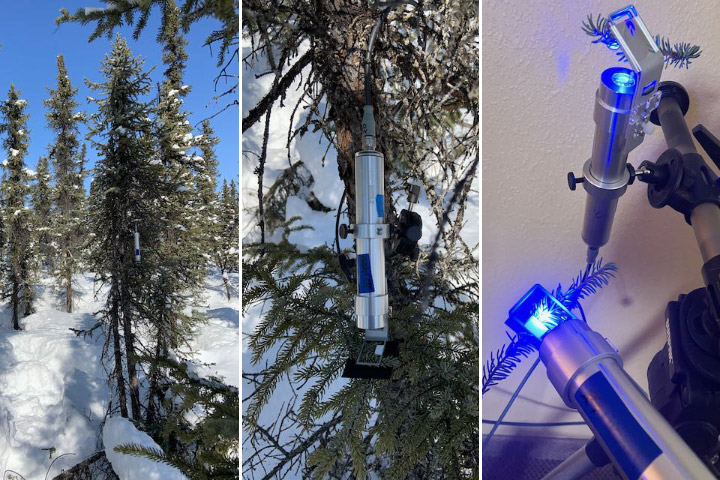
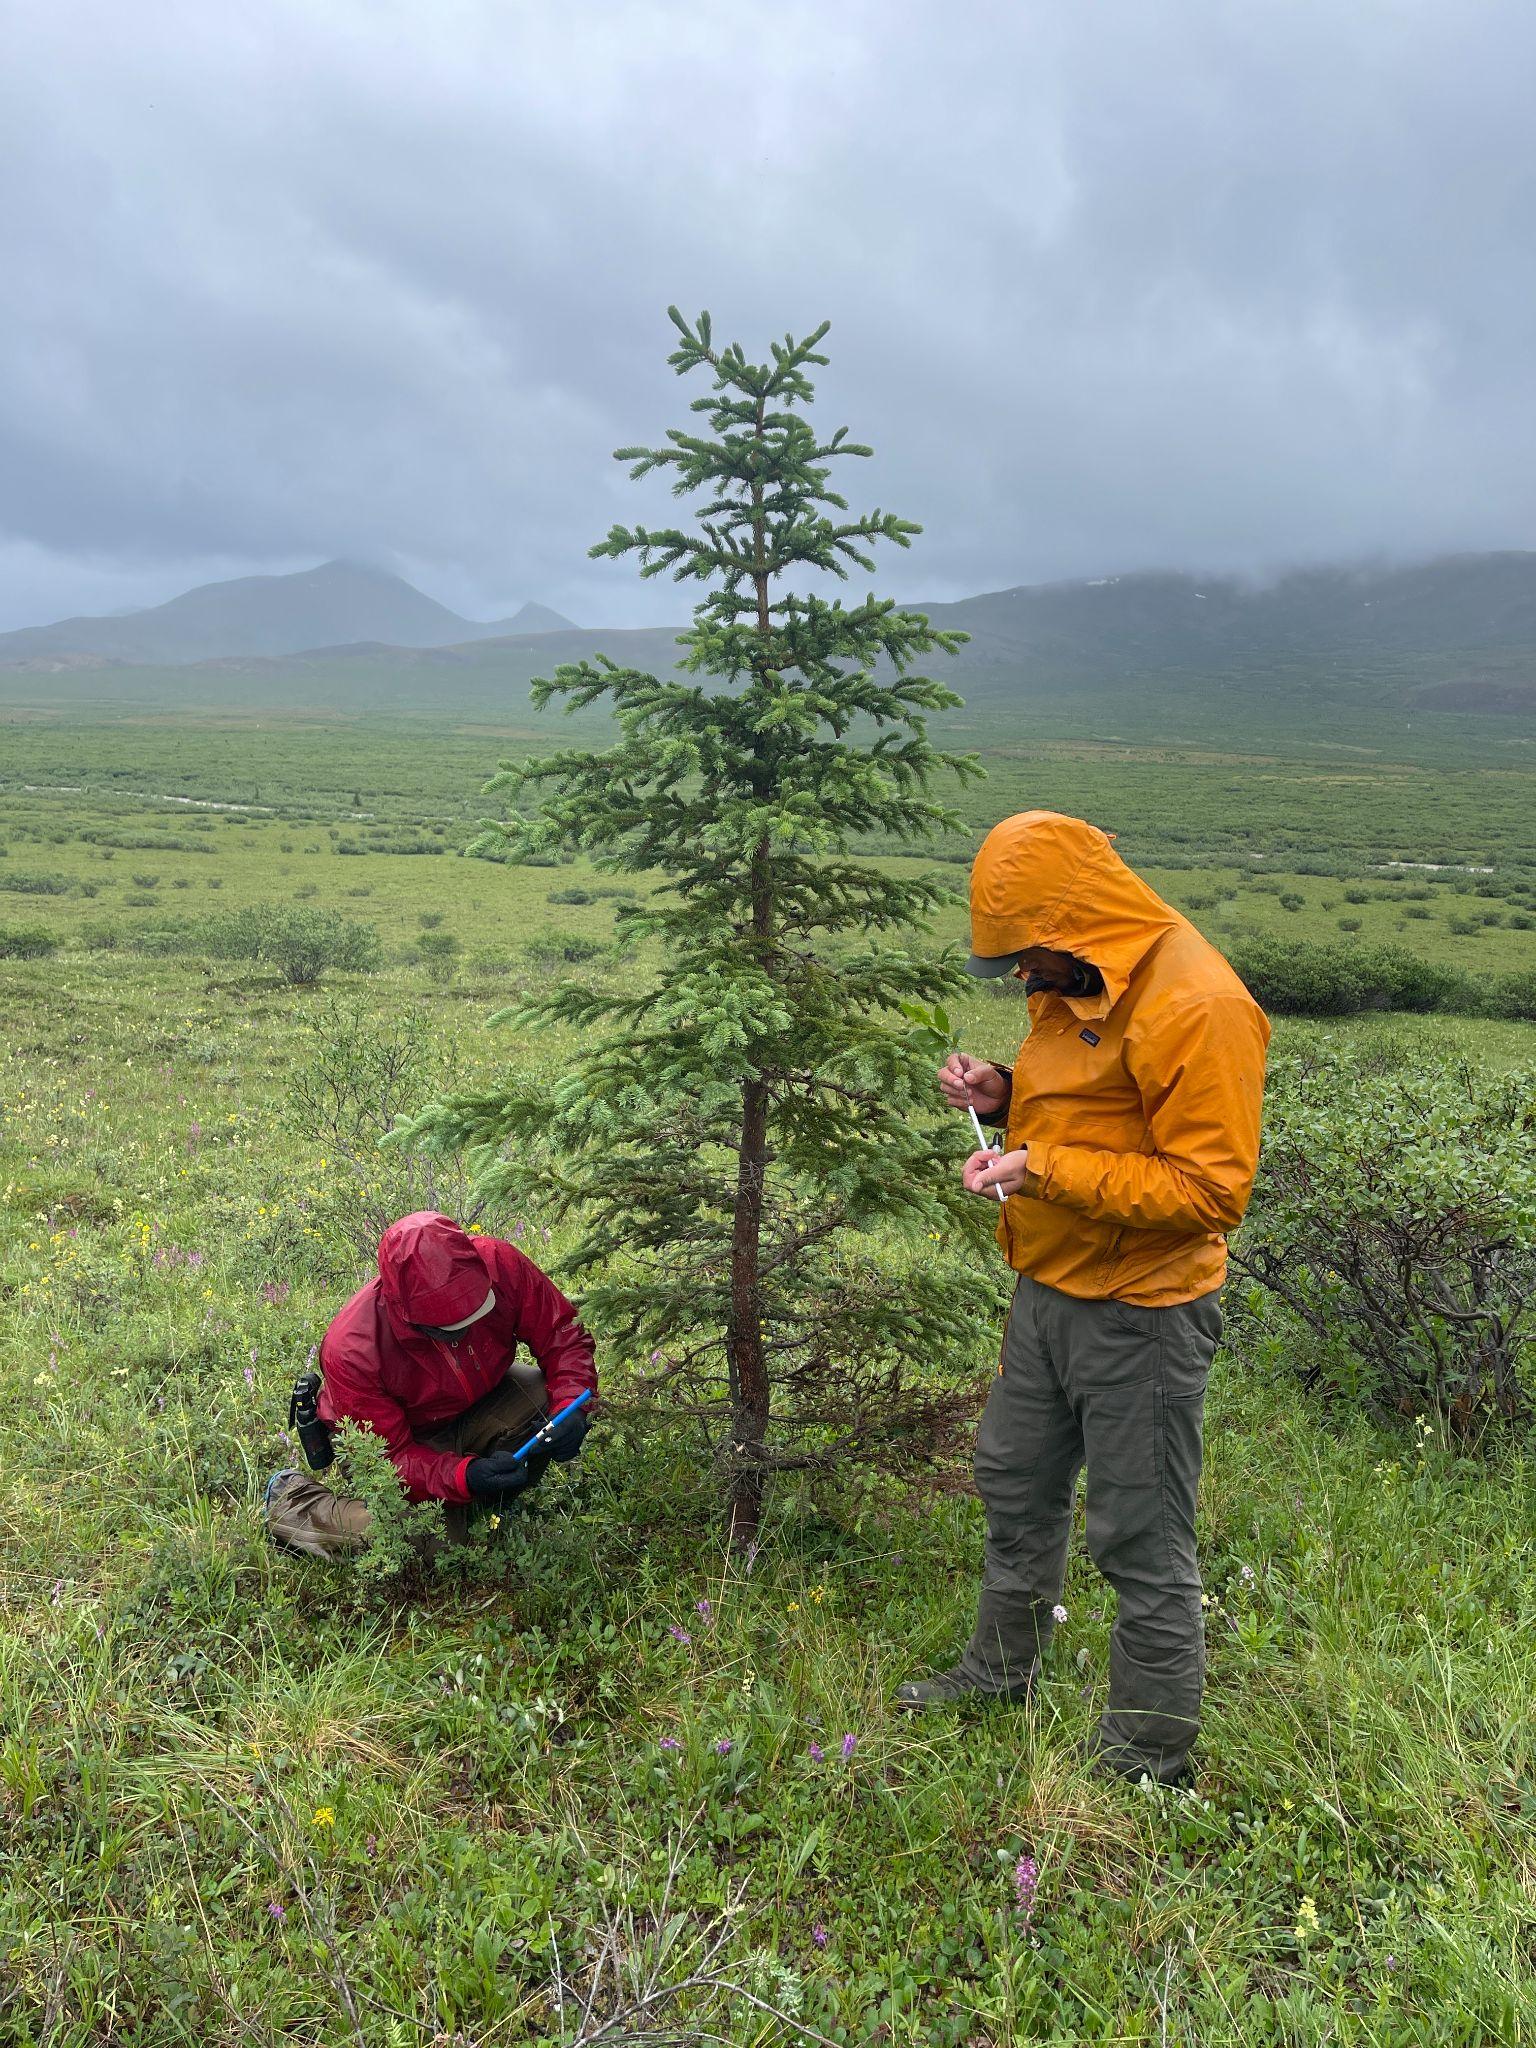
Near the flux tower we also put our MONITORING-PAM (MoniPAM) instruments whose probes actively illuminate individual spruce shoots with controlled pulses of light to measure fluorescence and photosynthetic processes at the leaf level (images below).
Besides setting up our instruments to catch the start of the growing season, we were hoping to be around when the spruce started to photosynthesize. This would allow us to test if we could detect the onset of photosynthesis through changes in needle reflectance due to changing pigment pools and/or fluorescence measured using a special leaf clip. To get consistent measurements using the same amount of needles, we had to pull off the individual tiny needles then line them up to make a solid mat to measure. And because photosynthesis and fluorescence are temperature sensitive, we had to make our measurements at the temperature the needles experience, so we worked on the deck outside in the cold (images below). The deck looked out on a big white spruce that was full of busy red squirrels who chattered and scolded us while we made our measurements.
Unfortunately, the temperatures mostly stayed below freezing the entire time we were there, so we didn’t get a chance to measure needles as they became photosynthetically active.
While we were there, there was also a NASA funded study of snow called SnowEx. In this part of the SnowEx study, researchers were studying changes in snow characteristics during the thaw period. The SnowEx field team made measurements of the snow on the ground, and NASA flew the Airborne Visible-Infrared Imaging Spectrometer – Next Generation (AVIRIS-NG) imaging system on an airplane, collecting high resolution canopy spectroscopy measurements. We plan to make use of the airplane imagery in our study to see if we can identify changes in tree reflectance (which is noise to the snow scientists) indicating the start of photosynthesis.
We will return in late July to collect measurements during the period of peak summer forest productivity.
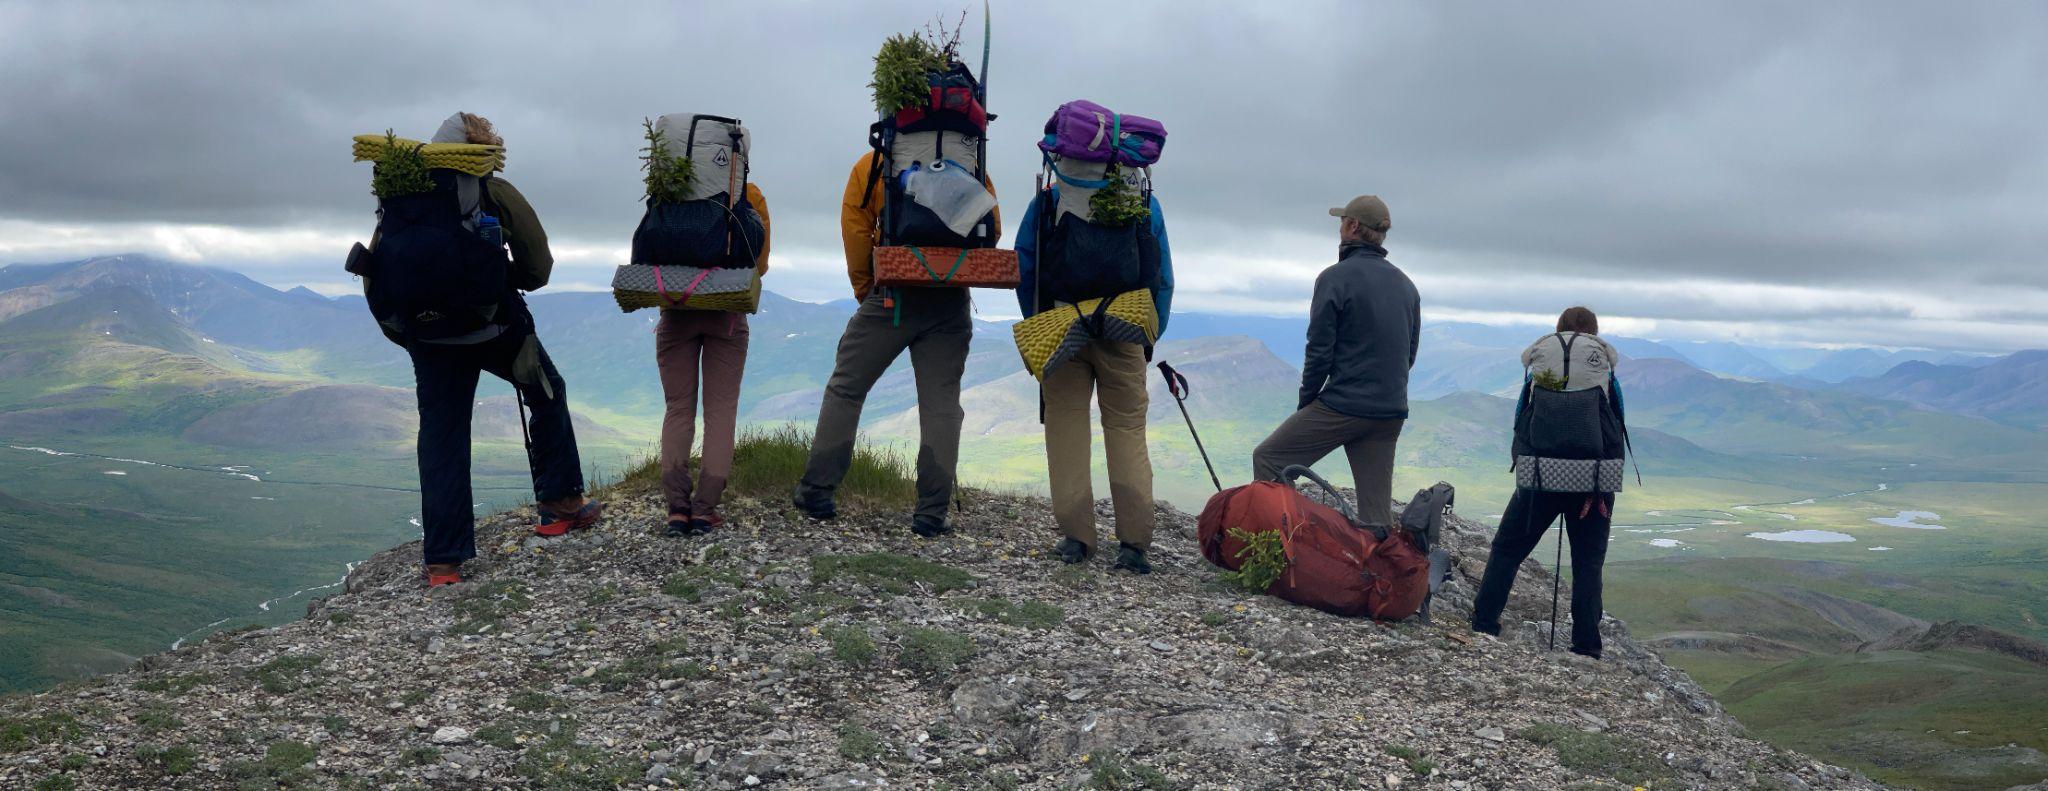
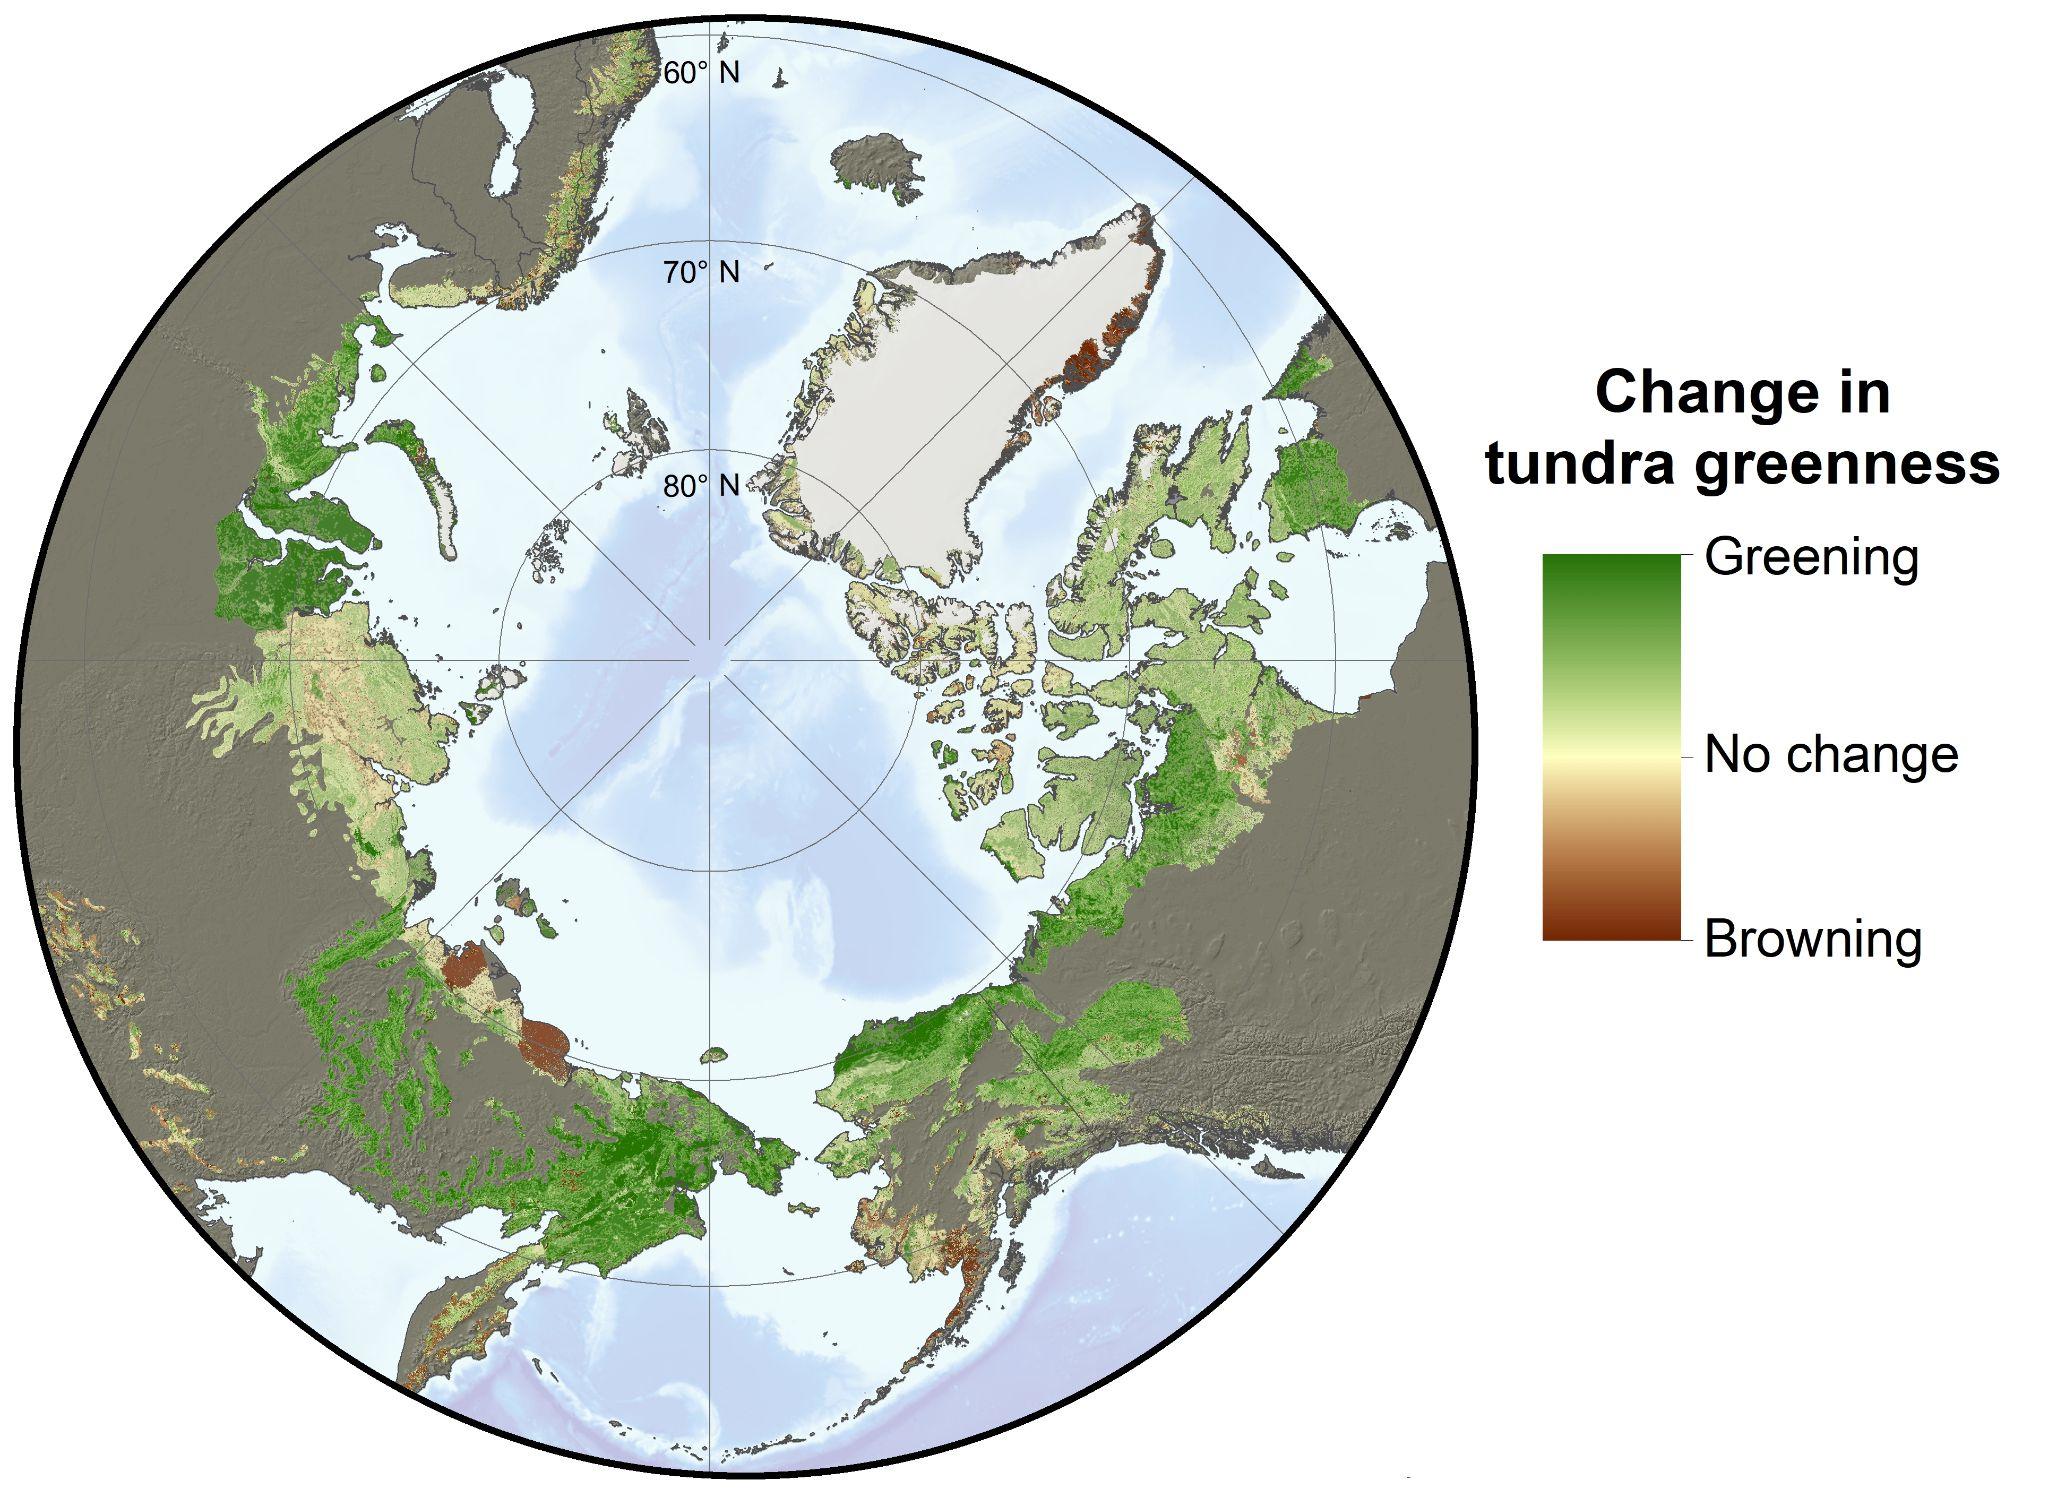
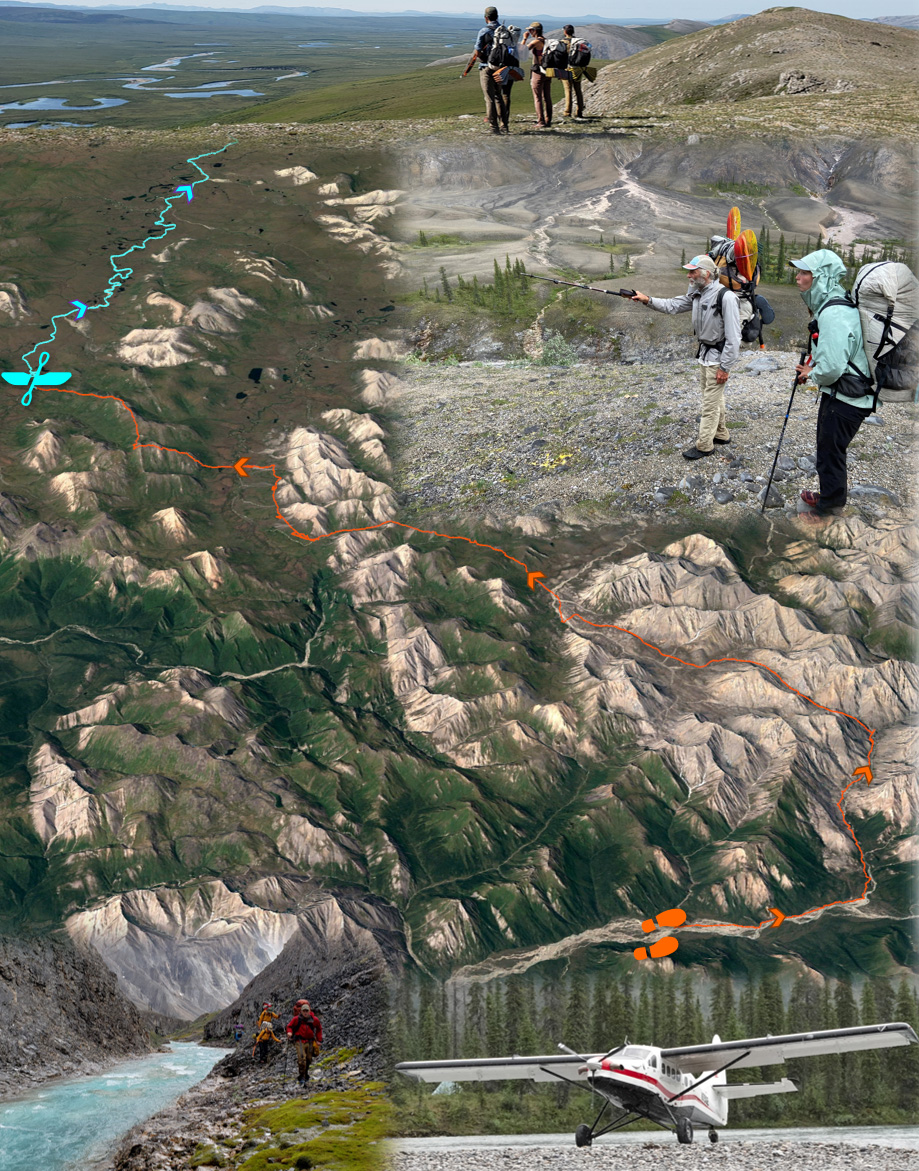
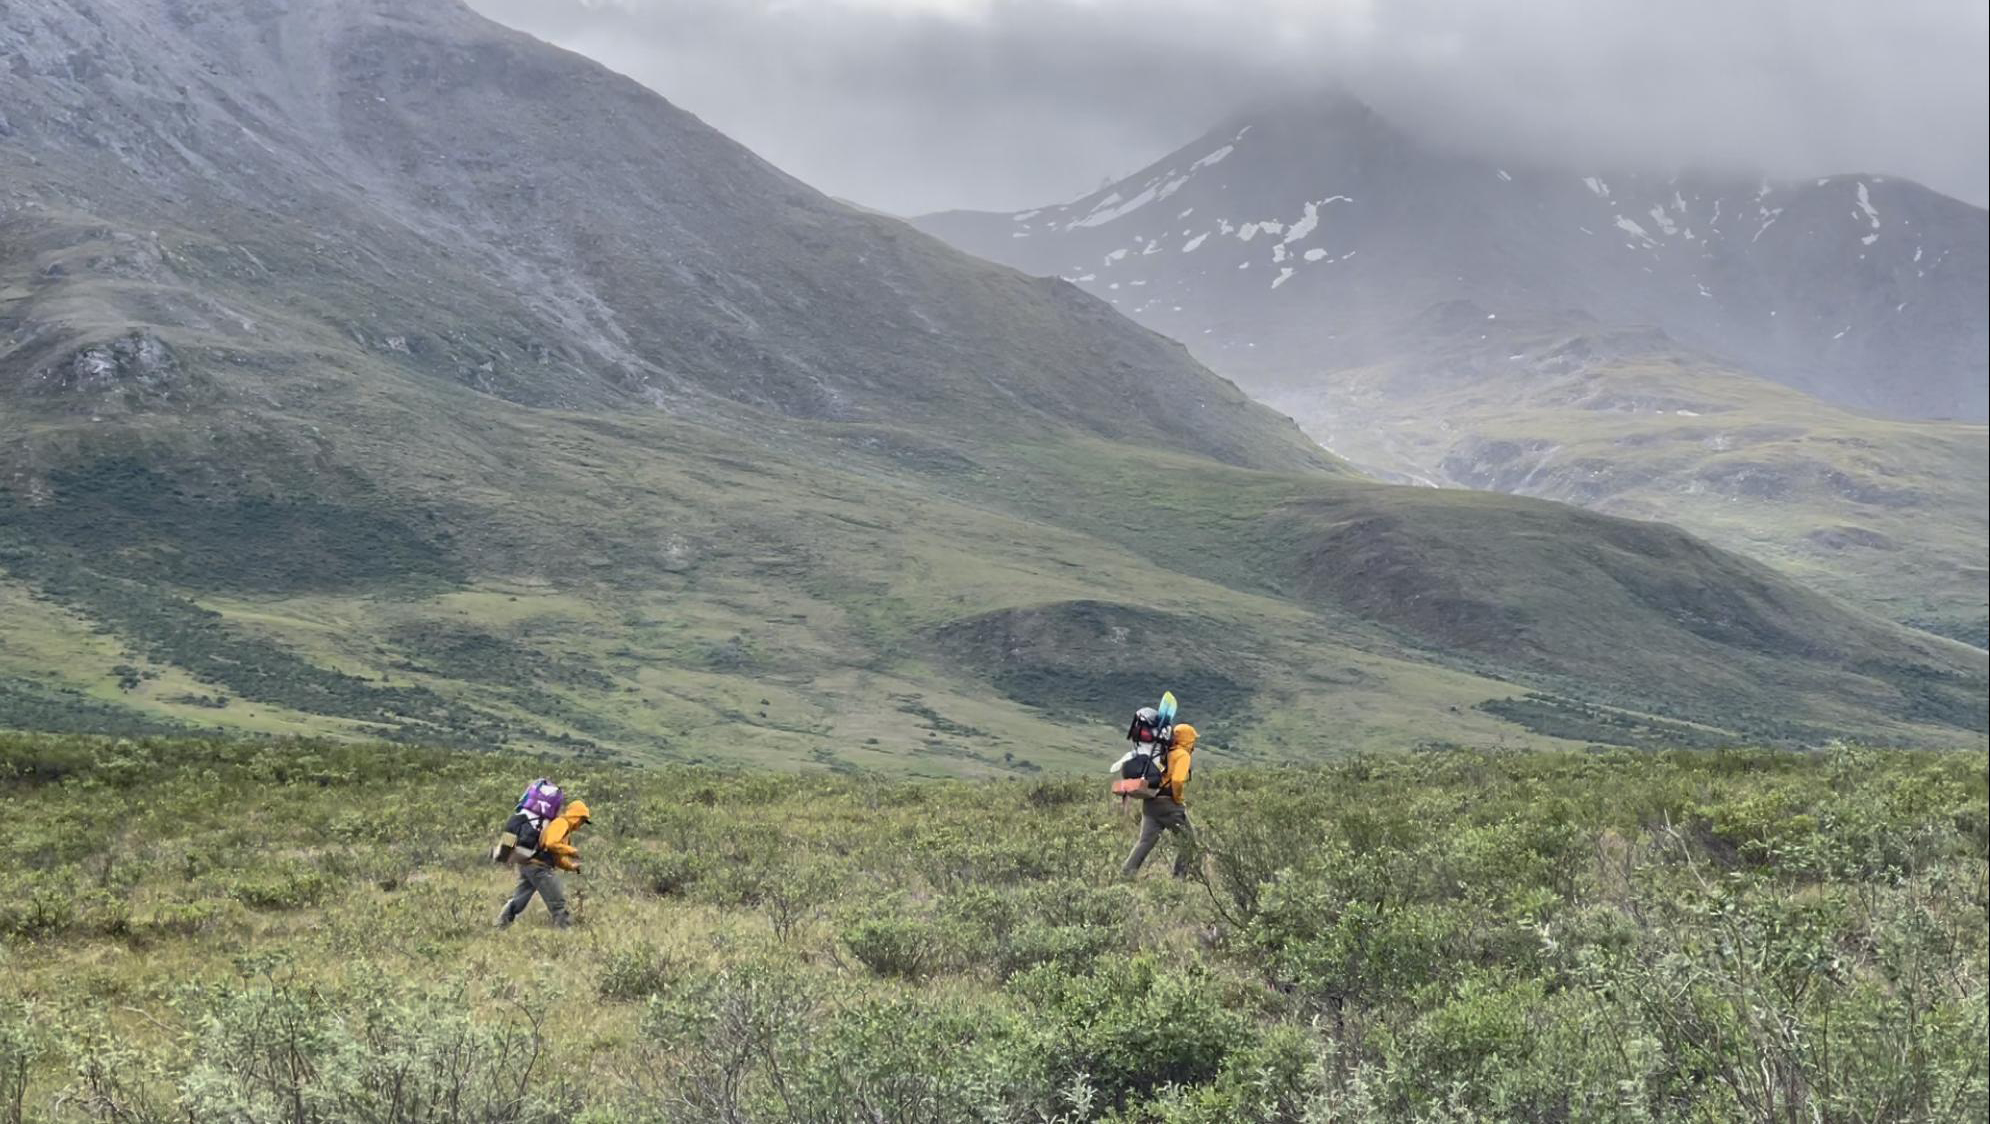
Following caribou and brown bear trails when possible, a small NASA-supported research team trekked 800 miles across Alaska’s Brooks Range last summer. With additional support from NSF, the Alaska Space Grant Program, and the Explorers Club/Discover, the research team is collecting extensive ecological field data that will be linked with satellite observations to better understand long-term changes in vegetation, including impacts of climate warming. The Arctic is warming nearly twice as rapidly as the rest of the planet and the impacts are becoming increasingly evident as glaciers melt, permafrost thaws, and tundra greens.
Earth-observing satellites have detected widespread increases in tundra greenness in the Arctic over the last four decades. The phenomena is caused, in part, by increases in vegetation growth as summers have become warmer and longer, and has been termed “Arctic greening.” On the other hand, satellite observations have also detected localized declines in tundra greenness attributed to surface flooding, extreme weather, and other disturbances. This has been termed “Arctic browning.” Satellite observations of greening and browning show that extensive changes are occurring in the Arctic, but much remains unclear about why specific regions have greened or browned in recent decades.
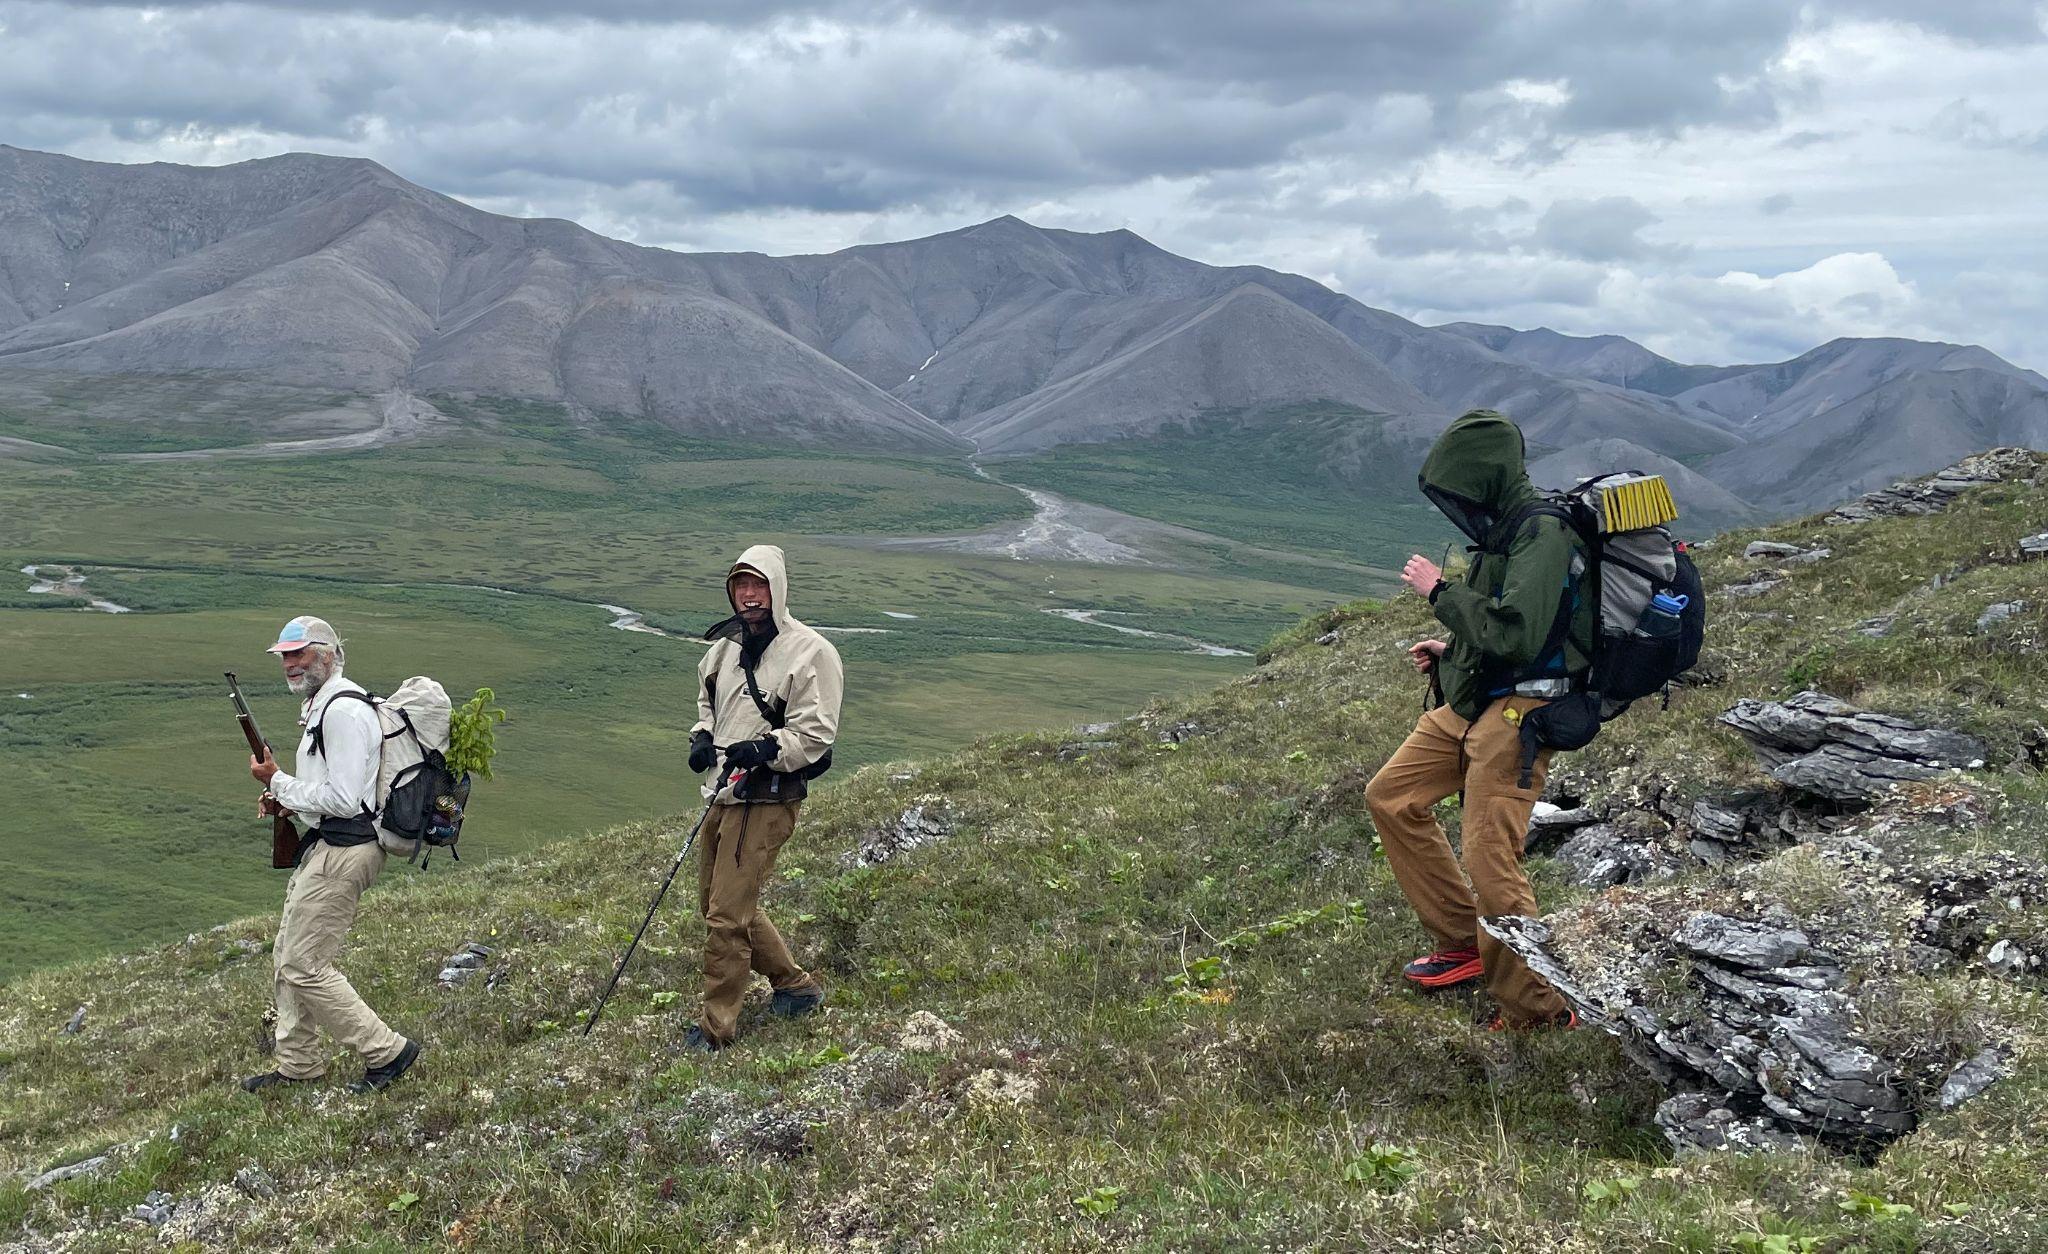
To better understand recent greening and browning in northern Alaska, Professor Roman Dial’s team from Alaska Pacific University (APU) has been collecting extensive ecological observations while trekking throughout Alaska’s Brooks Range. For nearly forty years, Dial has studied and traversed the Alaskan wilderness, including nearly 2,000 miles by foot and packraft throughout the Brooks Range during the last three field seasons. For 11 days last summer, Dial’s team was joined by Dr. Logan Berner and Patrick Burns who are research ecologists from Northern Arizona University (NAU) and members of NASA’s Arctic-Boreal Vulnerability Experiment (ABoVE). While Dial is an expert in field ecology and wilderness travel, Berner and Burns are experts in satellite remote sensing and ecological informatics. By combining their expertise, these researchers hope to shed light on the extent, nature, and causes of vegetation changes during recent decades in the Brooks Range.
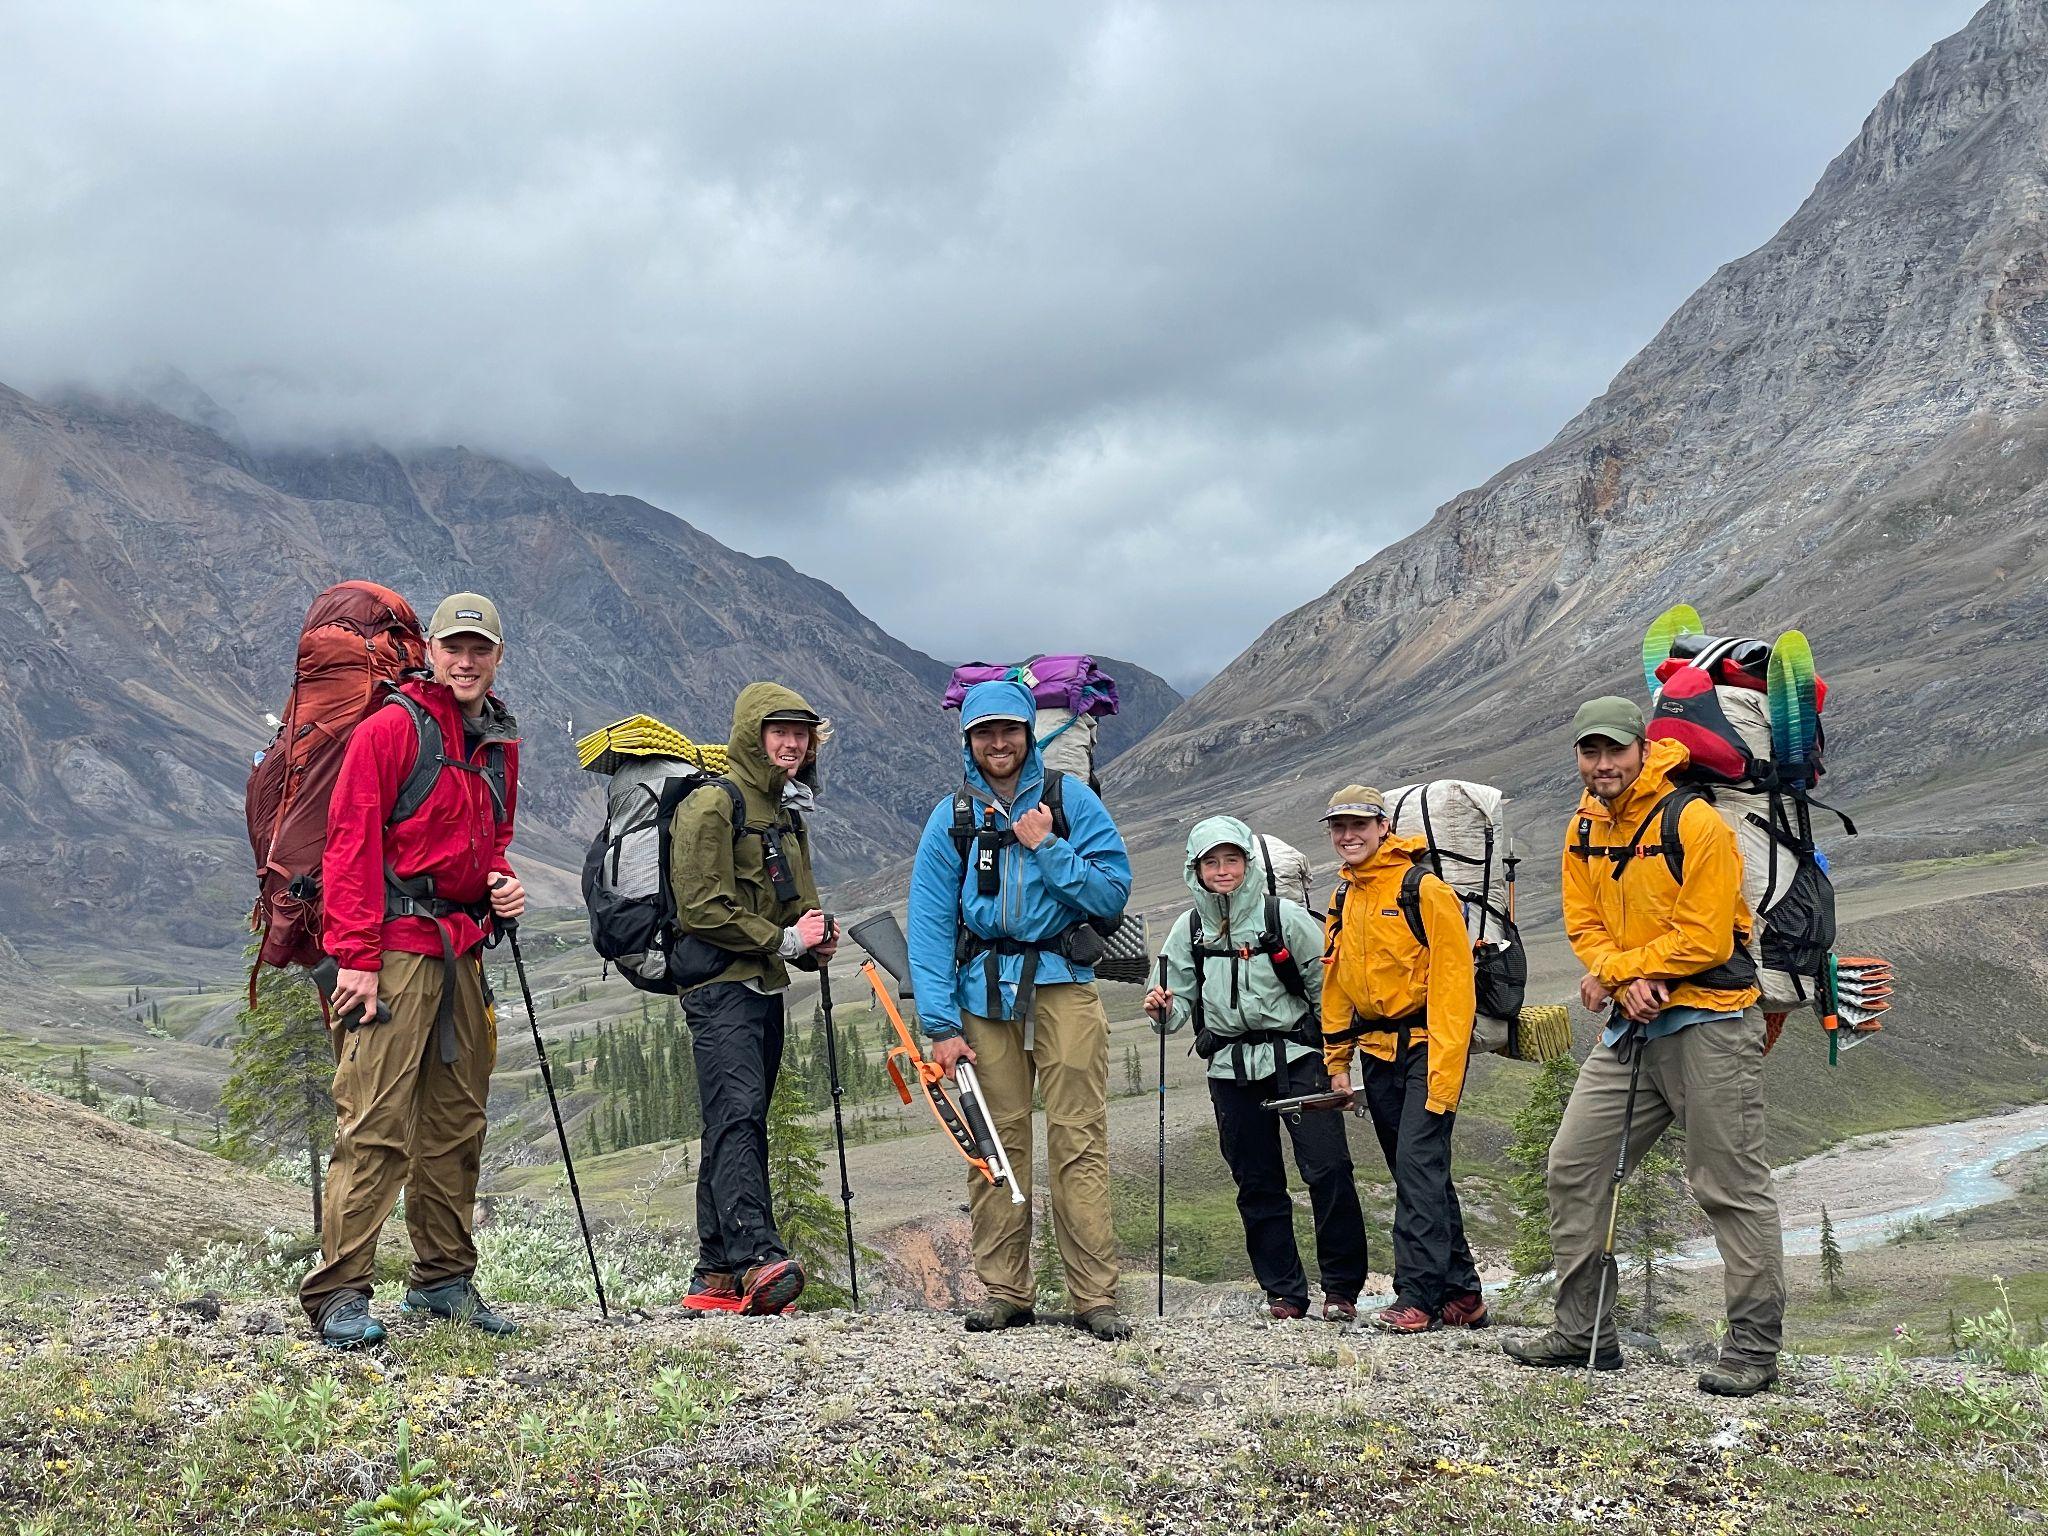
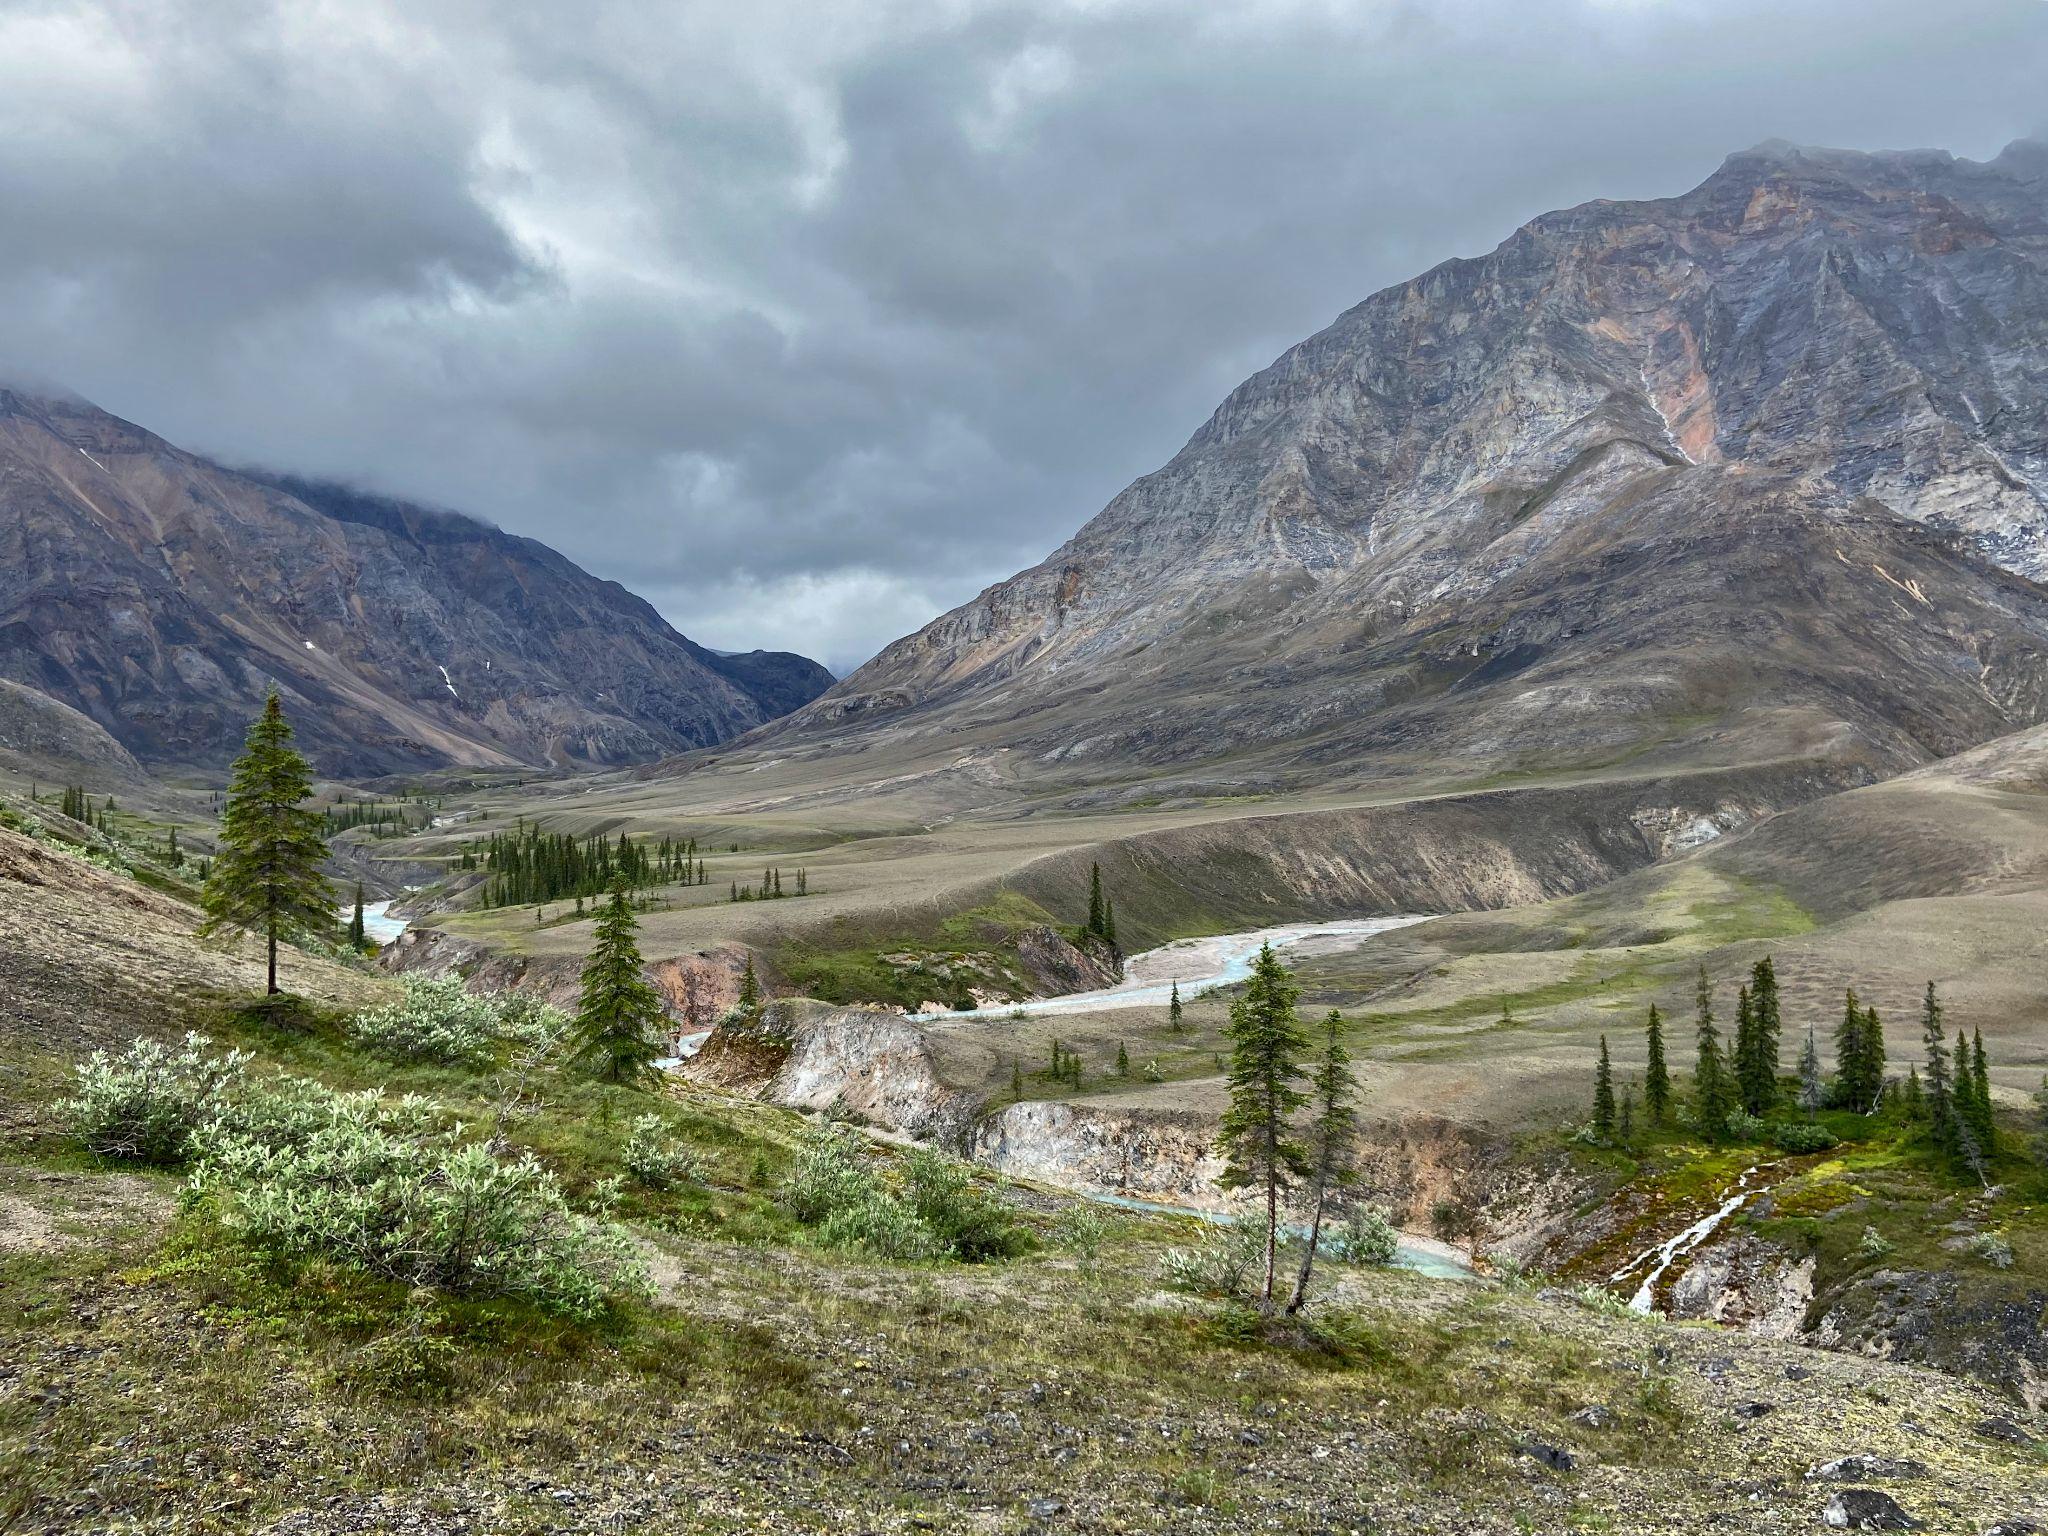
The Brooks Range forms a natural barrier that separates the boreal forest of Alaska’s interior from the arctic tundra of Alaska’s North Slope. This mountain range includes the largest complex of protected wilderness in the United States, including 21,000,000 acres among the Arctic National Wildlife Refuge, Noatak National Preserve, and Gates of the Arctic National Park. Berner and Burns joined Dial’s research team as they trekked from the northern edge of boreal forest into the Noatak Wilderness where trees give way to thickets of shrubs, wetlands, and barren rocky ridges. During the course of 11 rain-soaked days, the team followed caribou and brown bear trails through verdant valley bottoms and over cloud-choked mountain passes as they traversed about 80 miles from the Ambler River to the Cutler River. While trekking, the researchers collected ecological field data to be linked with measurements of vegetation greenness from NASA Earth-observing satellites.
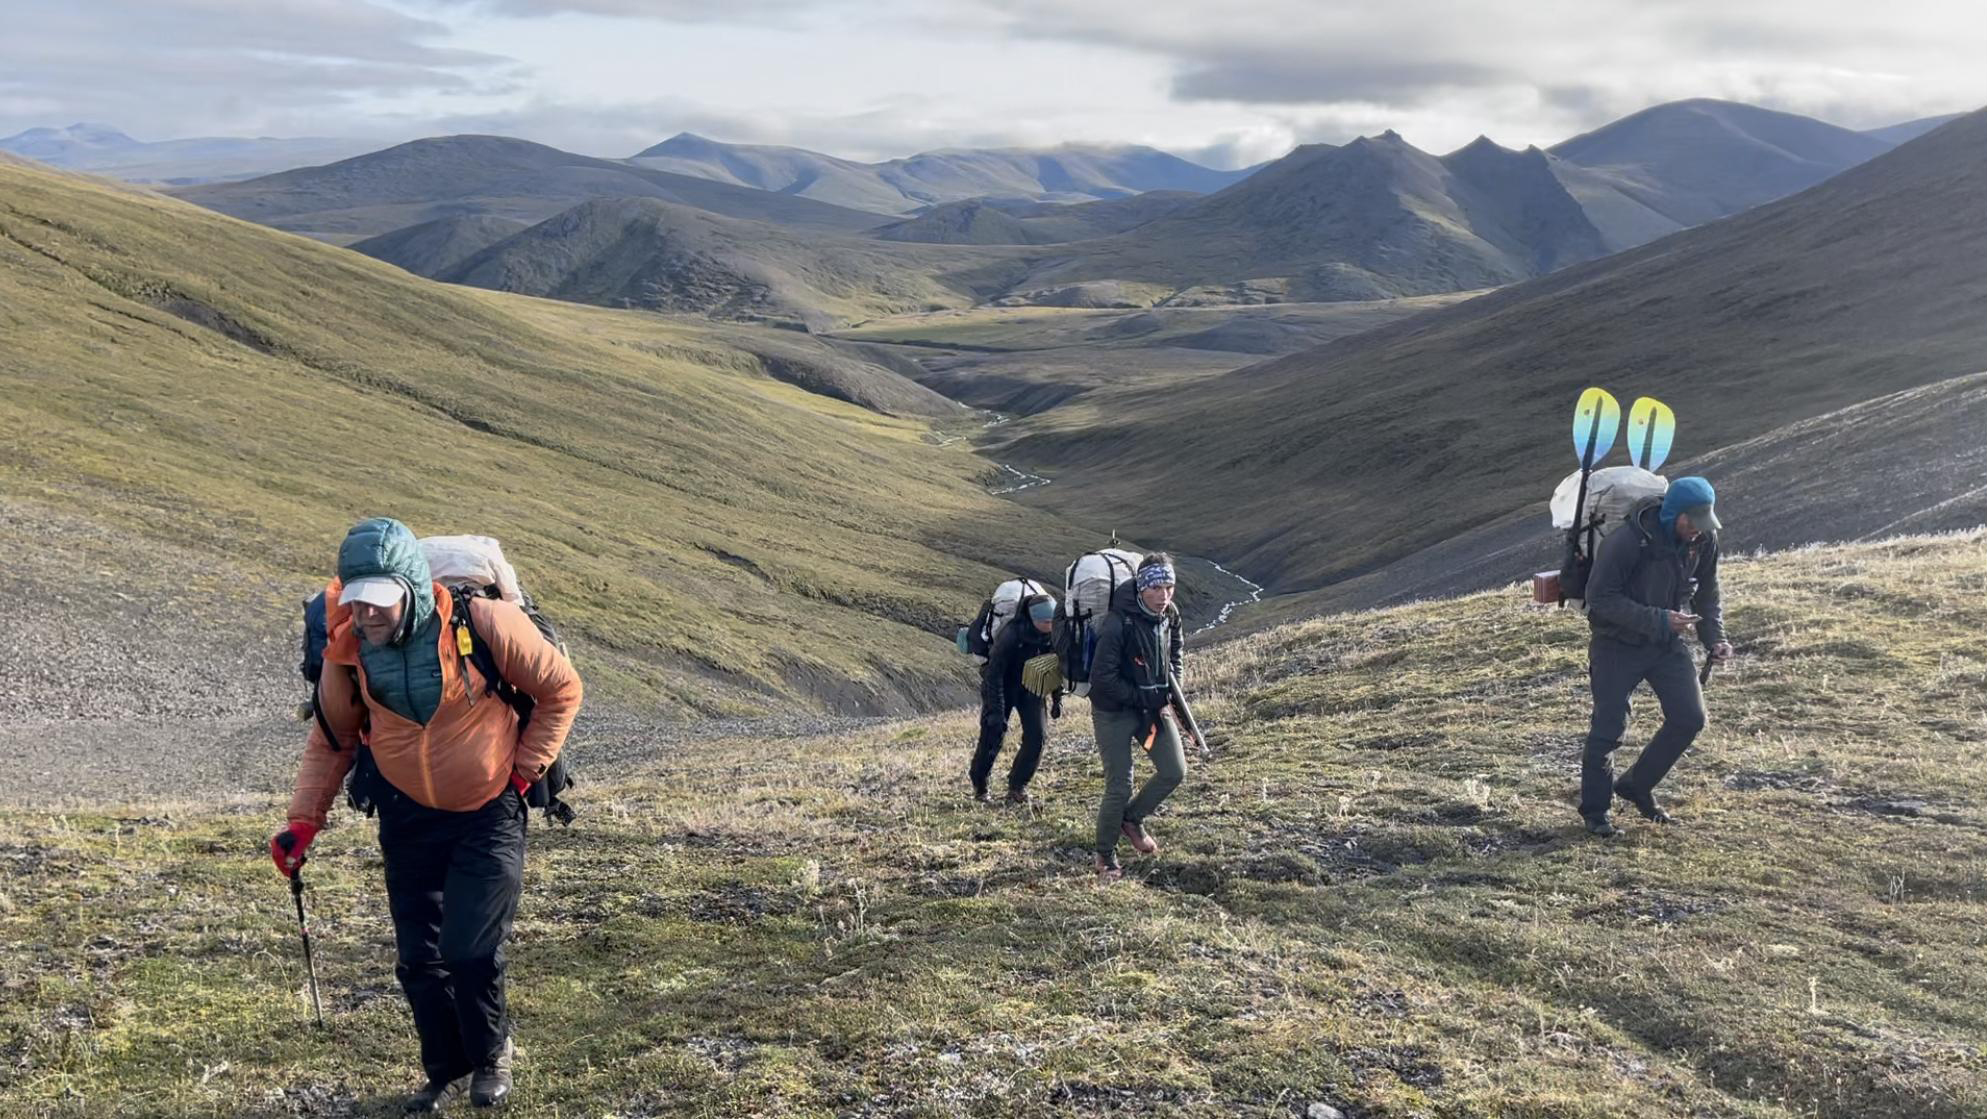
Ecological research often involves establishing field plots and then meticulously characterizing the composition and other attributes of the plant community in each field plot. Plot sampling provides valuable information, but the time consuming nature of the approach limits the spatial extent over which measurements can be made. Dial recognized that to better understand recent greening and browning, there is a need for more spatially extensive information on plant community composition than can be provided by field plots alone. He thus has pioneered an alternative approach that involves continuously documenting plant community composition and other attributes while trekking across the landscape. Termed “pixel-walking”, this approach harnesses the multifunctionality of smartphones to record and geolocate visual observations of vegetation composition and density for the overstory, midstory, and understory. While pixel-walking, researchers record a new observation every time they visually detect a change in vegetation composition or density at about a 30 meter spatial scale, corresponding to one pixel from the Landsat satellites. These spatially extensive field observations are thus collected with the explicit goal of being linked to decades of Landsat satellite observations.
During summer 2021, Dial’s research team pixel-walked over 800 miles from east to west through the Brooks Range, collecting data on vegetation composition for about 100,000 Landsat pixels. Over the coming year, Dial’s team will work with Berner, Burns, and Professor Scott Goetz (ABoVE Science Team Lead) at NAU to link these extensive field data with several decades of Landsat satellite observations provided by NASA. This collaboration will help unravel the mysteries of Arctic greening and browning by shedding light on where, how, and why plant communities changed in recent decades. NASA’s Earth-observing satellites provide long-term observations that are crucial for monitoring and understanding ongoing environmental changes in the rapidly-warming Arctic, especially when complemented by field data collected across large regions.