In loving memory of Larry Corp.
Goddard’s LiDAR, Hyperspectral, & Thermal Imager (G-LiHT) is an airborne instrument designed to map the composition of forested landscapes.
The G-LiHT instrument has a number of sensors that each serve a specific purpose. There are two LiDAR sensors that produce a series of LiDAR-derived forest structure metrics including a canopy height model, surface model, and digital terrain model. These models allow us to measure tree height and biomass volume.
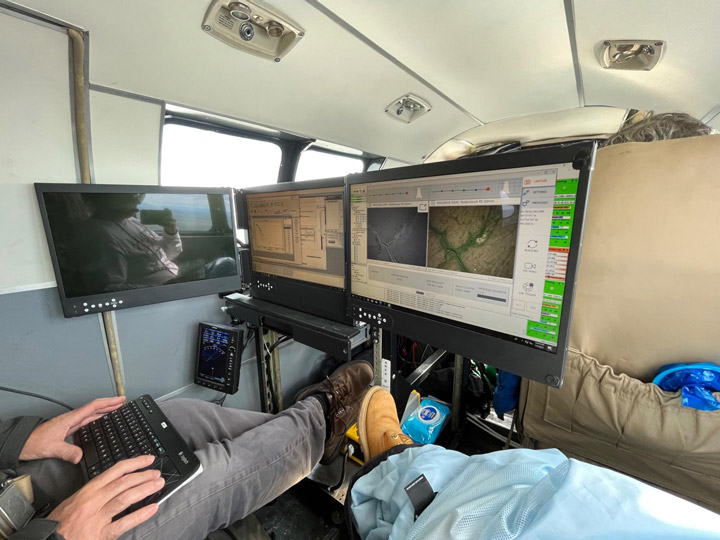
Additionally, there are two cameras: one visible and one near-infrared (NIR). The visible and NIR bands acquired by the two cameras are paired to produce 4-band imagery. The 3-centimeter resolution photos taken by these cameras are aligned to build orthomosaics, which allow us to visually observe and identify changes in forest composition.
G-LiHT also has a hyperspectral sensor to acquire spectral information at a coarser resolution. These data can be used to identify vegetation composition and measure photosynthetic function as well as calculate vegetation indices at a fine spectral scale of 1 meter using radiometrically calibrated surface reflectance data.
The thermal sensor measures radiant surface temperature which allows us to create 3D temperature profiles derived from structure-for-motion. Thermal data provides us with information on the functional aspects of forest canopies. As photosynthetic function is related to evapotranspiration, we can observe that hotter canopies are more stressed relative to surrounding canopies.
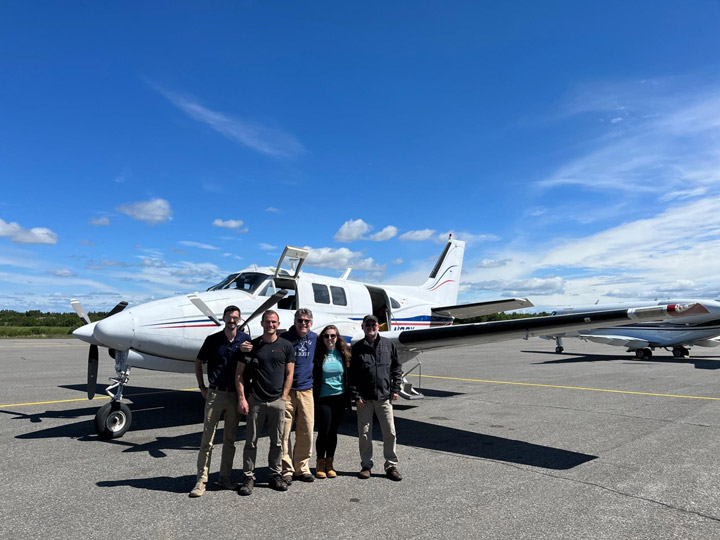
The G-LiHT airborne mission supports multiple groups including the U.S. Forest Service (USFS), the USFS Geospatial Technology and Applications Center (GTAC), and the University of Alaska Anchorage.
The USFS is creating a forest inventory for the state of Alaska, and G-LiHT measurements collected over Forest Inventory and Analysis (FIA) plots are a cost-effective method of forest inventory. G-LiHT data will also help to improve regional estimates of aboveground forest biomass and terrestrial ecosystem carbon stocks. GTAC uses G-LiHT data measurements for algorithm development. USFS Geospatial Technology and Applications Center will use G-LiHT data acquired over FIA- and GTAC-measured ground plots and between these plots to map forest characteristics on federally managed lands, including forest type, biomass, vegetation structure, tree and shrub cover, and more. Data will also be used to guide future inventory efforts in coastal Alaska using methods developed for interior Alaska.
This field campaign also acquired repeat data over Fairbanks, Alaska, to measure changes in permafrost.
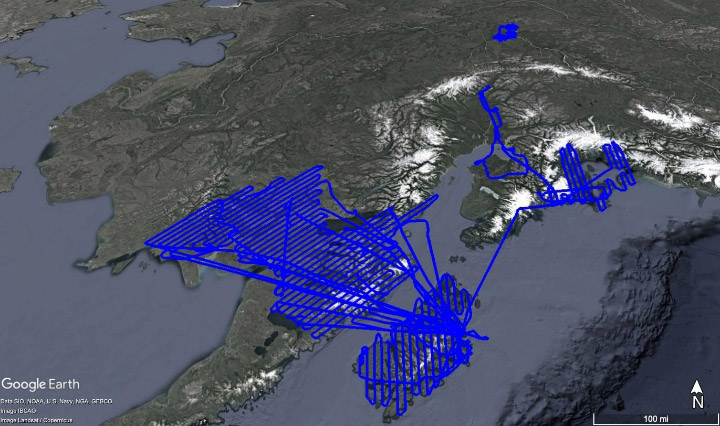
G-LiHT image data was reacquired over spruce beetle monitoring transects stretching from the Kenai Peninsula in the south to Denali National Park in the north. These transects were last measured on the ground and with G-LiHT in 2018, during the peak of a spruce beetle outbreak, and changes in vegetation structure and spectral reflectance will be used to evaluate the long-term mortality and growth of these forests.
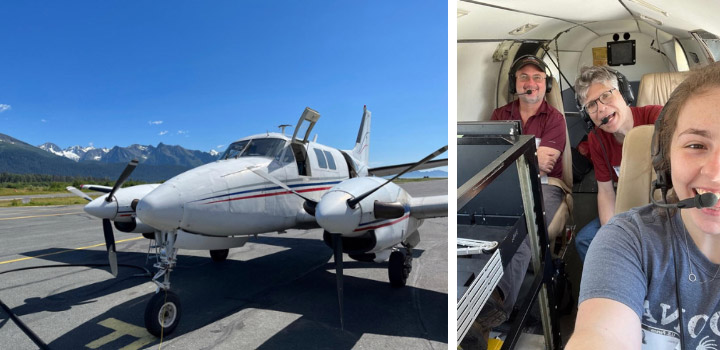
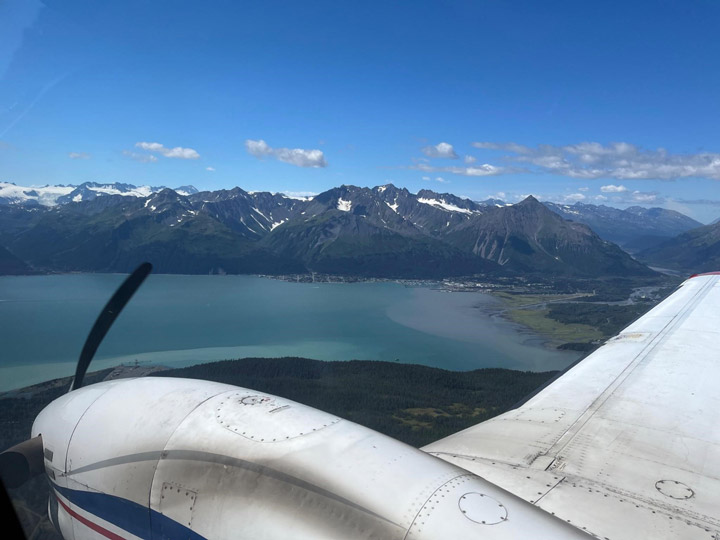
Our Alaskan field campaign started with an integrative test flight in June. Our team of three loaded up G-LiHT into a vehicle much too small and drove to Dynamic Aviation in Bridgewater, Virginia. We spent the first day installing the instrument into a 1960s King Air A90.
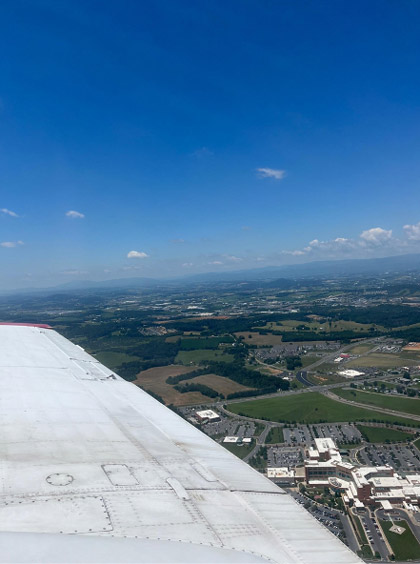
The second day was all about flying. We needed to make sure G-LiHT didn’t interfere with any of the aircraft’s systems. Additionally, the functional test flight over Harrisonburg, Virginia, allowed us to verify that G-LiHT was functioning properly. We flew in a grid pattern over the city which allowed us to geospatially align the data products from all of G-LiHT’s sensors.
The integrative test flight was a success. We installed G-LiHT properly with no issues and obtained the information we needed. Once we received the thumbs up to proceed with our campaign, the pilots loaded up the plane with supplies and headed out to Kodiak, where we would meet them the following week.
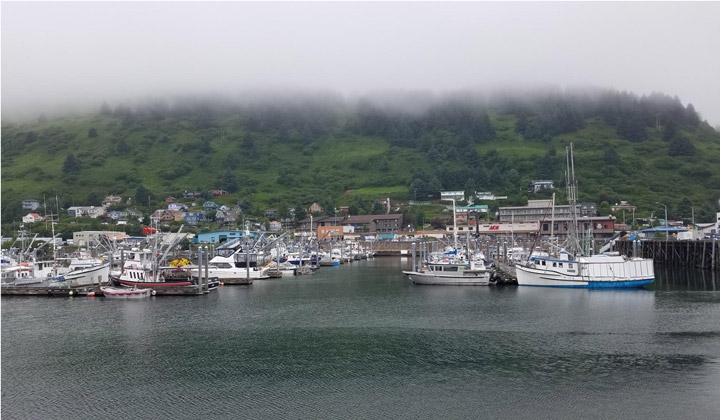
Our plan for the field campaign was to arrive in Kodiak, Alaska on July 6 and stay until the end of the month. We chose Kodiak as our hub because it was a convenient location to our flight lines. Unfortunately, despite the ideal location, poor weather prevented us from flying for the first three days of the campaign.
Once we were finally able to get in the air, we collected data over the forests near Iliamna.
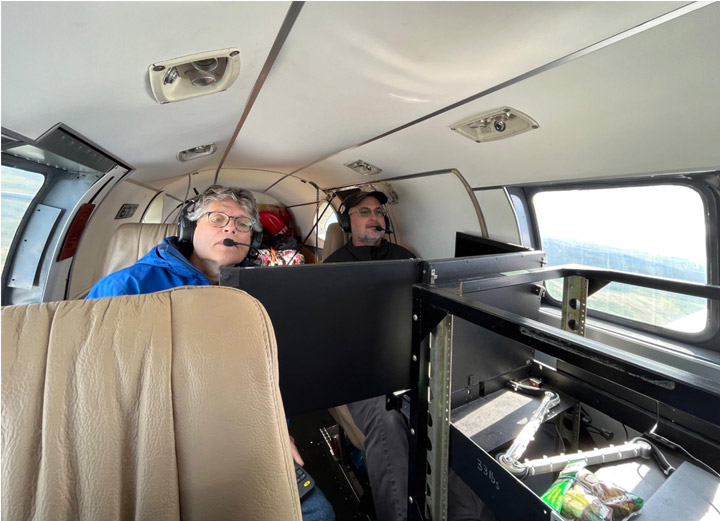
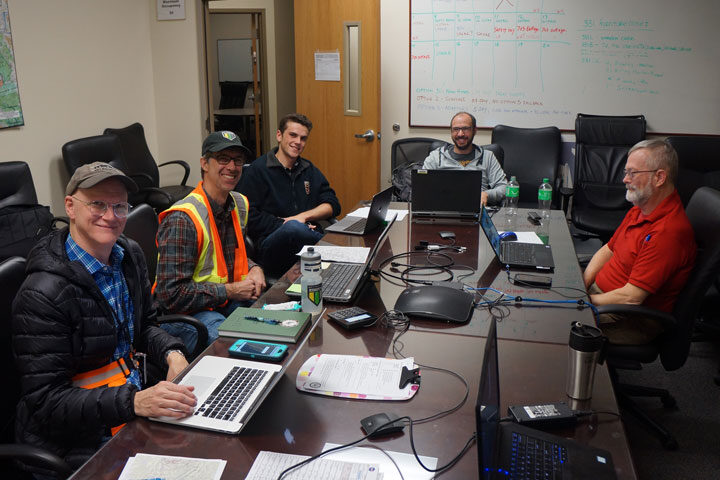
Most of our days consisted of our team meeting in the hotel for breakfast at 8 a.m., discussing weather and flight plans for the day, and then driving to the airport to prepare the plane and G-LiHT for flying. Depending on how many flight lines we were able to complete, we often stopped in King Salmon or Iliamna to refuel the plane and then went back out to fly more lines before returning to Kodiak.
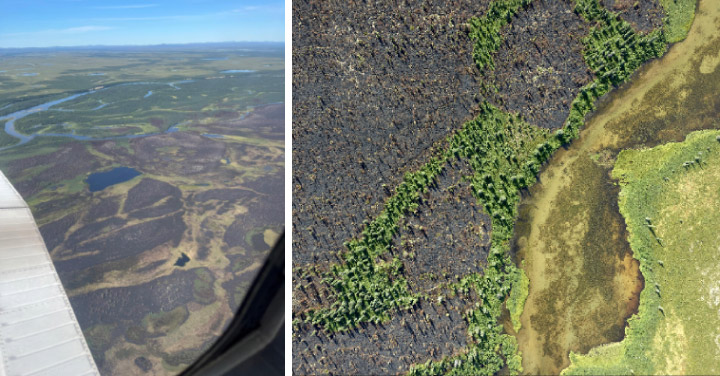
Our group was interested in measuring the effects of forest fires on vegetation in the Dillingham region. There were several burned areas to the west of the Nuyakuk River and east of Cook Inlet.
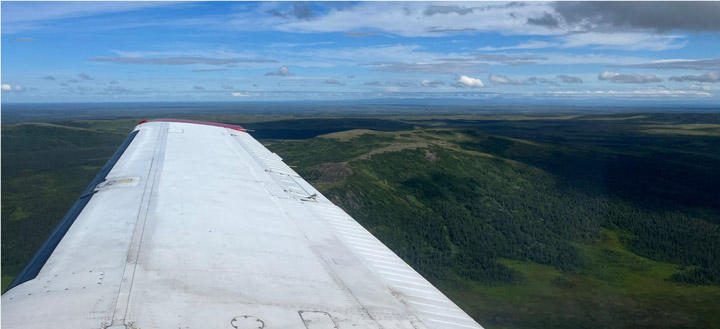
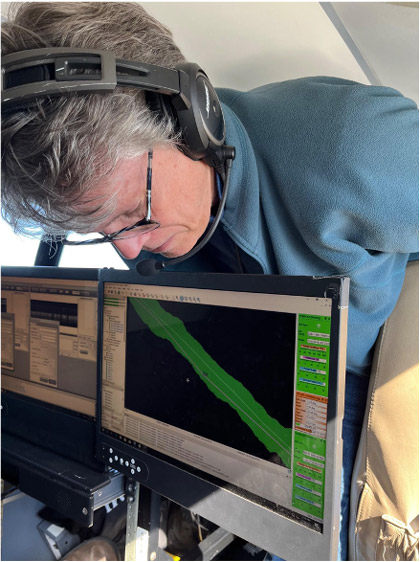
Toward the end of the campaign, we decided to transit to Fairbanks because the weather over the rest of our other flight lines didn’t look promising. If there were clouds below the plane at 1,100 feet, they would obstruct the instrument’s view and cast shadows on our data. We had to closely monitor the weather every morning. Additionally, we were unable to fly in rain or smoke as it would adversely affect the LiDAR sensors’ data returns.
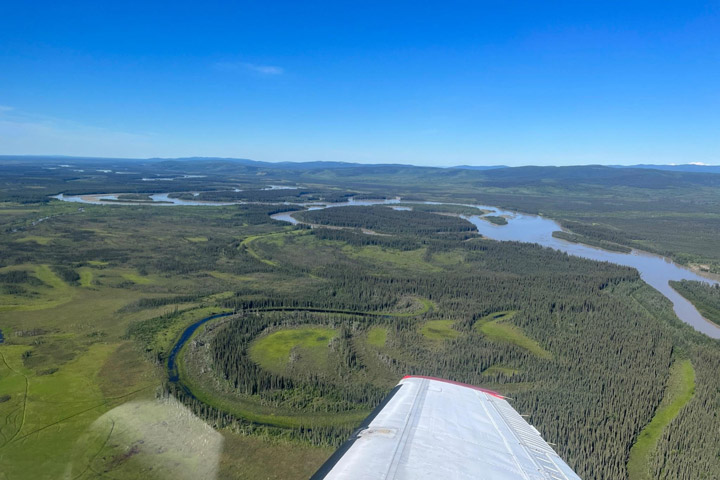
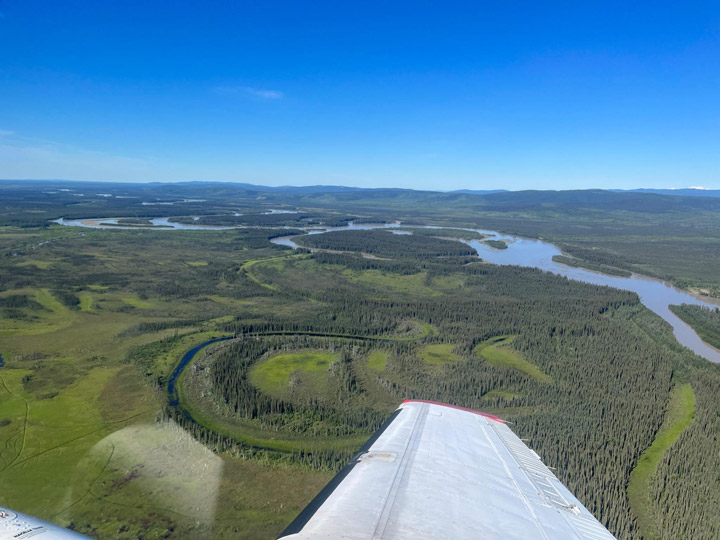
One geological feature we saw extensively in the southwest was the oxbow lake. Also called cut-off lakes, these lakes have formed when meandering rivers erode at points of inflection because of sediments flowing along them to the point where two parts of the river will join together, creating a new straight part of the river—essentially “cutting off” the curved lake piece. This created an oxbow lake. Once the lake has fully dried out, it becomes a meander scar. We noted the difference in vegetation growing back within the oxbow lakes and meander scars and how this differs from surrounding vegetation patterns.
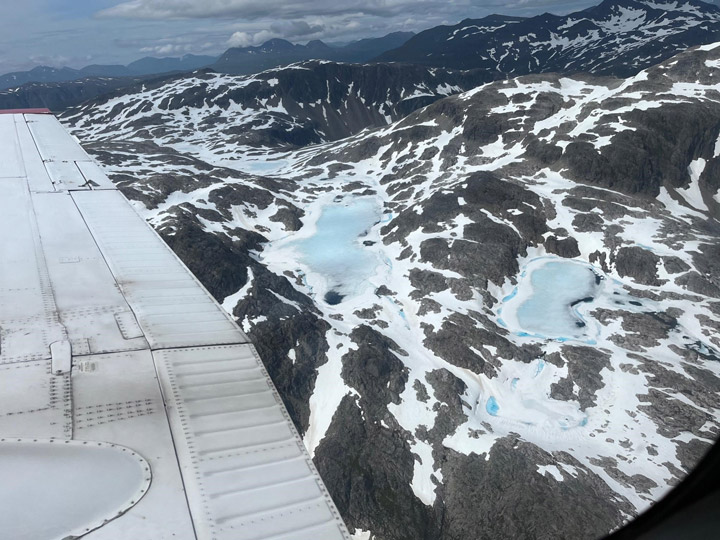
We had only planned to spend one night in Fairbanks, then transit back to Kodiak the following day. However, the weather had other plans for us. We ended up having to fly to Anchorage the following day because of extremely low cloud ceilings in Kodiak that made it too dangerous to land there. It worked out in the end, and the team was able to see more of beautiful Alaska and collect data over Anchorage and the Chugach region. It just goes to show how quickly things can change during a field campaign.
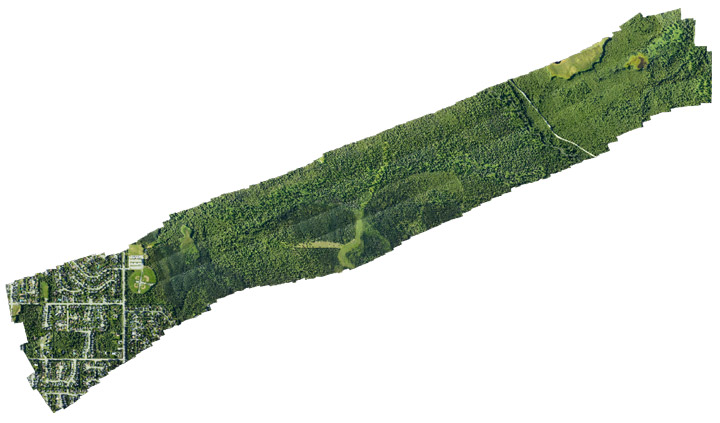
We collected data in the Campbell Creek region west of Anchorage. The data include visible and near-infrared photos which were composited into 4-band high-resolution orthomosaics and used to visually observe and identify changes in forest composition.
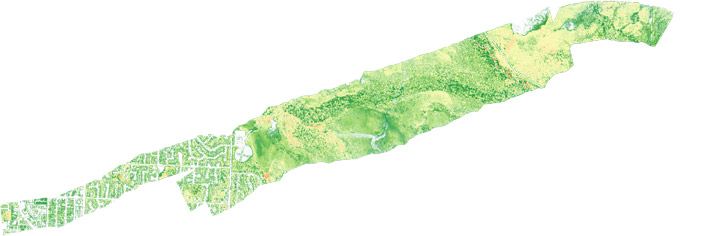
In addition to the high-resolution orthomosaics produced from the G-LiHT’s near-infrared and visible cameras, LiDAR data was processed to create various 1-meter resolution forest structure metrics including Digital Terrain Model (DTM), Digital Surface Model (DSM) and Canopy Height Model (CHM). These metrics are used to measure tree height and biomass volume. The CHM raster below was created by subtracting the DTM from the DSM.

After collecting data in Anchorage and the Chugach region of Alaska, the team flew back to Kodiak and finished data acquisition in the southwest.
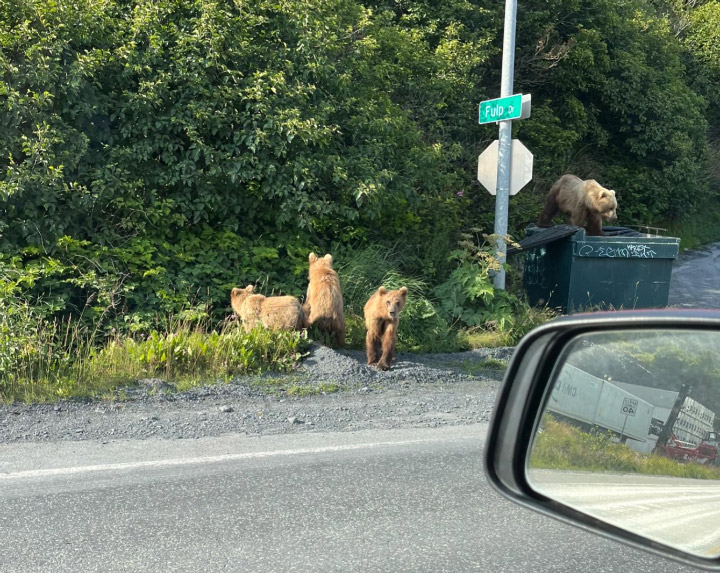
And of course it wouldn’t be Alaska without some wildlife. The day before leaving Kodiak, I got to see not just one bear—but a family of four! Cars were honking to scare the bears out of the road, but luckily I had enough time to snap a picture before the bears ran off into the woods. It was the perfect end to an exciting field campaign.
For students who want to take atmospheric science as literally as possible, it doesn’t get much better than flying in a NASA aircraft.
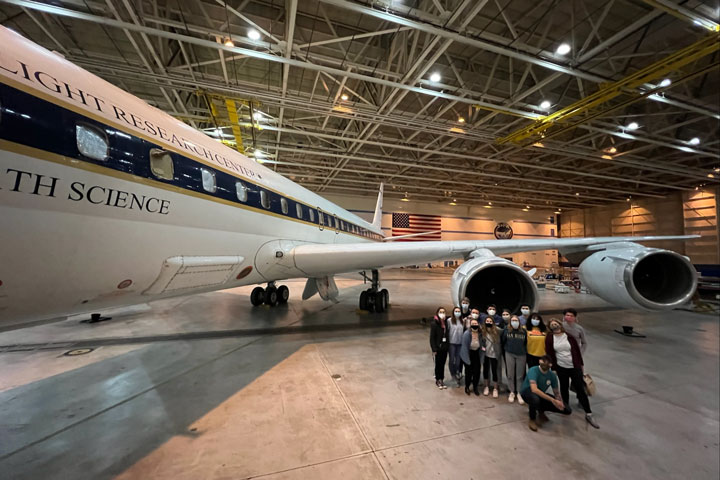
Each year, the Student Airborne Research Program (SARP) invites a team of rising college seniors to Armstrong Flight Research Center in Southern California to conduct research aboard NASA’s airborne science fleet. Each aircraft is equipped with instruments for land, ocean, and atmospheric research–enabling sample collection and imaging over the Earth’s surface. After operating the instruments in-flight, participants are then able to use the resulting data for their own individual research projects.
…as soon as they recover from the air sickness, of course.
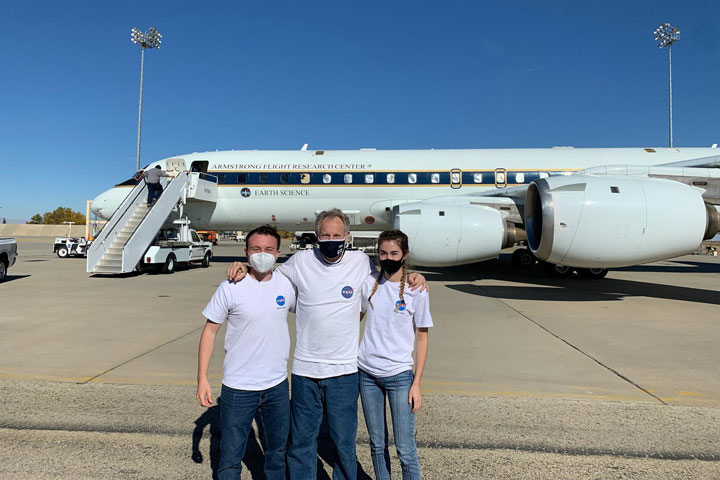
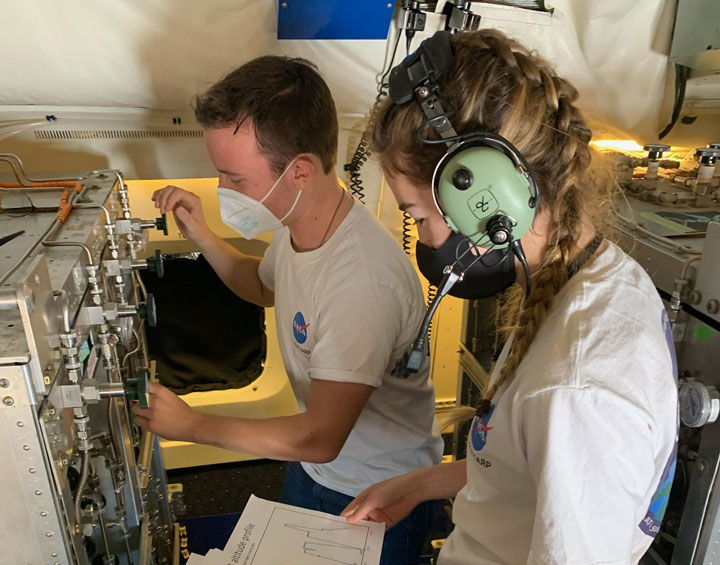
Jacob Schenthal, who graduated from Vanderbilt University in 2021, was drawn to the NASA SARP program for its emphasis on independent, field-based research and multidisciplinary scientific teams. McKenna Price-Patak, a 2021 Tulane University grad, felt it was a rare opportunity for an undergraduate student to be responsible for an entire research project: from data collection to analysis and project development.
“I’ve always had interests in a variety of fields within Earth science, which is why I was excited about the multidisciplinary aspect of SARP,” Price-Patak said.
Both Schenthal and Price-Patak were placed with Dr. Donald Blake, conducting air sampling aboard the aircraft to study atmospheric pollution.
Dr. Blake is kind of a big deal in the atmospheric science community. An atmospheric chemist at UC Irvine, Blake is half of the eponymous Rowland-Blake Group: the research lab whose other namesake, the late Dr. F. Sherwood Rowland, won a Nobel Prize in chemistry for identifying compounds responsible for Earth’s ozone hole. Today, Blake continues the lab’s work as a leading expert on the impacts of atmospheric chemistry and air pollution on human health, and has conducted NASA-sponsored airborne research for over 30 years.
“Dr. Blake is a phenomenal mentor and really helped me find a newfound interest in air quality research–which intersects directly with climate change and environmental justice: two of my other passions,” Schenthal said. As Price-Patak put it, “Don takes a genuine interest in each member of his group and their success. When my project took a last minute detour and had to be redone days before final presentations, Don sat with me on Zoom for hours a day helping me recover and create a project I was proud of.”
Both Schenthal and Price-Patak were accepted into the SARP program in 2020. Unable to make the flights that year due to the COVID-19 pandemic, the program had to take a different approach. For the first time in SARP’s history, participants received air quality testing canisters in the mail to remotely collect initial data points.
“Although the program during summer 2020 was remote, it was exciting to take air samples to help measure emission impacts of the COVID-19 lockdowns,” Schenthal said.
“The way the program pivoted to a virtual environment was incredible,” Price-Patak said. “While we would’ve loved to be in person, we still had so much support from our research groups and mentors so we could successfully complete our projects in the short time frame.”
Schenthal’s project, titled Investigating Xylene and Toluene in Disadvantaged Communities Downwind of LAX, blended NASA’s airborne science data within an environmental justice framework. He examined how xylene and toluene–two airborne compounds that damage the nervous system with chronic exposure–are more common in disadvantaged communities near and around Los Angeles International Airport (LAX). Schenthal found that Inglewood, a predominantly Black and low-income community, experienced exposure levels for both compounds at 50 times the background level. Additionally, his project results indicated the compounds acted as tracers, meaning hundreds of other pollutants are also potentially travelling from LAX throughout these communities.
Price-Patak’s project, Dimethyl Sulfide (DMS) in the Imperial Valley and its impact on Sulfate Aerosol Loading, used data collected on SARP flights from 2014 to 2019 to locate sources of inland DMS. DMS is typically released from plankton in the ocean, and can turn into sulfate aerosols which can cause respiratory illness. Her research indicated there may be inland sources of DMS producing up to 10% of the sulfate aerosols in the Imperial Valley, an important agricultural region east of Los Angeles.
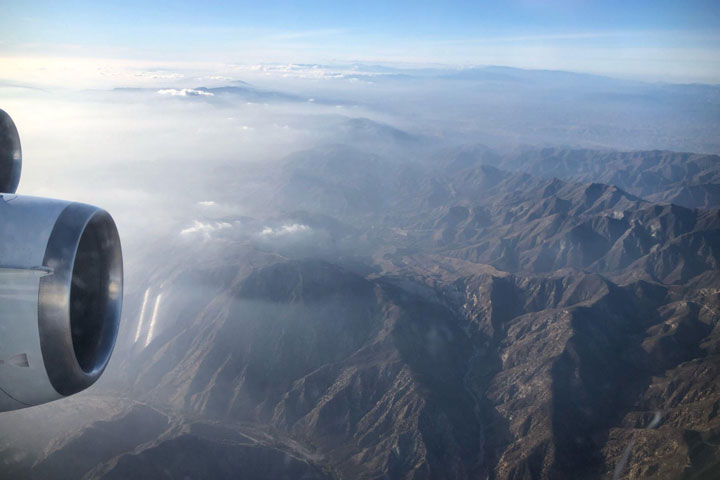
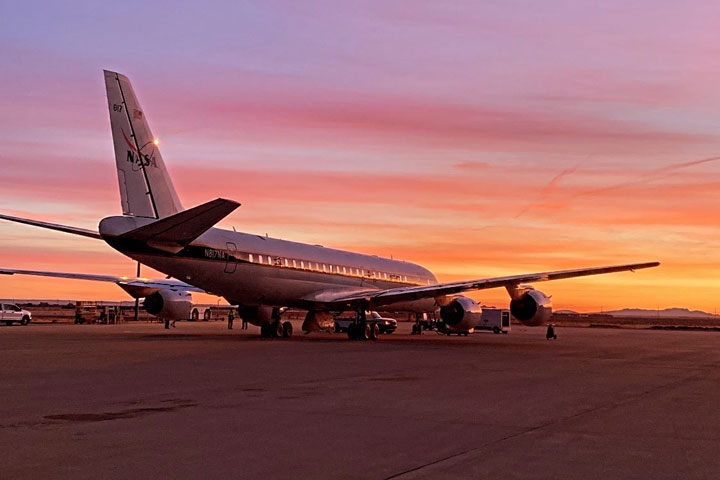
More than a year later, they got their chance to make the flight. In December 2021, fully-vaccinated participants from the 2020 and 2021 teams were finally able to take their projects airborne. Over the course of a week, the team participated in multiple flights over southern California aboard a DC-8 aircraft, taking samples adding to the program’s extensive record of air quality data.
By the end of the program, Price-Patak and Schenthal were able to rack up a combined 27 hours of flight time–and even experienced sitting in the cockpit for low approaches around Long Beach harbor!
According to Price-Patak, the value of the program comes not only from the work itself, but from the opportunity to connect with other early career scientists.
“Through SARP, I developed a new interest in atmospheric chemistry and connected with other students who have gone on to work as consultants with business firms, pursue PhDs, and everything else in between. Not only is the opportunity to conduct research through the program incredible, but the flights are truly a once in a lifetime experience. I would recommend any undergrad student with a STEM background to apply!”
“SARP has been an incredible experience, both personally and professionally. For me, it allowed me to explore my interest in air quality and environmental justice–all while engaging in field research and my independent research project,” Schenthal added.
Now, Schenthal and Price-Patak credit SARP in helping their careers take off–with both program alumni now working with NASA SERVIR at the University of Alabama in Huntsville (UAH).
A collaboration between NASA and USAID, SERVIR works with organizations around the world to design and implement satellite-based services supporting climate adaptation and natural resource management. Schenthal is the Regional Science Associate for SERVIR’s Mekong hub, while Price-Patak is a graduate research assistant for SERVIR-Hindu Kush-Himalaya while enrolled in UAH’s Master’s program in Earth science. And yes–both are still involved in air quality research. The application for SARP 2022 closes January 26th, and can be found here. Don’t hesitate to apply–and be prepared to pack your dramamine!
We had another successful flight last night. Airborne science has taught me that a great flight is one that provides good data and a story, but a perfect flight offers a story from which we learn something.
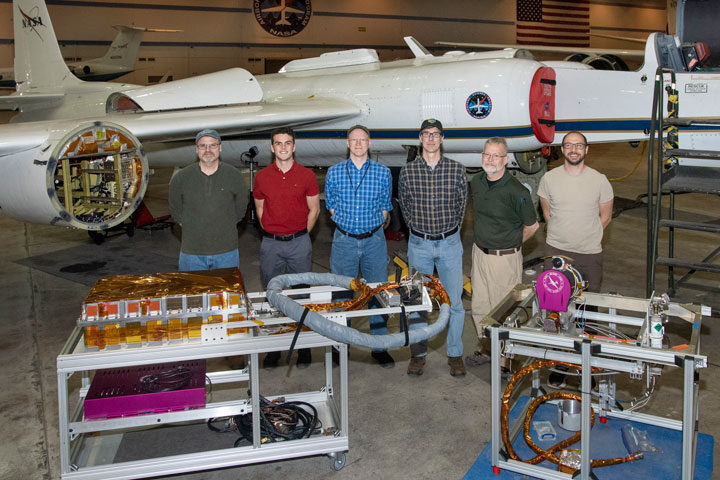
Let me back up. For the past two and a half years, my team from NASA, NIST, USGS, UMBC/JCET and the University of Guelph have been designing and building an instrument to take accurate measurements of the Moon to improve Earth observing sensors. After many long days, late nights, coffees, and a couple of successful test flights last year, we finally got to see our instrument, called air-LUSI, demonstrate its capabilities aboard an ER-2 airplane out of NASA’s Armstrong Flight Research Center (AFRC) in Palmdale, California. Our two-hour night flights started late November 12 and will wrap up on November 17 at around 2 a.m. in the morning.
The second night was a perfect flight. Preflight checks and takeoff were uneventful and the ER-2 ascended to 69,000 ft in about 45 minutes. The pilot then lined up the aircraft for our lunar observation flight line, which consists of a series of way points designed to keep the true heading perpendicular to the direction of the Moon.
At the time, I was sitting in the chase car with the mobile pilot and my Co-I, John Woodward. The ER-2 is difficult to fly. The cockpit is small and pilot is wearing a bulky spacesuit and helmet, so visibility is limited. The mobile pilot’s job is to help guide the ER-2 pilot, providing and extra pair of eyes and acts as point man for communication between the science team and ER-2 pilot. Chasing the plane down the runway was exciting and we know that racing just behind the plane as it lands will be even more thrilling. But now we were waiting for the experiment to unfold and do its job. The Moon was high and bright over the Mojave Desert and the November night air was dry but pleasantly cool. We quietly watched the flight using the Airborne Science Program (ASP) tracker on our cellphones and occasionally commented on the flight’s progress. I am also getting a play by play of our instruments performance via text from the rest of the air-LUSI team back in our mini mission control room.
At the beginning of run, the pilot deployed the telescope as planned and the IRIS telescope moved to the dorsal view port on the right wing pod.
Everything was working perfectly. And then the story began.
Within seconds of the telescope’s deployment, my team urgently texted and called me. They were clearly panicked. The autonomous robotic telescope mount instrument subsystem (ARTEMIS) tracking errors were through the roof. Something was terribly wrong.
Questions were quickly forming in my head, but before I could even ask, the voice on my cell, now on speaker, said, “Oh wait. The errors are back down to zero. We’re tracking!” “Good. Keep an eye on it and get back to me if there’s any change,” I said, and we hung up.
For the rest of the run, the ARTEMIS performed well, even better than the previous night. We didn’t realize it at the time, but that was new information.
On descent, the pilot radioed that he’d encountered a problem at the beginning of the data collection and would give details at the briefing. My entire team filed in the briefing room to hear that story.
The pilot had set the plane to autopilot and it became somewhat less stable, swaying back and forth. By the time he had worked out what had gone wrong and brought the plane back under manual control, several minutes had passed. He was genuinely concerned about what had happened to the data collection and so he flew an extra ten minutes to be sure that we got all 30 minutes like we had planned. He was relieved to hear that we got good measurements during that time.
Air-LUSI, naturally, had difficulty keeping a lock on the Moon while the plane was slaloming along, but recovered quickly when the flight smoothed out.
Once recovered, ARTEMIS’s tracking performance improved from the previous night. What made the difference?
Brian Hobbs, the ER-2 Mission Manager at AFRC, offered a hypothesis that seemed to resonate with the pilots, and it’s an idea that, I suspect, might not have emerged as readily if the autopilot mistake hadn’t happened on this flight.
It is simply this: air-LUSI’s tracking performance can be influenced by the pilot’s technique in targeting planned headings, even under normal conditions. We can tune our robotics to better account for handling nuances, like unexpected turbulence. We also learned that there are subtle oscillating motions of the aircraft that will also need to be tuned out to optimize our measurement accuracy. But, pilot technique can help reduce some of these effects.
Anyway, that’s three successful flights. Fly air-LUSI!
