Alex Haughton is a graduate student in the Astrophysical and Planetary Sciences department at University of Colorado Boulder studying ultraviolet instrumentation with sounding rockets. His team has traveled to Equatorial Launch Australia’s Arnhem Space Center near Nhulunbuy, Australia to launch the Dual-channel Extreme Ultraviolet Continuum Experiment (DEUCE) Sounding Rocket and observe the stars Alpha Centauri A & B in extreme ultraviolet wavelengths.
This is a story about the color red. Oh sure, there are sounding rockets; there are telescopes with new technology for ultraviolet astronomy; there is cool science on stellar atmospheres; there is a new spaceport built in collaboration with the Indigenous community; there is the cast of colorful characters that it takes to get space science done. First and foremost, however, is the prevalent red that claims everything in East Arnhem Land, the area we have come to for our rocket launch.
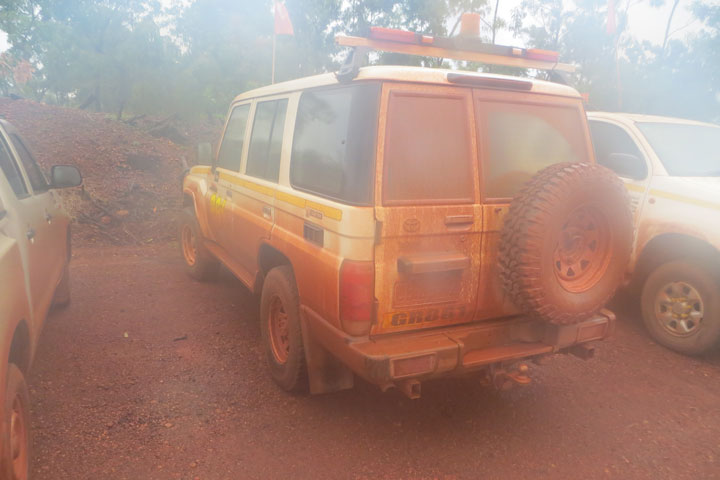
Some say red is simply the color of the dirt here, but they underestimate what they are dealing with. This is so much more than any dirt could be. This is red. Since our arrival a week ago, we are slowly turning into red. When I walk outside, whether I crunch on gravel or plunk through a puddle, my feet turn into red. I walk inside, bringing the red with me, and the floor is now red. We drive to and from Nhulunbuy, the town about 30 minutes from our camp at the Gulkula Cultural Center, and the beat-up 2WD Toyota Hilux we have fondly named “Twobacca” is red. I open and shut Twobacca’s doors and my hand is red, and whatever I touch next will turn into red.
When things are dry, red takes the form of a dust that fills the air. We breathe red. Lately, as East Arnhem does its best impression of Ray Bradybury’s “The Long Rain,” the dust is replaced by something best described as paint. The surface of the Earth is a completely sticky red that seeps under doorjams, coats your trousers, and even climbs the walls.
East Arnhem Land has many inhabitants – Yolngu people, miners, scientists come to launch rockets, crocodiles, spiders, snakes, wallabies, and other beasties. But here red rules over all.
For students who want to take atmospheric science as literally as possible, it doesn’t get much better than flying in a NASA aircraft.
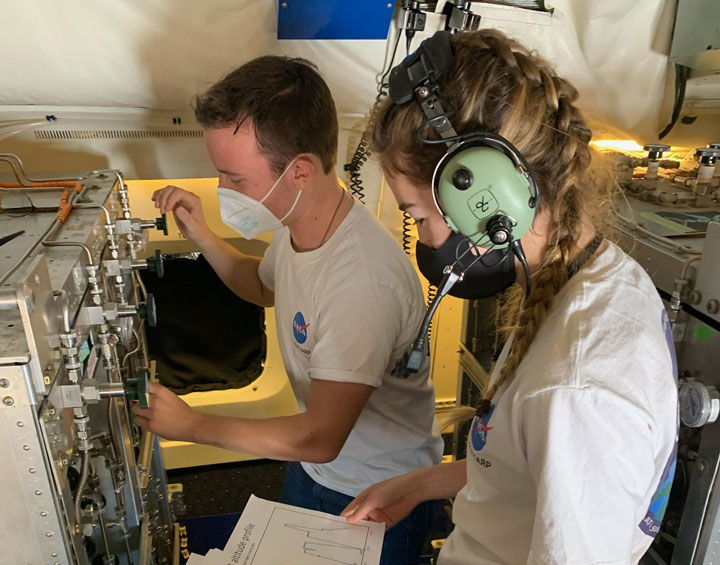
Each year, the Student Airborne Research Program (SARP) invites a team of rising college seniors to Armstrong Flight Research Center in Southern California to conduct research aboard NASA’s airborne science fleet. Each aircraft is equipped with instruments for land, ocean, and atmospheric research–enabling sample collection and imaging over the Earth’s surface. After operating the instruments in-flight, participants are then able to use the resulting data for their own individual research projects.
…as soon as they recover from the air sickness, of course.
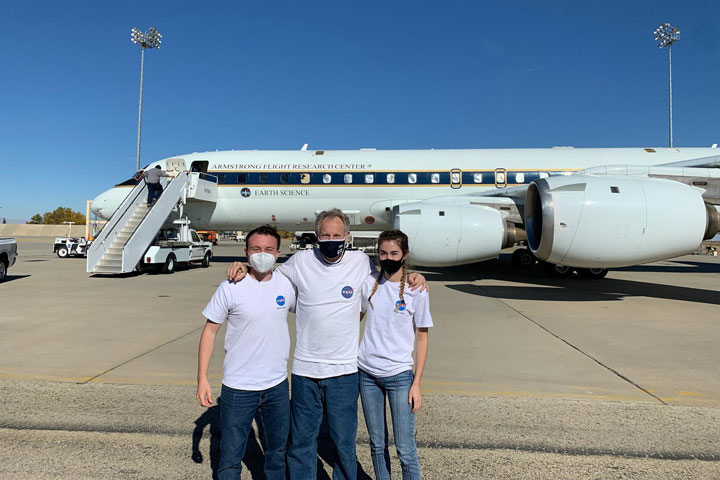
Jacob Schenthal, who graduated from Vanderbilt University in 2021, was drawn to the NASA SARP program for its emphasis on independent, field-based research and multidisciplinary scientific teams. McKenna Price-Patak, a 2021 Tulane University grad, felt it was a rare opportunity for an undergraduate student to be responsible for an entire research project: from data collection to analysis and project development.
“I’ve always had interests in a variety of fields within Earth science, which is why I was excited about the multidisciplinary aspect of SARP,” Price-Patak said.
Both Schenthal and Price-Patak were placed with Dr. Donald Blake, conducting air sampling aboard the aircraft to study atmospheric pollution.
Dr. Blake is kind of a big deal in the atmospheric science community. An atmospheric chemist at UC Irvine, Blake is half of the eponymous Rowland-Blake Group: the research lab whose other namesake, the late Dr. F. Sherwood Rowland, won a Nobel Prize in chemistry for identifying compounds responsible for Earth’s ozone hole. Today, Blake continues the lab’s work as a leading expert on the impacts of atmospheric chemistry and air pollution on human health, and has conducted NASA-sponsored airborne research for over 30 years.
“Dr. Blake is a phenomenal mentor and really helped me find a newfound interest in air quality research–which intersects directly with climate change and environmental justice: two of my other passions,” Schenthal said. As Price-Patak put it, “Don takes a genuine interest in each member of his group and their success. When my project took a last minute detour and had to be redone days before final presentations, Don sat with me on Zoom for hours a day helping me recover and create a project I was proud of.”
Both Schenthal and Price-Patak were accepted into the SARP program in 2020. Unable to make the flights that year due to the COVID-19 pandemic, the program had to take a different approach. For the first time in SARP’s history, participants received air quality testing canisters in the mail to remotely collect initial data points.
“Although the program during summer 2020 was remote, it was exciting to take air samples to help measure emission impacts of the COVID-19 lockdowns,” Schenthal said.
“The way the program pivoted to a virtual environment was incredible,” Price-Patak said. “While we would’ve loved to be in person, we still had so much support from our research groups and mentors so we could successfully complete our projects in the short time frame.”
Schenthal’s project, titled Investigating Xylene and Toluene in Disadvantaged Communities Downwind of LAX, blended NASA’s airborne science data within an environmental justice framework. He examined how xylene and toluene–two airborne compounds that damage the nervous system with chronic exposure–are more common in disadvantaged communities near and around Los Angeles International Airport (LAX). Schenthal found that Inglewood, a predominantly Black and low-income community, experienced exposure levels for both compounds at 50 times the background level. Additionally, his project results indicated the compounds acted as tracers, meaning hundreds of other pollutants are also potentially travelling from LAX throughout these communities.
Price-Patak’s project, Dimethyl Sulfide (DMS) in the Imperial Valley and its impact on Sulfate Aerosol Loading, used data collected on SARP flights from 2014 to 2019 to locate sources of inland DMS. DMS is typically released from plankton in the ocean, and can turn into sulfate aerosols which can cause respiratory illness. Her research indicated there may be inland sources of DMS producing up to 10% of the sulfate aerosols in the Imperial Valley, an important agricultural region east of Los Angeles.
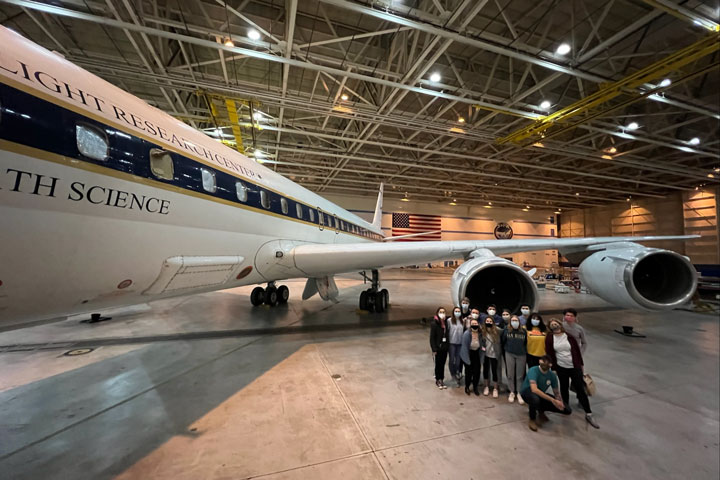
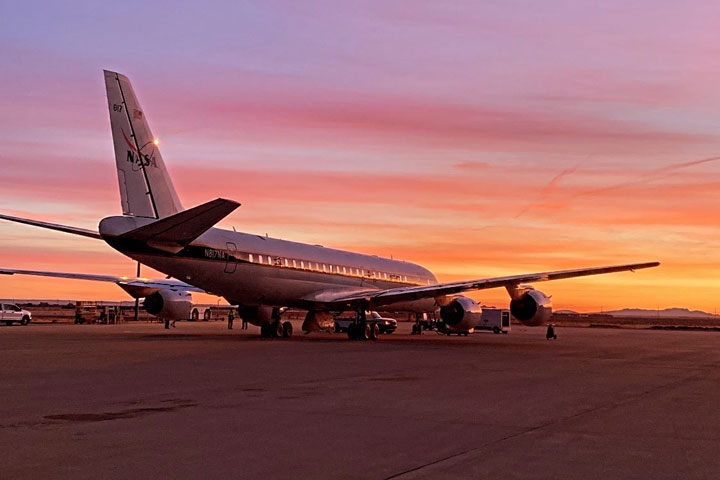
More than a year later, they got their chance to make the flight. In December 2021, fully-vaccinated participants from the 2020 and 2021 teams were finally able to take their projects airborne. Over the course of a week, the team participated in multiple flights over southern California aboard a DC-8 aircraft, taking samples adding to the program’s extensive record of air quality data.
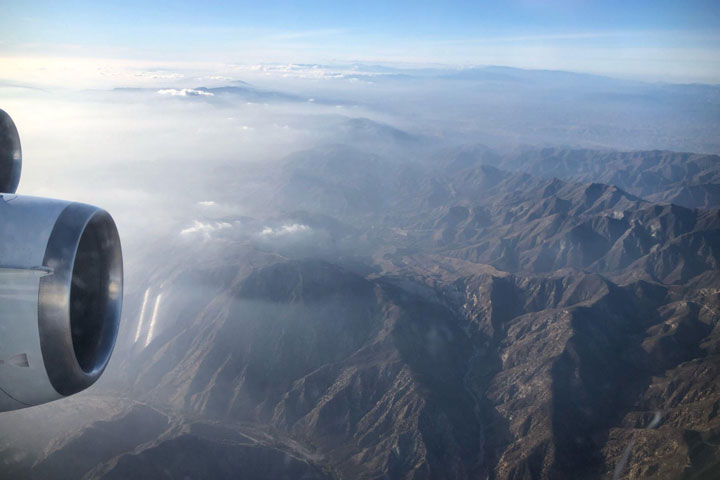
By the end of the program, Price-Patak and Schenthal were able to rack up a combined 27 hours of flight time–and even experienced sitting in the cockpit for low approaches around Long Beach harbor!
According to Price-Patak, the value of the program comes not only from the work itself, but from the opportunity to connect with other early career scientists.
“Through SARP, I developed a new interest in atmospheric chemistry and connected with other students who have gone on to work as consultants with business firms, pursue PhDs, and everything else in between. Not only is the opportunity to conduct research through the program incredible, but the flights are truly a once in a lifetime experience. I would recommend any undergrad student with a STEM background to apply!”
“SARP has been an incredible experience, both personally and professionally. For me, it allowed me to explore my interest in air quality and environmental justice–all while engaging in field research and my independent research project,” Schenthal added.
Now, Schenthal and Price-Patak credit SARP in helping their careers take off–with both program alumni now working with NASA SERVIR at the University of Alabama in Huntsville (UAH).
A collaboration between NASA and USAID, SERVIR works with organizations around the world to design and implement satellite-based services supporting climate adaptation and natural resource management. Schenthal is the Regional Science Associate for SERVIR’s Mekong hub, while Price-Patak is a graduate research assistant for SERVIR-Hindu Kush-Himalaya while enrolled in UAH’s Master’s program in Earth science. And yes–both are still involved in air quality research. The application for SARP 2022 closes January 26th, and can be found here. Don’t hesitate to apply–and be prepared to pack your dramamine!
The CYGNSS constellation of 8 SmallSats was launched into low Earth orbit five years ago, on December 15, 2016. It began as a two year mission to study how well GPS signals reflected from the ocean surface can help us measure the winds in hurricanes and improve our ability to forecast them. Well, we’ve done that, but it turns out those reflected signals can tell us a lot more. One of the key reasons we’ve been able to learn about all the other applications is the extra time we’ve had on orbit, to make more measurements, study their sensitivity to other environmental parameters, construct new data products, and develop scientific uses for them. For that, I am sincerely grateful to the team of technicians, engineers and managers at the Southwest Research Institute and the Space Physics Research Lab who designed, built, tested and now operate the spacecraft, and to our partners at Surrey Satellite Technology Ltd. who designed and built the GPS receivers that take our science measurements. They were given a schedule, a budget and a two-year requirement for on-orbit operations. We got to orbit on time and under budget and here we are, five years later, still making high quality observations with each GPS receiver on every spacecraft at 100% duty cycle. I am also very grateful to NASA for the support they have provided and for their willingness to expand the scope of CYGNSS science as we discover new, exciting and impactful things we can do with our mission.
One of the great things about operating 8 spacecraft with a 100% duty cycle is the frequency with which you can sample tropical cyclones throughout their entire life cycle. This is illustrated in the following figure, which shows when and how well CYGNSS sampled every major storm (Cat 3 or greater) from 2018 to 2020.
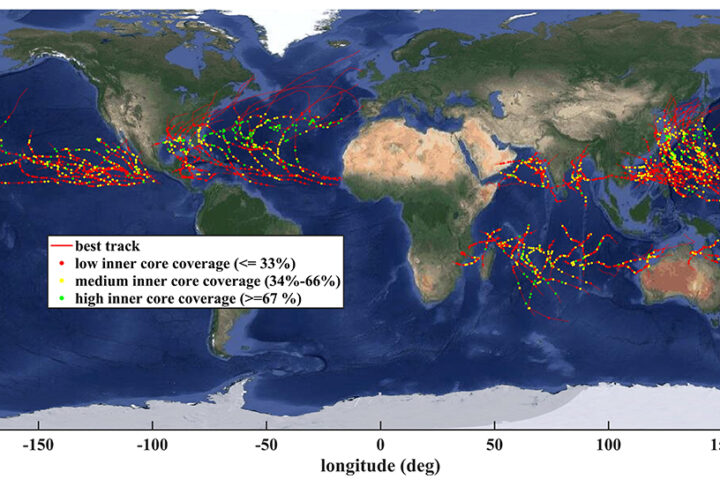
In the figure, the red lines are the track of each storm throughout its life cycle, the dots are when there was a CYGNSS overpass, and the color of the dot indicates how well we sampled the inner core of the storm. Every storm is sampled between one and three times a day, which helps monitor its development and capture sudden changes like rapid intensification. The impact our observations have on hurricane forecast skill is an active area of research by the CYGNSS science team. One recent example is work by researchers at the NOAA Hurricane Research Division that is highlighted in this figure.
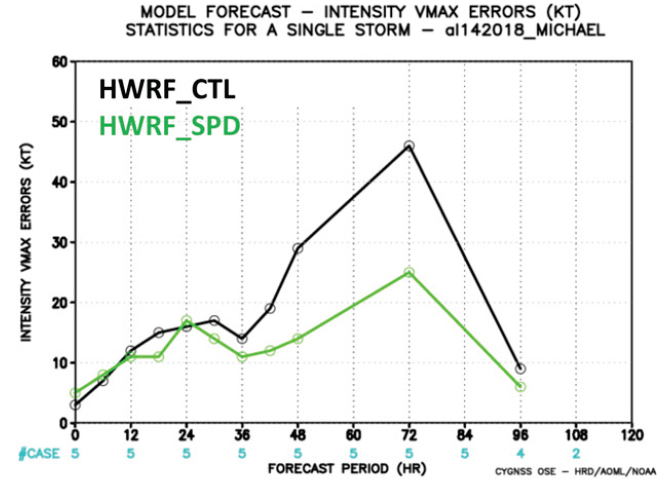
The figure shows the error in the operational forecast of maximum wind speed during Hurricane Michael’s rapid intensification, which occurred between 36 and 72 hours into the forecast (black line), and the reduced error that would have been present had CYGNSS observations been included (green line). The peak error is reduced from about 45 to 25 knots, or cut almost in half.
CYGNSS spends much less than 0.1% of its time over hurricanes but its radar receivers operate continuously. This enables many other uses of the data. Data products over ocean include near-surface wind speed and, from it, sea-to-air fluxes of latent and sensible heat. One new data product released in 2021 is the concentration of ocean microplastics, derived from the suppression of ocean surface roughness by surfactants acting as tracers of the microplastics. Time lapse microplastic concentration maps of Yangtze River outflow are shown in the following figure.
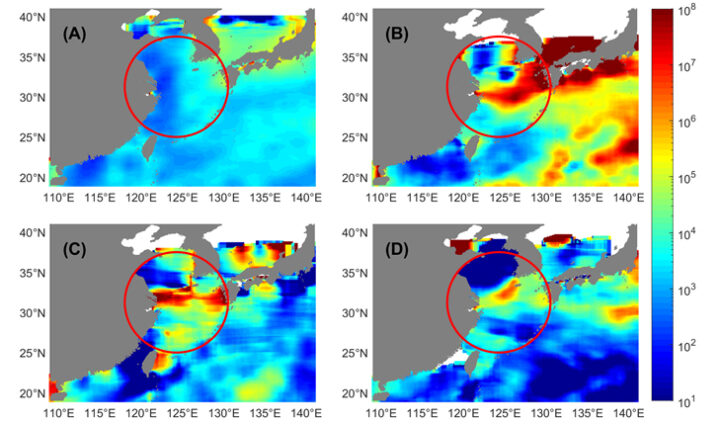
The upper left panel (A) in the figure shows the annual average microplastic concentration in the East China Sea near the mouth of the Yangtze. There is no obvious outflow signal. Panels (B)-(D) show the concentration averaged over individual weeks of the year in which there is a prominent outflow plume.
CYGNSS operates over both ocean and land, and the land reflections contain two important pieces of information. When standing water is not present in the measurement footprint to any significant degree, it is possible to retrieve near-surface soil moisture content. We can measure the global distribution of soil moisture several time per day and those data have been shown to significantly improve global land surface hydrology models <https://doi.org/10.1088/1748-9326/ac0ddf>. When inland water bodies are present in the footprint, reflections from them tend to dominate the measurements. CYGNSS is then able to effectively map the extent of the water. One application of this capability is shown in the following figure of flood inundation across the island of Hispaniola as imaged by CYGNSS after Hurricane Isaias landfall.
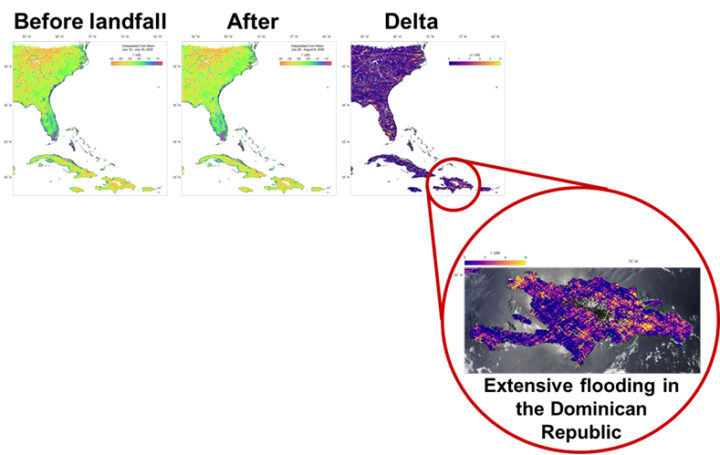
The “Delta” map shows the change in surface reflectivity from before to after landfall. The extensive flooding that occurred in the capital city of Santo Domingo is highlighted by bright yellow (high delta) areas.
Inland water body maps produced by CYGNSS have two distinct properties. One, which derives from the large number of satellites in the constellation, is their ability to be updated often. This allows them to capture sudden changes like flood events. The other, which derives from the use of GPS signals that can penetrate through clouds, rain and vegetation canopies, is their ability to map wetland extent in heavily vegetated regions. One exciting new application of this capability is improved prediction of methane emission from wetlands. The accuracy of a global wetland methane emission model was evaluated when initialized by three different water masks. The results are shown in the following figure.
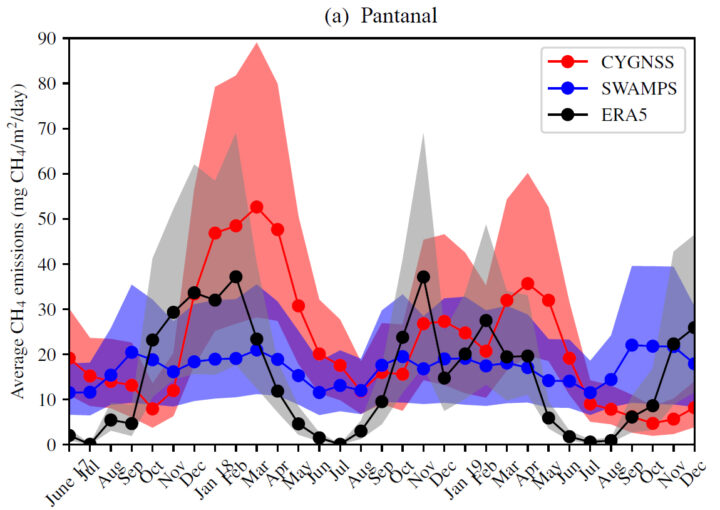
If a static water mask derived from Vis/IR imagers is used (SWAMPS blue curve in figure), seasonal variations in water extent are not represented and anomalous conditions associated with clouds and vegetation are misrepresented. If the model uses a dynamic rainfall map to better account for seasonal effects (ERA5 black curve), complications in the relationship between rainfall and wetland inundation are neglected. The best results are had using dynamic maps of wetland extent derived from CYGNSS observations (CYGNSS red curve) because they are based on direct, time varying measurements of the inundation that are insensitive to clouds and vegetation.
The first five years of on-orbit operation have produced valuable ocean wind observations for improved hurricane forecasting and have uncovered many new applications of the data away from hurricanes. We will continue to refine our measurements of winds, soil moisture and inland water bodies. And who knows what other new sensitivities we will uncover in the next five years?
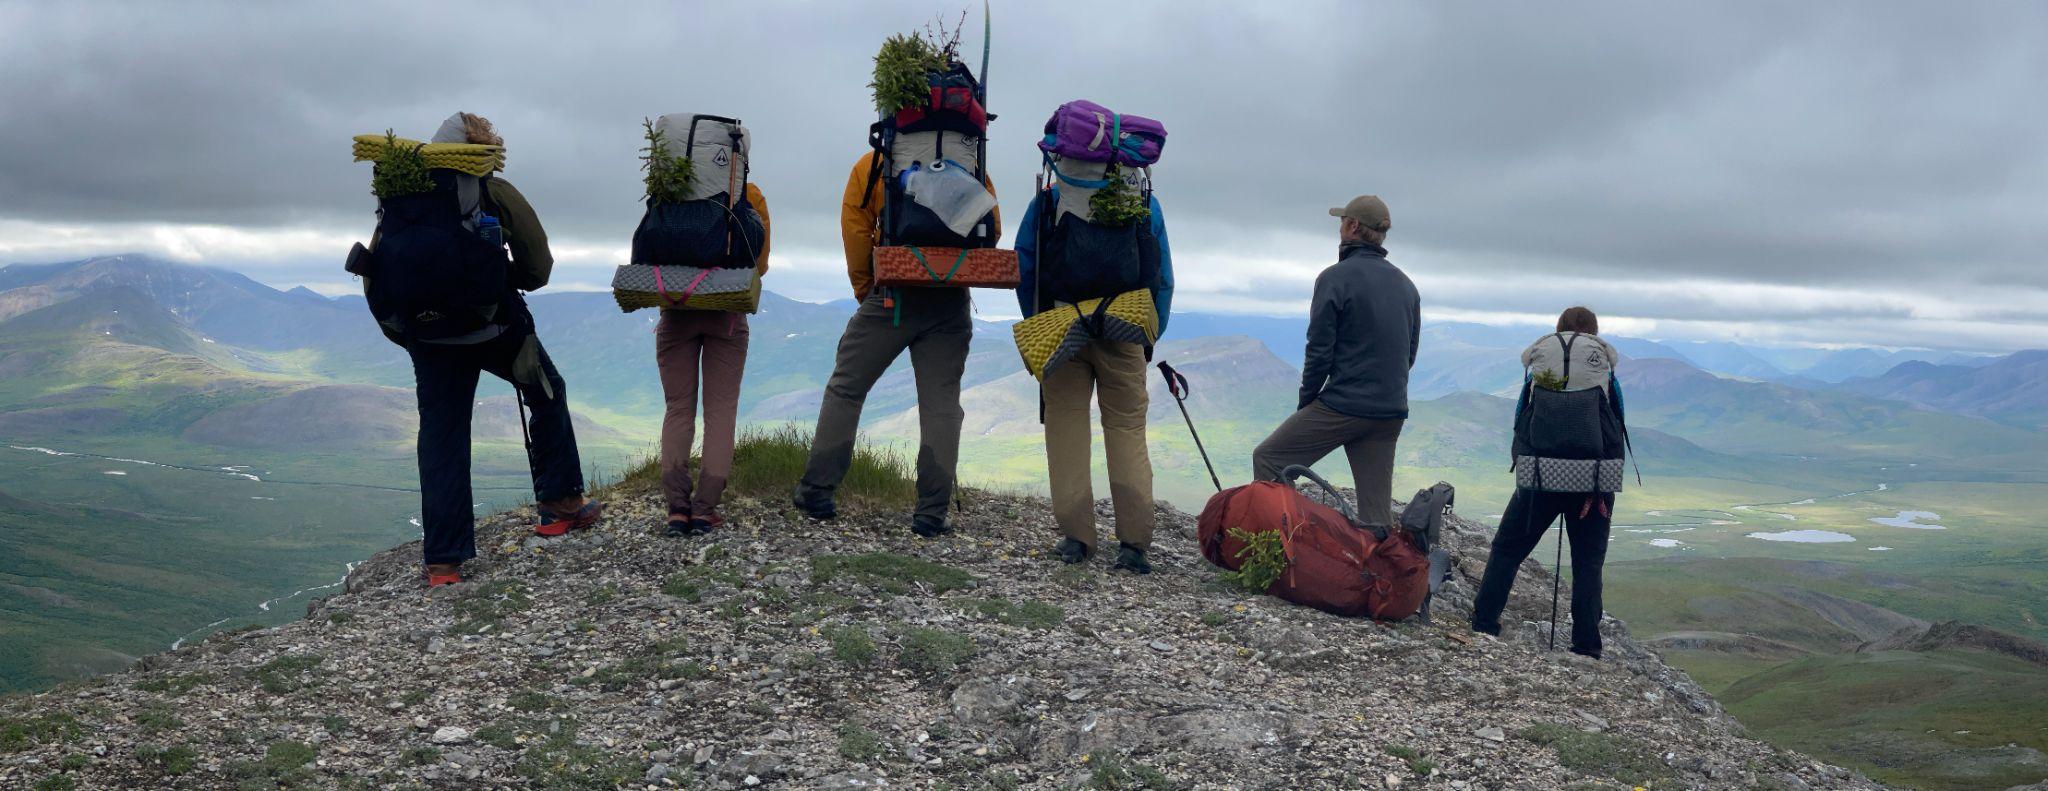
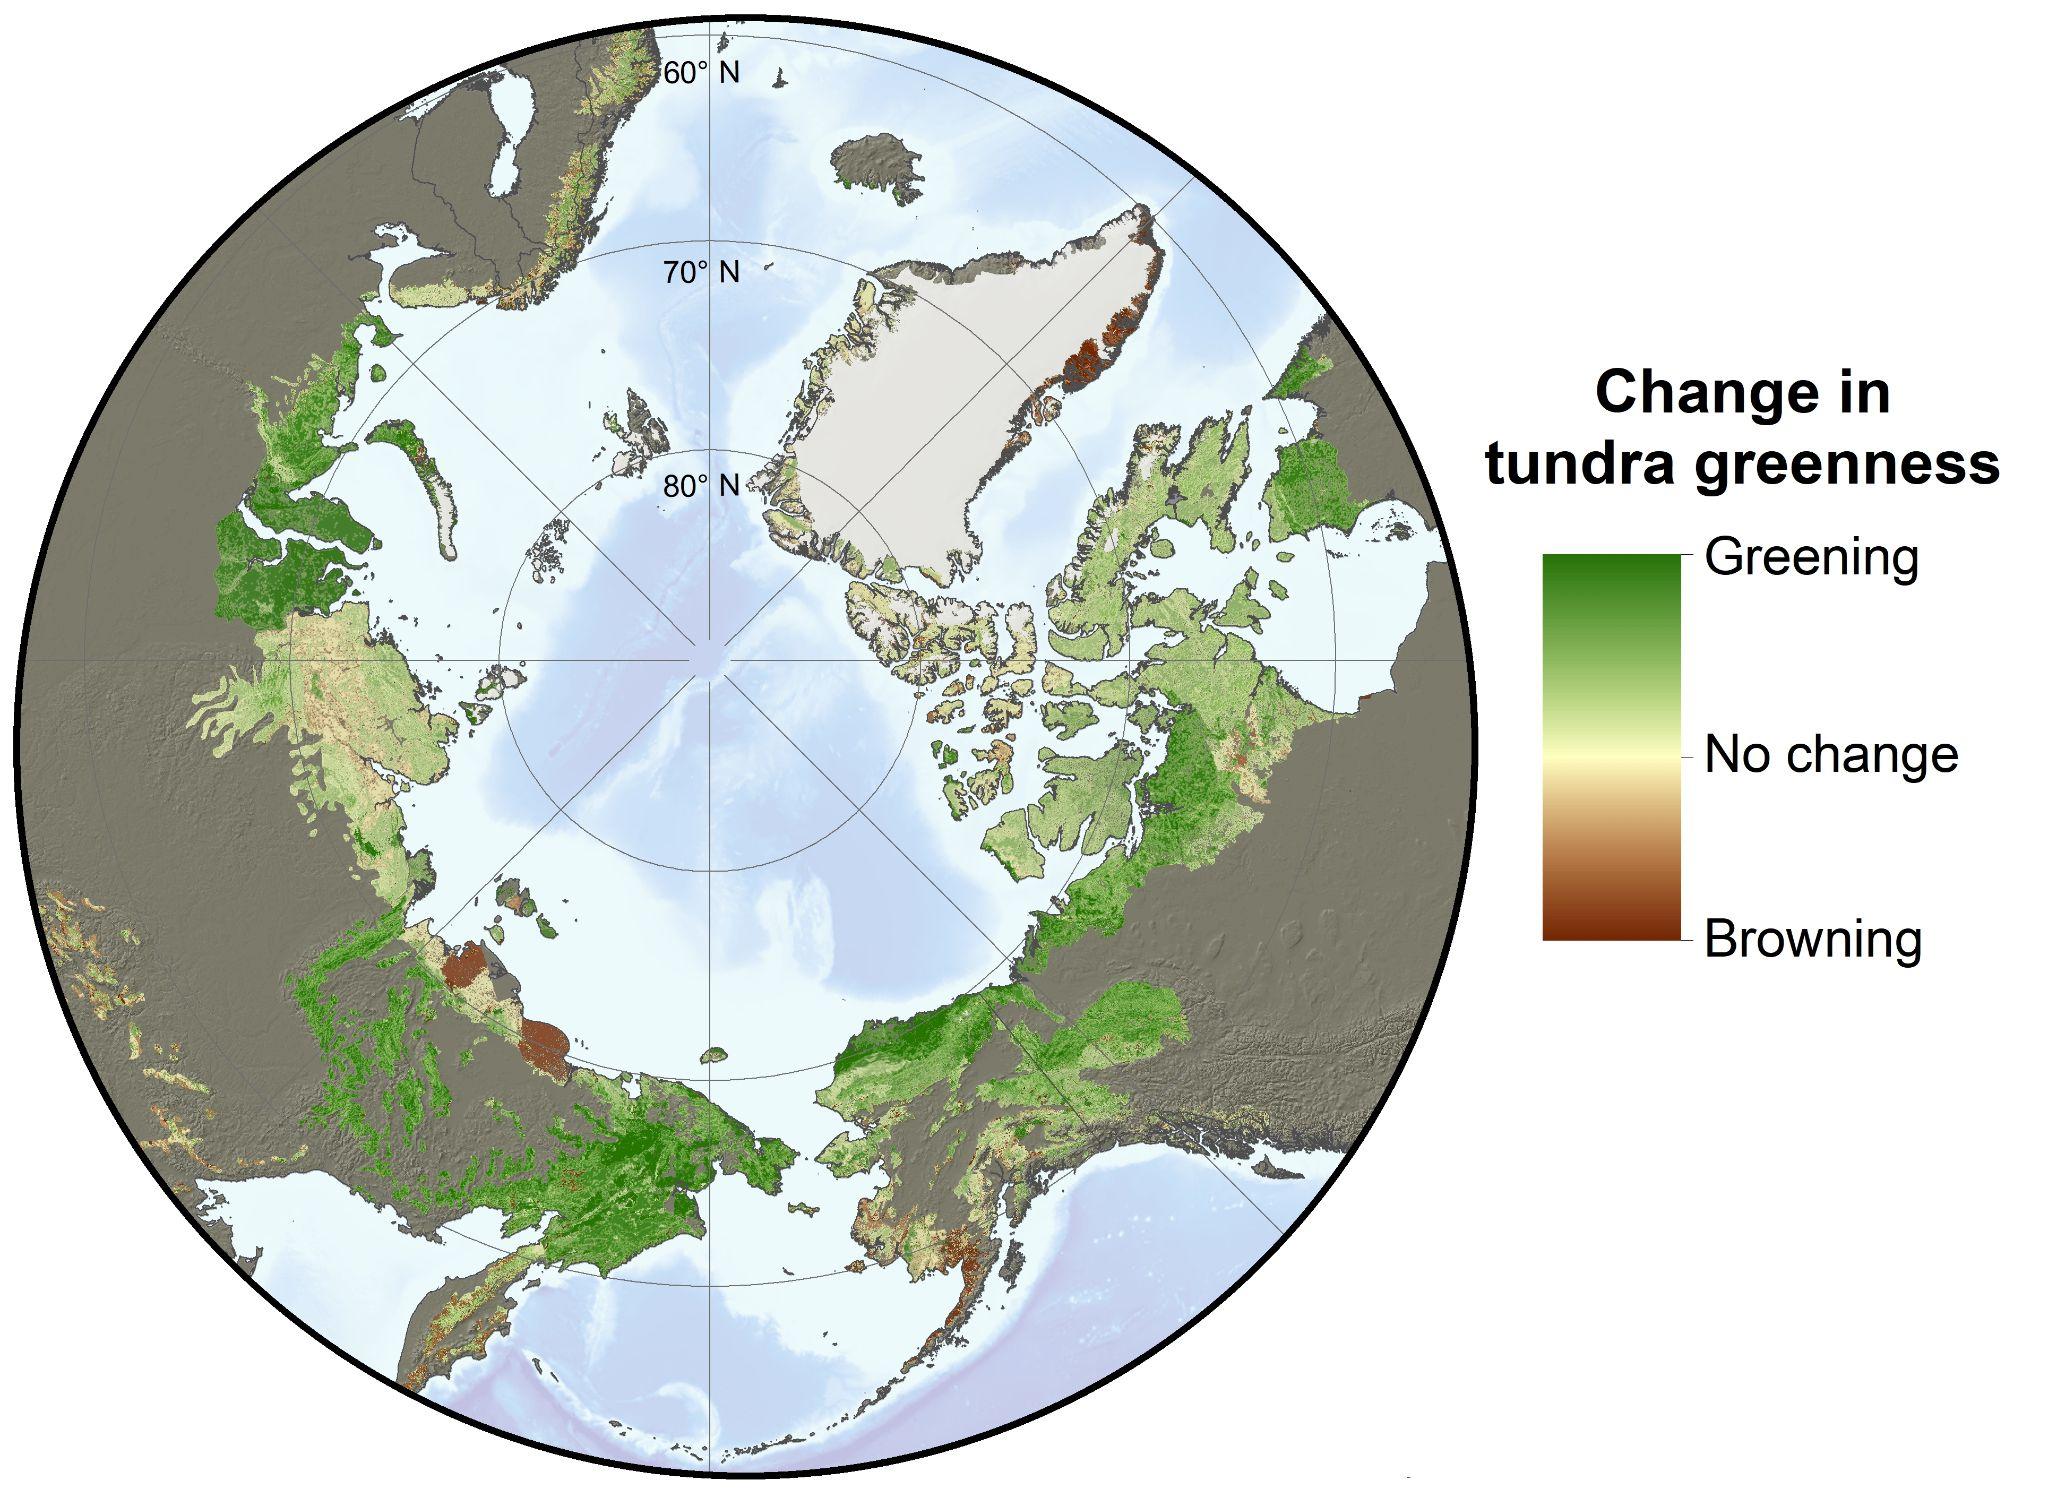
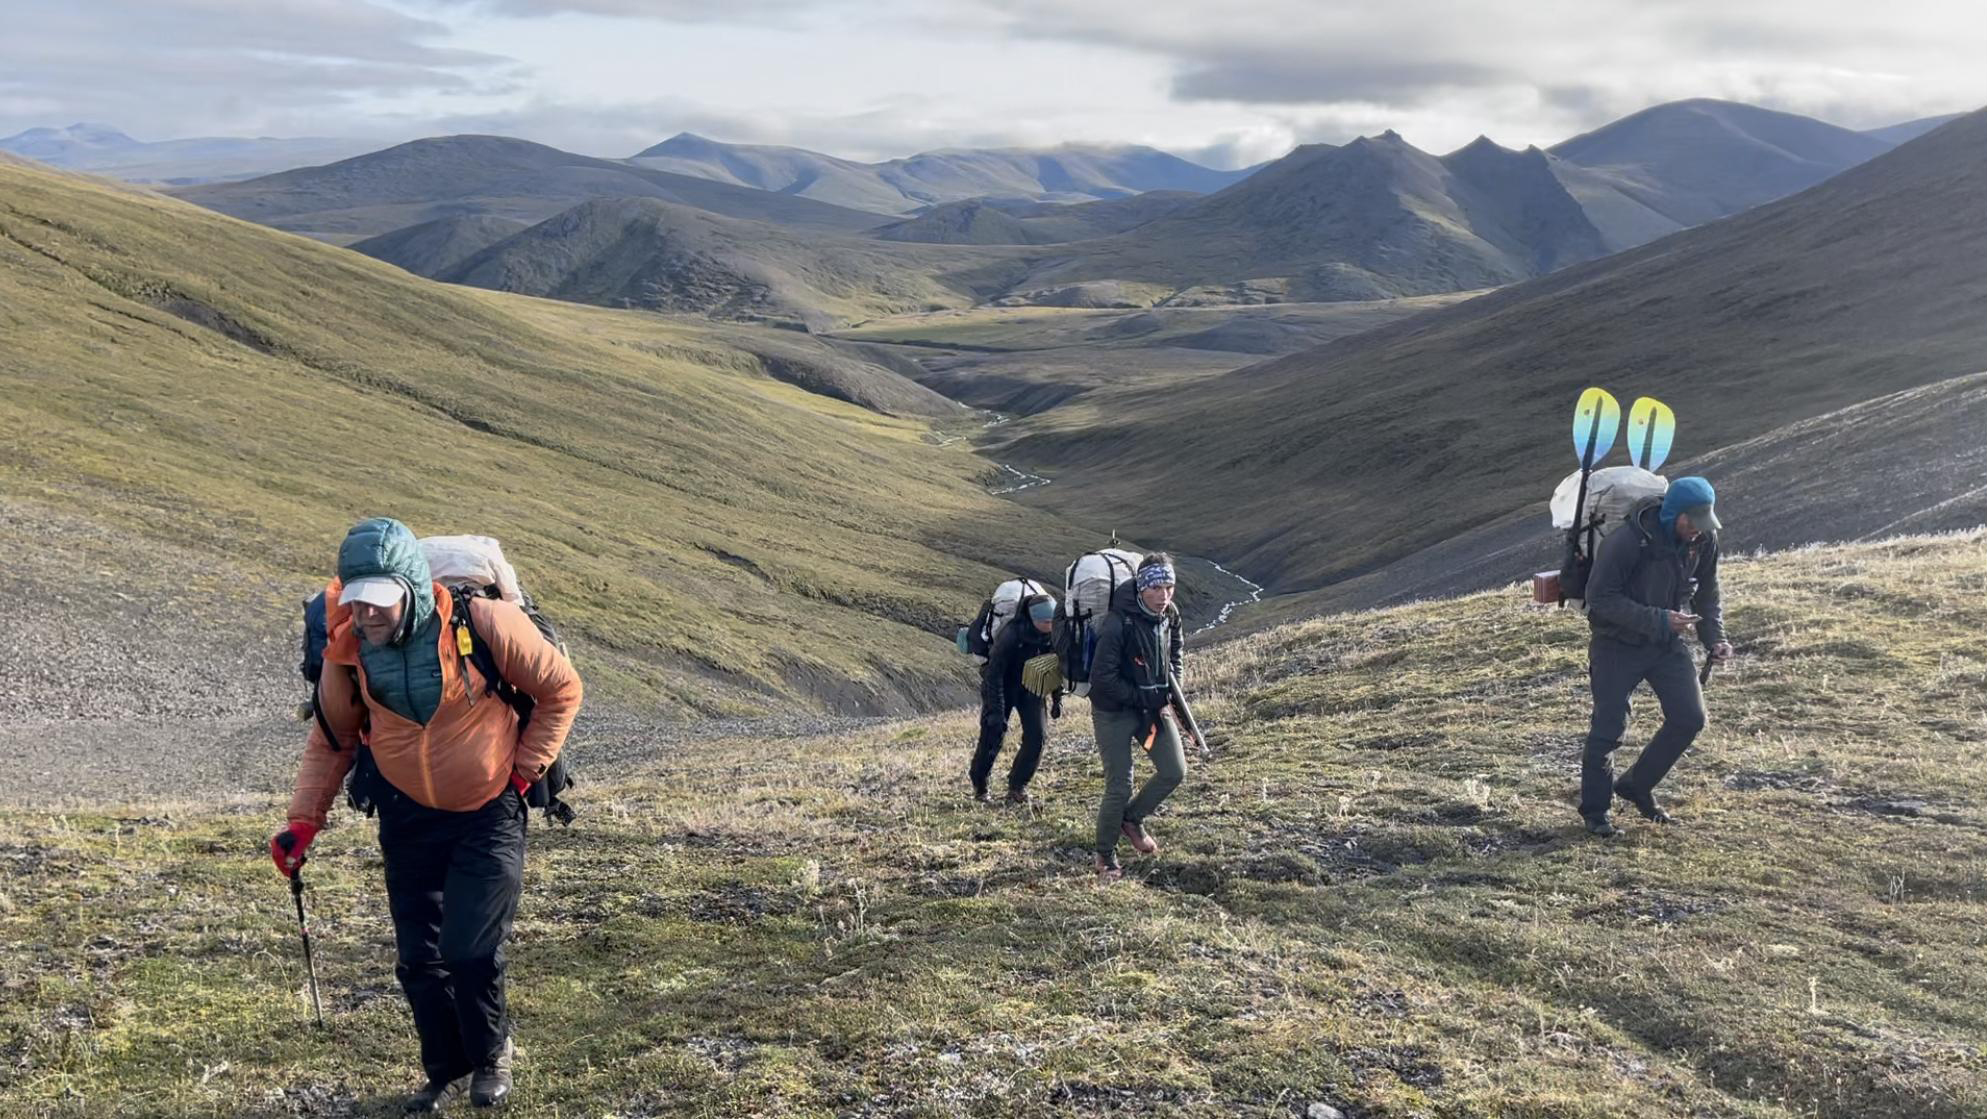
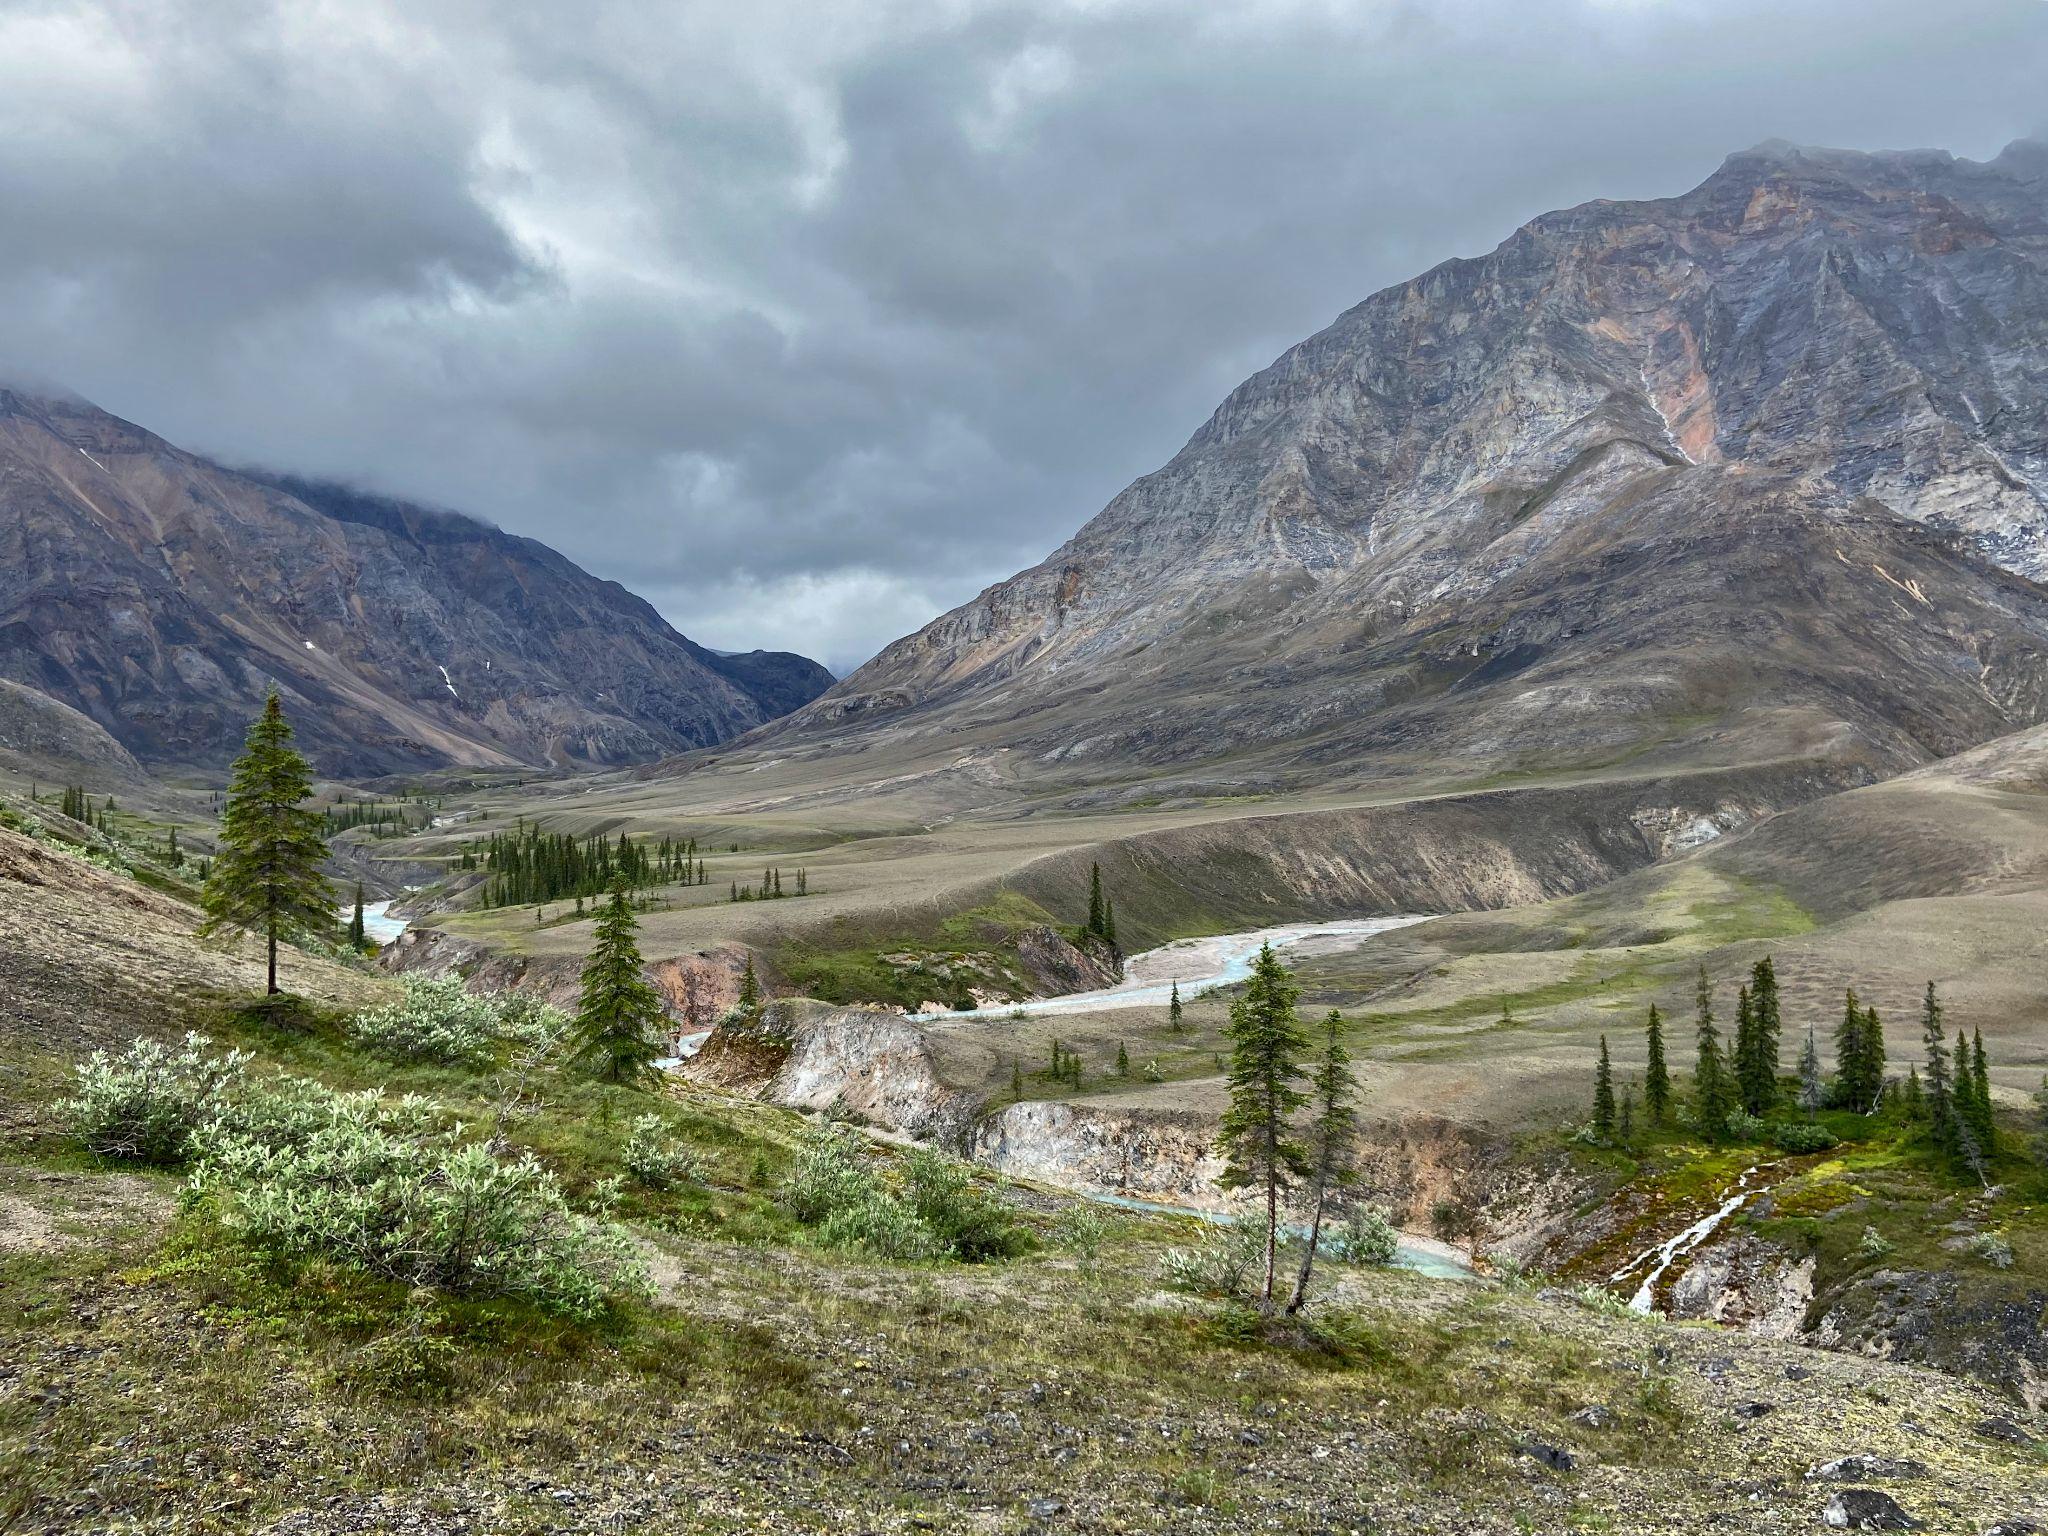
Following caribou and brown bear trails when possible, a small NASA-supported research team trekked 800 miles across Alaska’s Brooks Range last summer. With additional support from NSF, the Alaska Space Grant Program, and the Explorers Club/Discover, the research team is collecting extensive ecological field data that will be linked with satellite observations to better understand long-term changes in vegetation, including impacts of climate warming. The Arctic is warming nearly twice as rapidly as the rest of the planet and the impacts are becoming increasingly evident as glaciers melt, permafrost thaws, and tundra greens.
Earth-observing satellites have detected widespread increases in tundra greenness in the Arctic over the last four decades. The phenomena is caused, in part, by increases in vegetation growth as summers have become warmer and longer, and has been termed “Arctic greening.” On the other hand, satellite observations have also detected localized declines in tundra greenness attributed to surface flooding, extreme weather, and other disturbances. This has been termed “Arctic browning.” Satellite observations of greening and browning show that extensive changes are occurring in the Arctic, but much remains unclear about why specific regions have greened or browned in recent decades.
To better understand recent greening and browning in northern Alaska, Professor Roman Dial’s team from Alaska Pacific University (APU) has been collecting extensive ecological observations while trekking throughout Alaska’s Brooks Range. For nearly forty years, Dial has studied and traversed the Alaskan wilderness, including nearly 2,000 miles by foot and packraft throughout the Brooks Range during the last three field seasons. For 11 days last summer, Dial’s team was joined by Dr. Logan Berner and Patrick Burns who are research ecologists from Northern Arizona University (NAU) and members of NASA’s Arctic-Boreal Vulnerability Experiment (ABoVE). While Dial is an expert in field ecology and wilderness travel, Berner and Burns are experts in satellite remote sensing and ecological informatics. By combining their expertise, these researchers hope to shed light on the extent, nature, and causes of vegetation changes during recent decades in the Brooks Range.
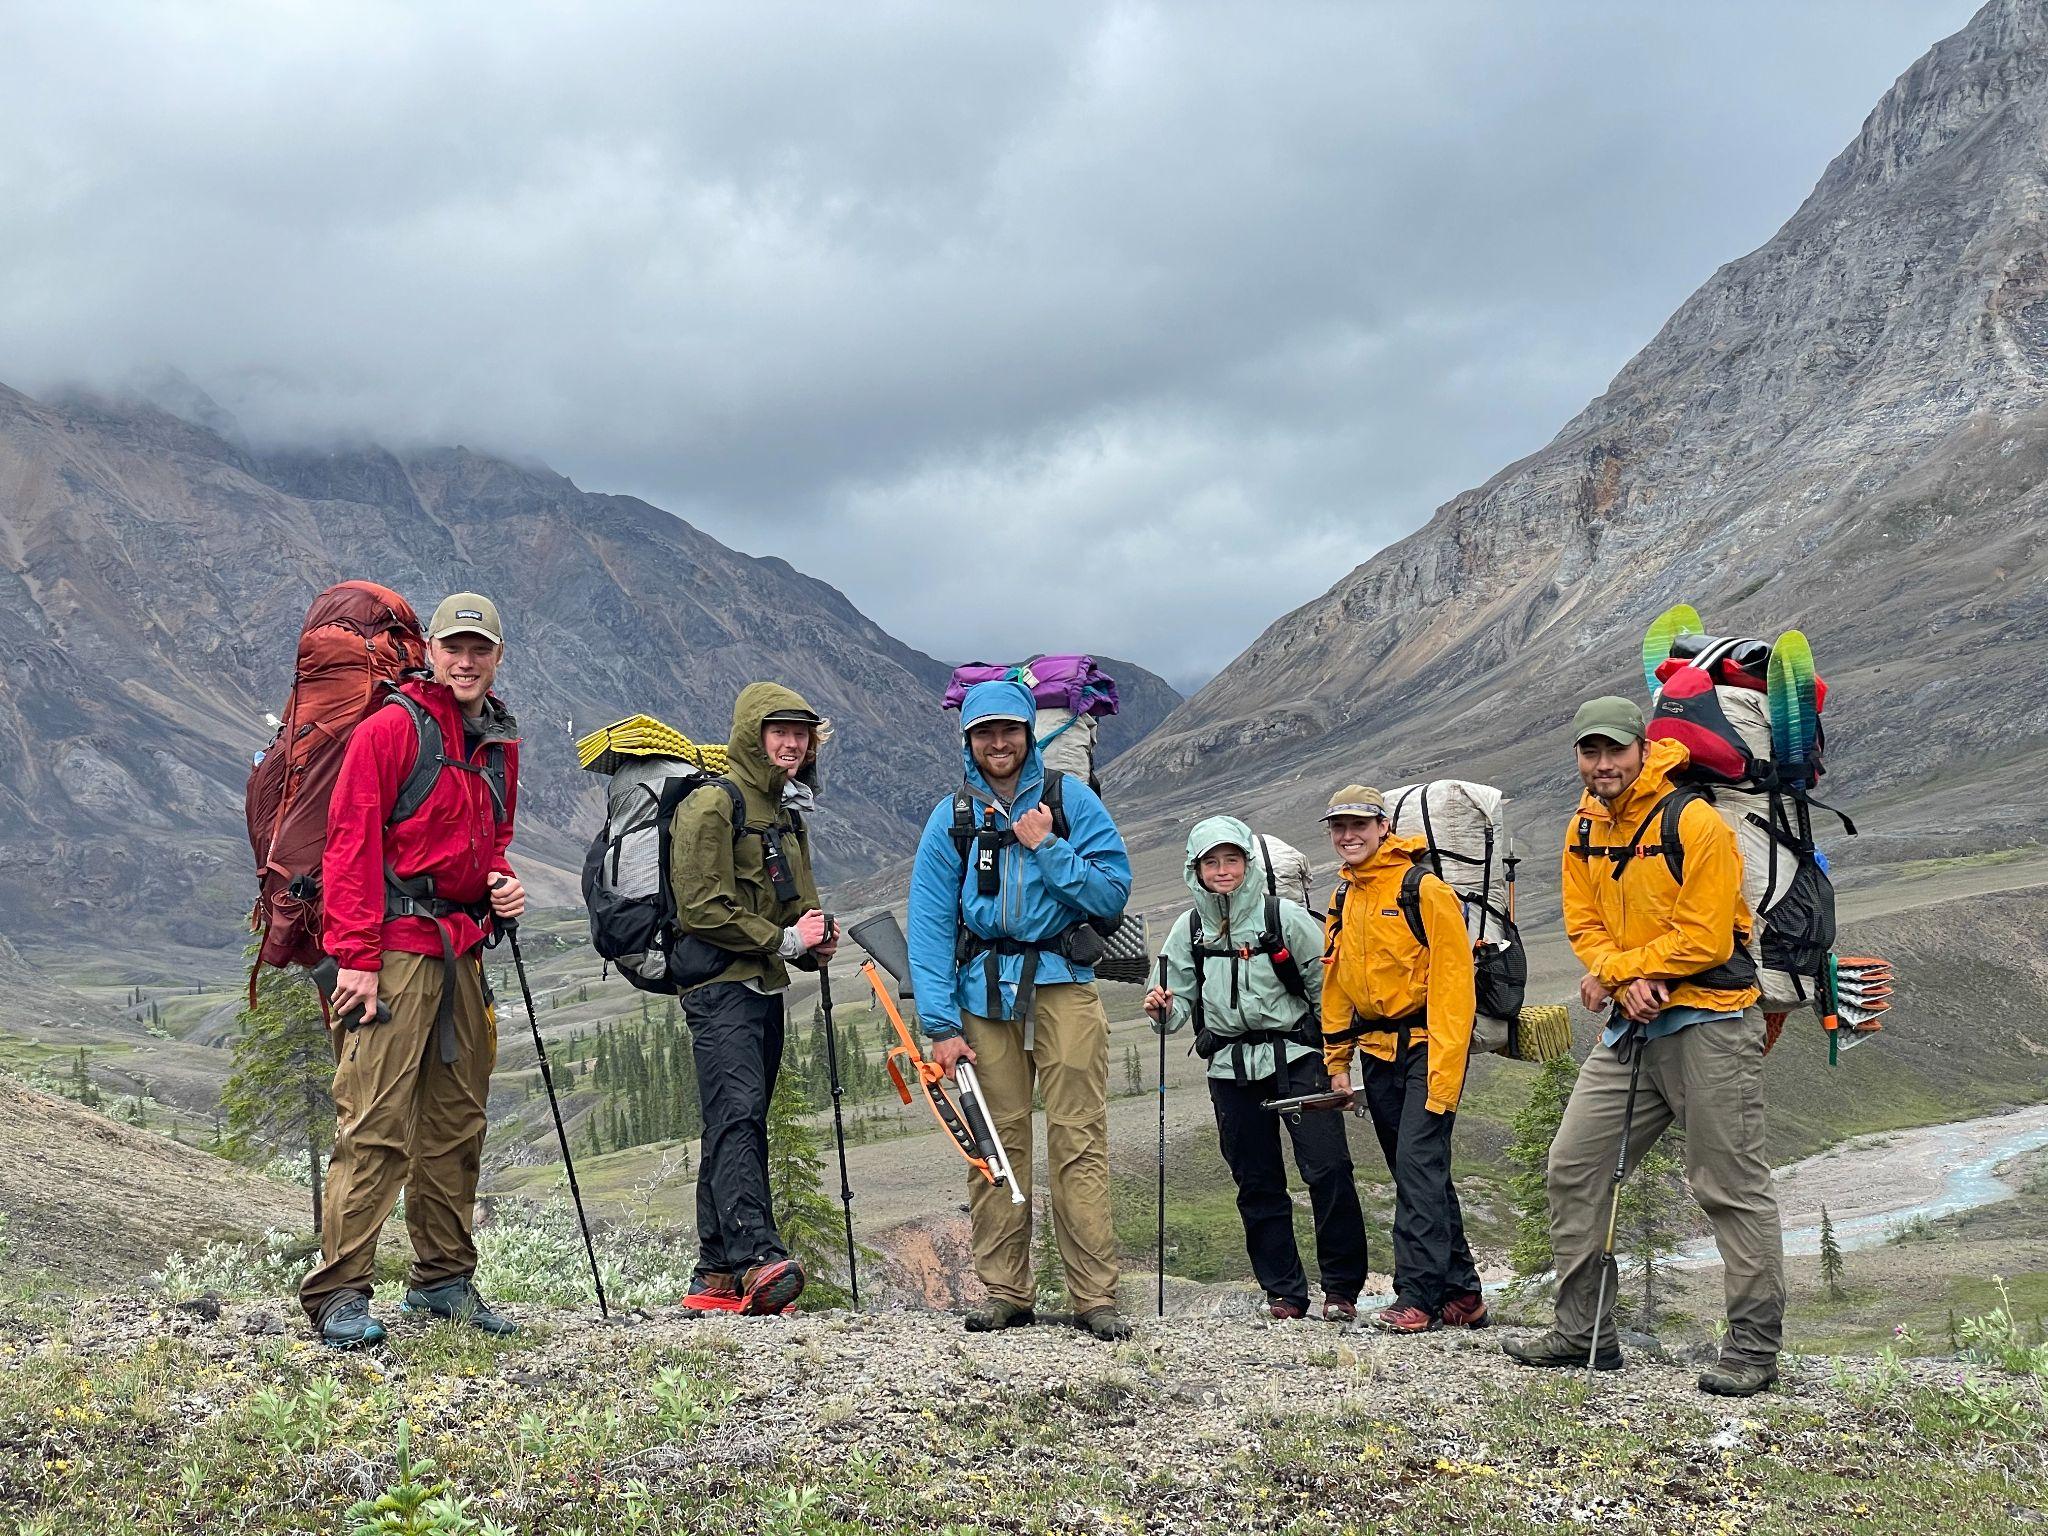
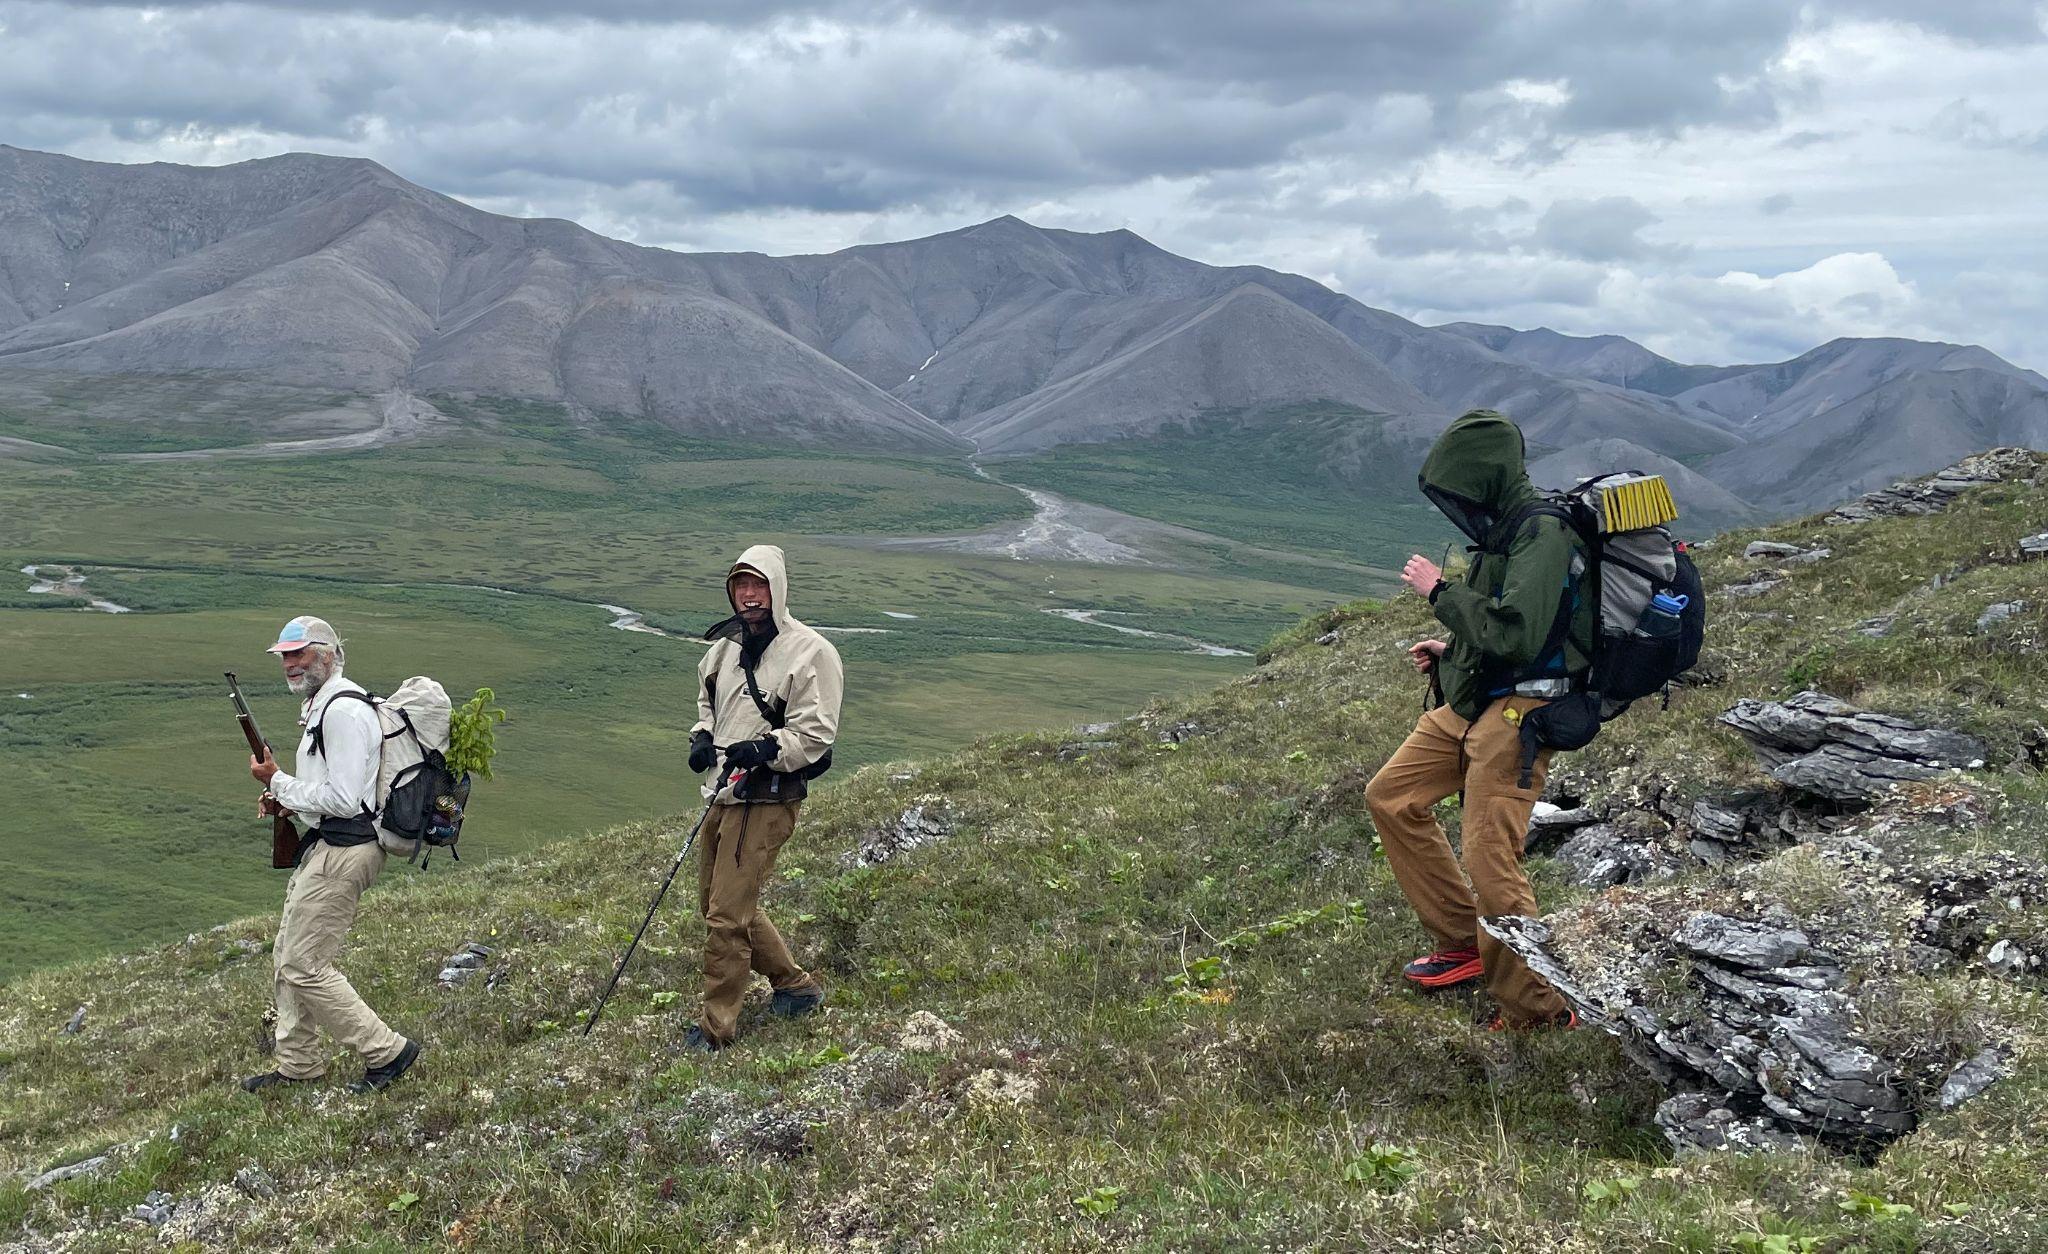
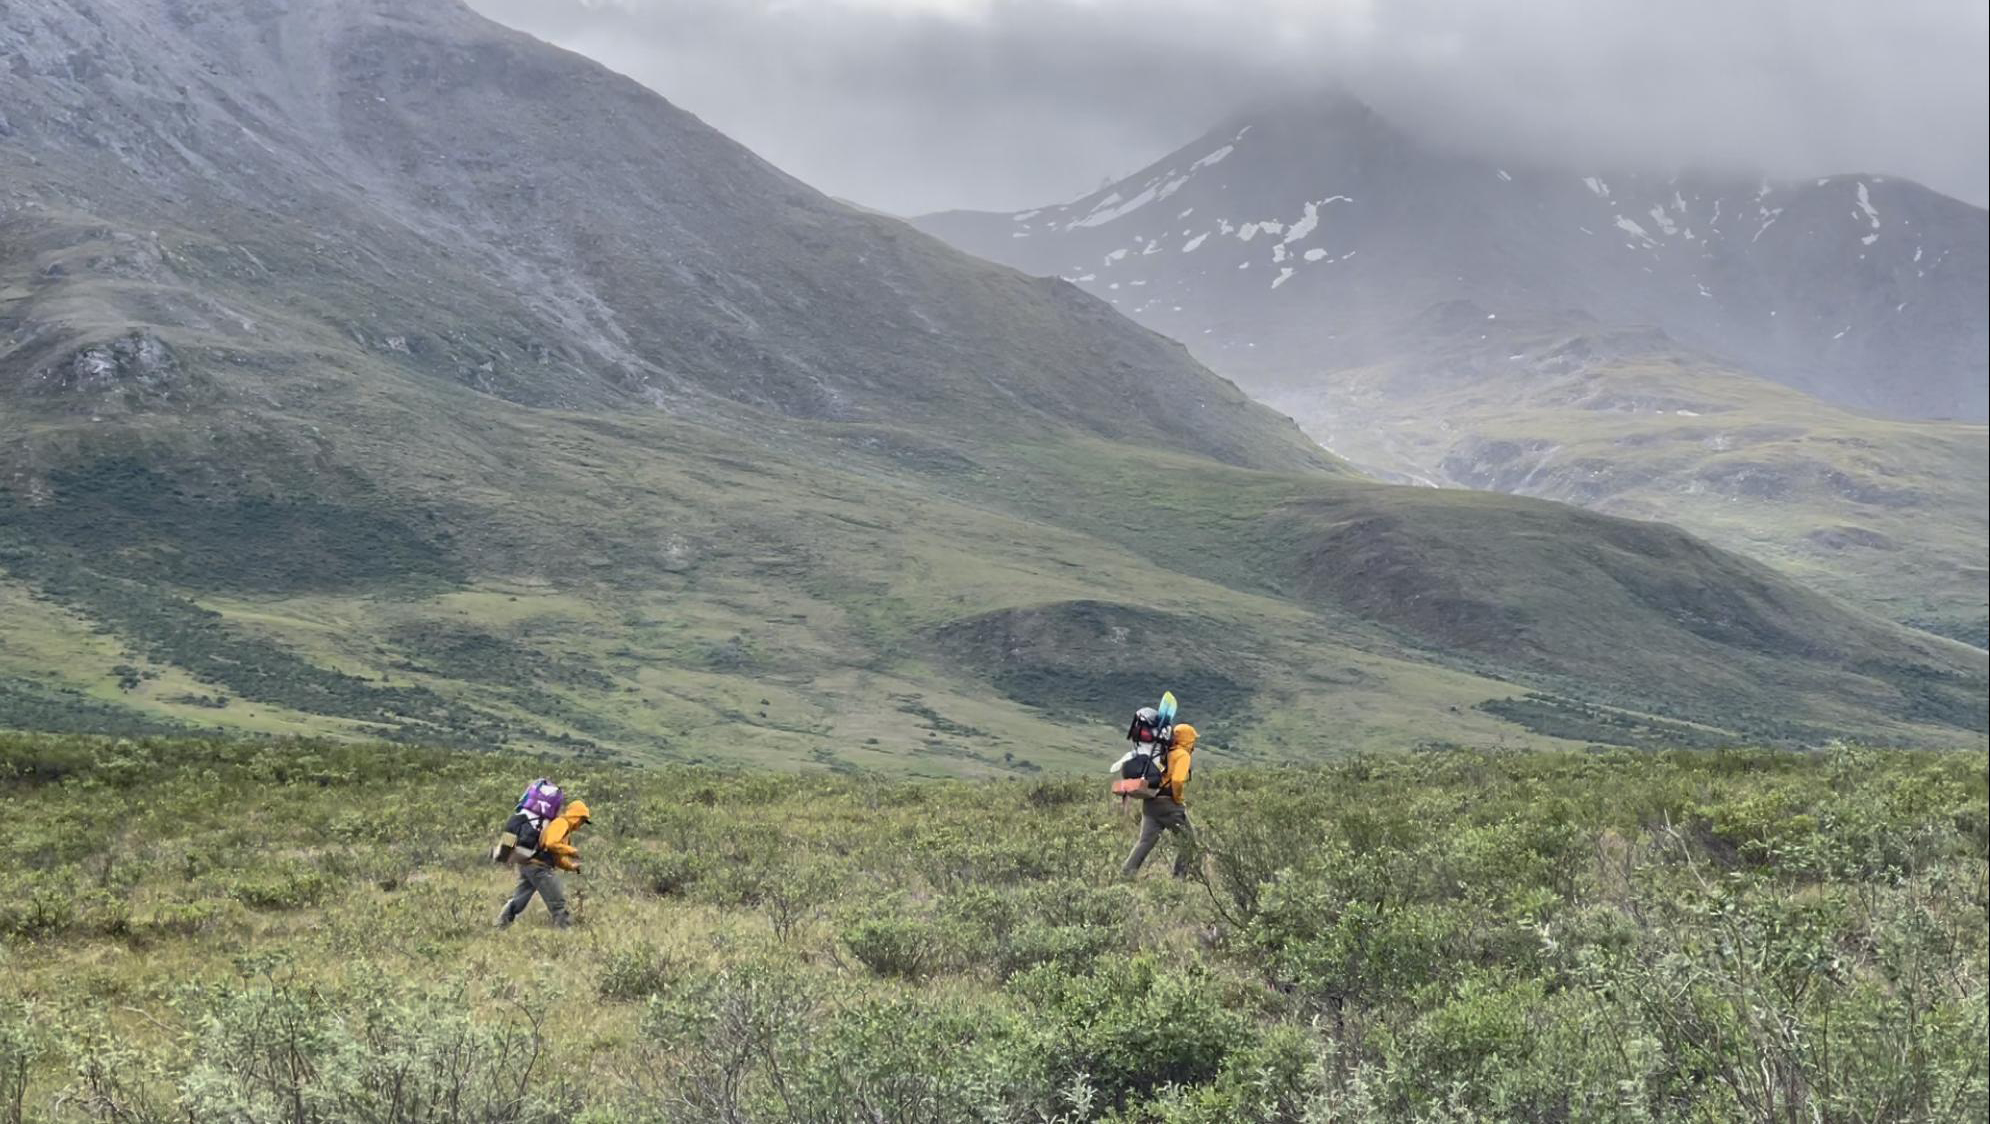
The Brooks Range forms a natural barrier that separates the boreal forest of Alaska’s interior from the arctic tundra of Alaska’s North Slope. This mountain range includes the largest complex of protected wilderness in the United States, including 21,000,000 acres among the Arctic National Wildlife Refuge, Noatak National Preserve, and Gates of the Arctic National Park. Berner and Burns joined Dial’s research team as they trekked from the northern edge of boreal forest into the Noatak Wilderness where trees give way to thickets of shrubs, wetlands, and barren rocky ridges. During the course of 11 rain-soaked days, the team followed caribou and brown bear trails through verdant valley bottoms and over cloud-choked mountain passes as they traversed about 80 miles from the Ambler River to the Cutler River. While trekking, the researchers collected ecological field data to be linked with measurements of vegetation greenness from NASA Earth-observing satellites.
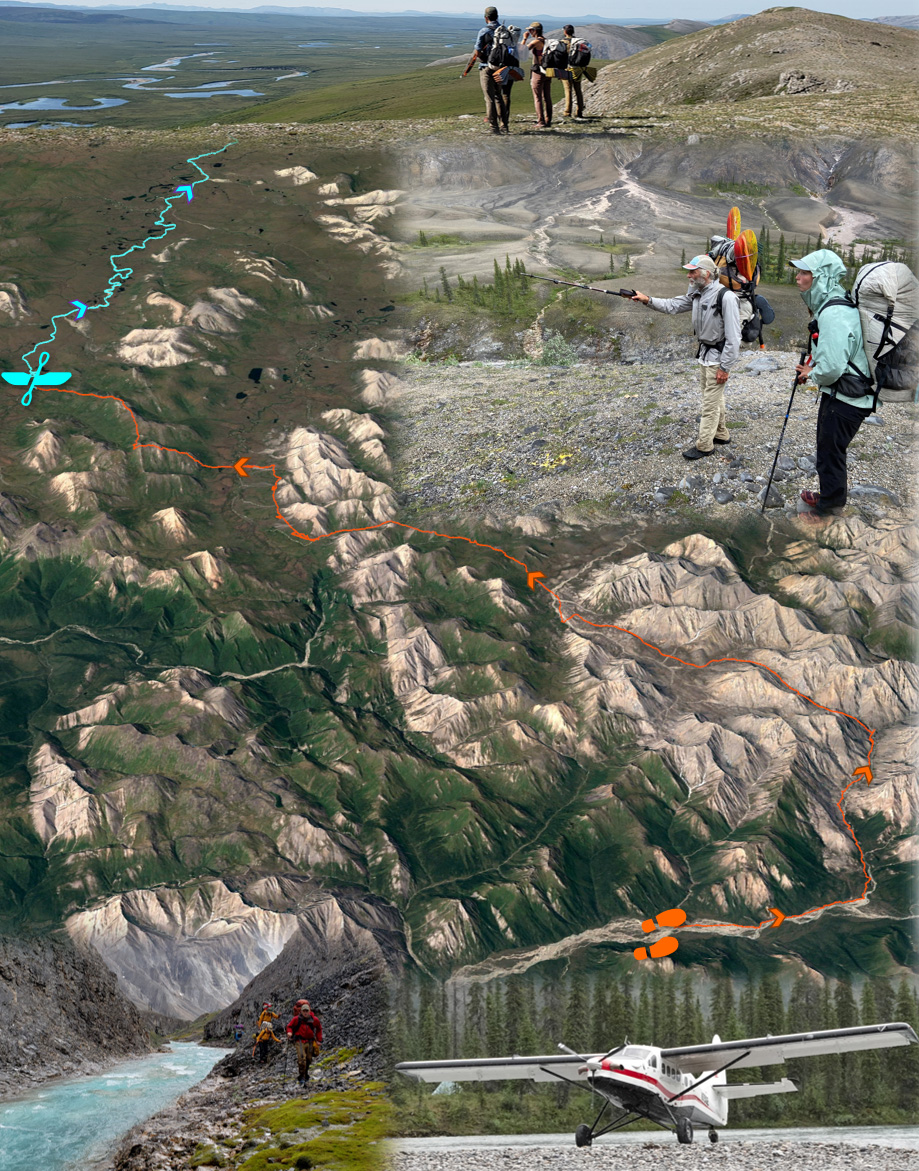
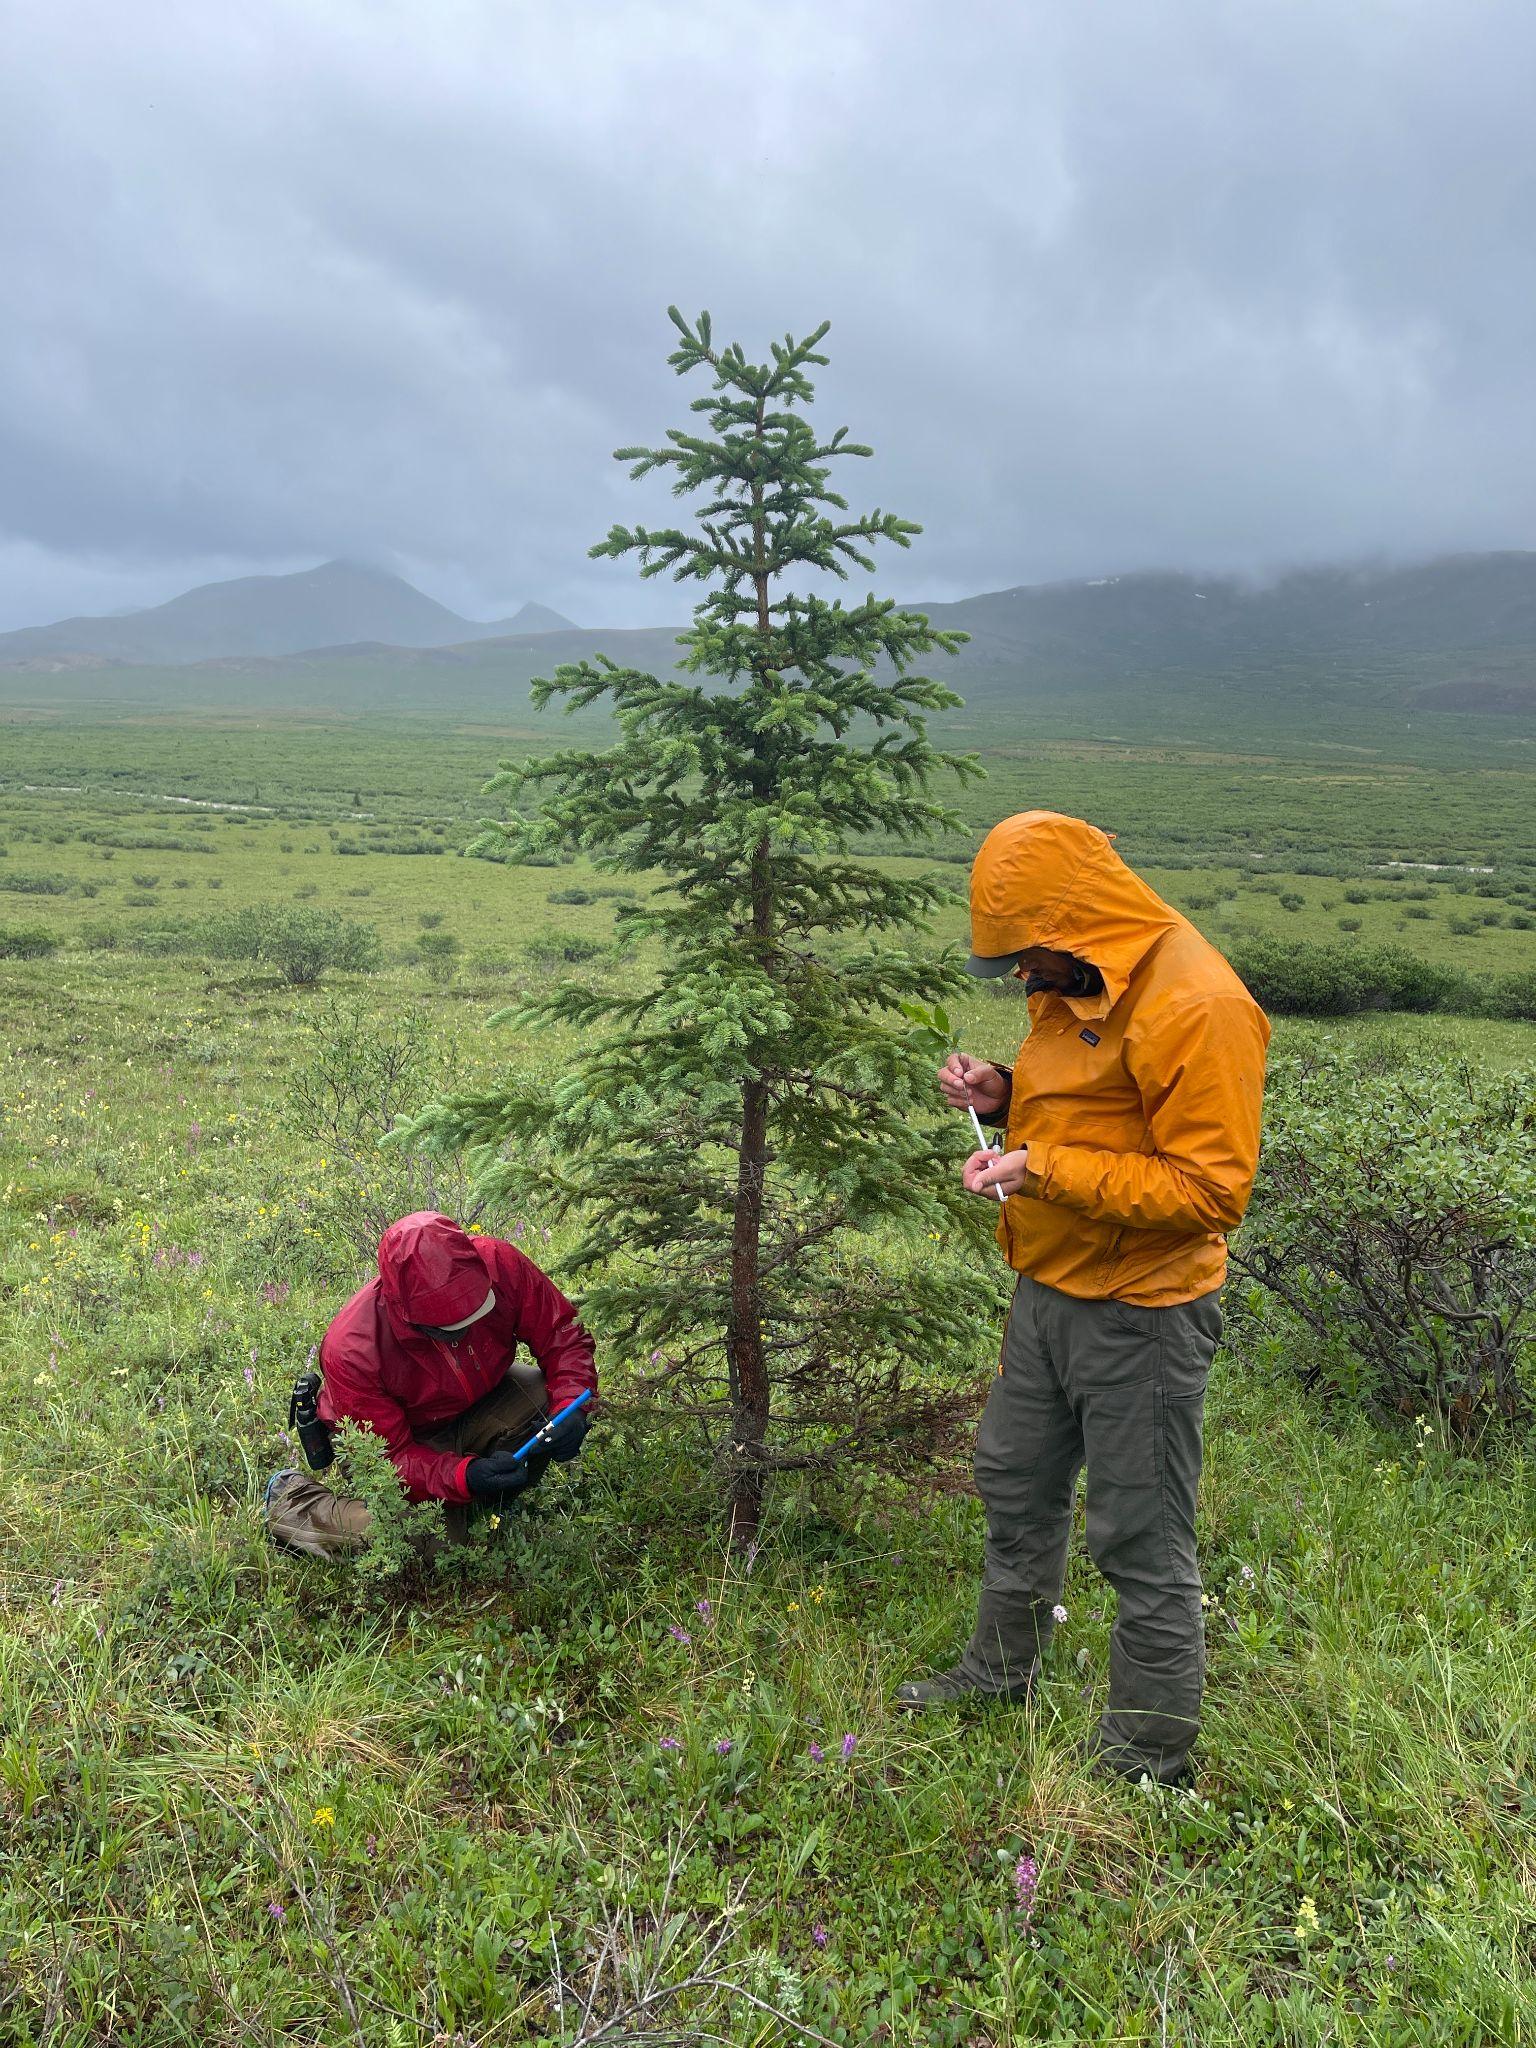
Ecological research often involves establishing field plots and then meticulously characterizing the composition and other attributes of the plant community in each field plot. Plot sampling provides valuable information, but the time consuming nature of the approach limits the spatial extent over which measurements can be made. Dial recognized that to better understand recent greening and browning, there is a need for more spatially extensive information on plant community composition than can be provided by field plots alone. He thus has pioneered an alternative approach that involves continuously documenting plant community composition and other attributes while trekking across the landscape. Termed “pixel-walking”, this approach harnesses the multifunctionality of smartphones to record and geolocate visual observations of vegetation composition and density for the overstory, midstory, and understory. While pixel-walking, researchers record a new observation every time they visually detect a change in vegetation composition or density at about a 30 meter spatial scale, corresponding to one pixel from the Landsat satellites. These spatially extensive field observations are thus collected with the explicit goal of being linked to decades of Landsat satellite observations.
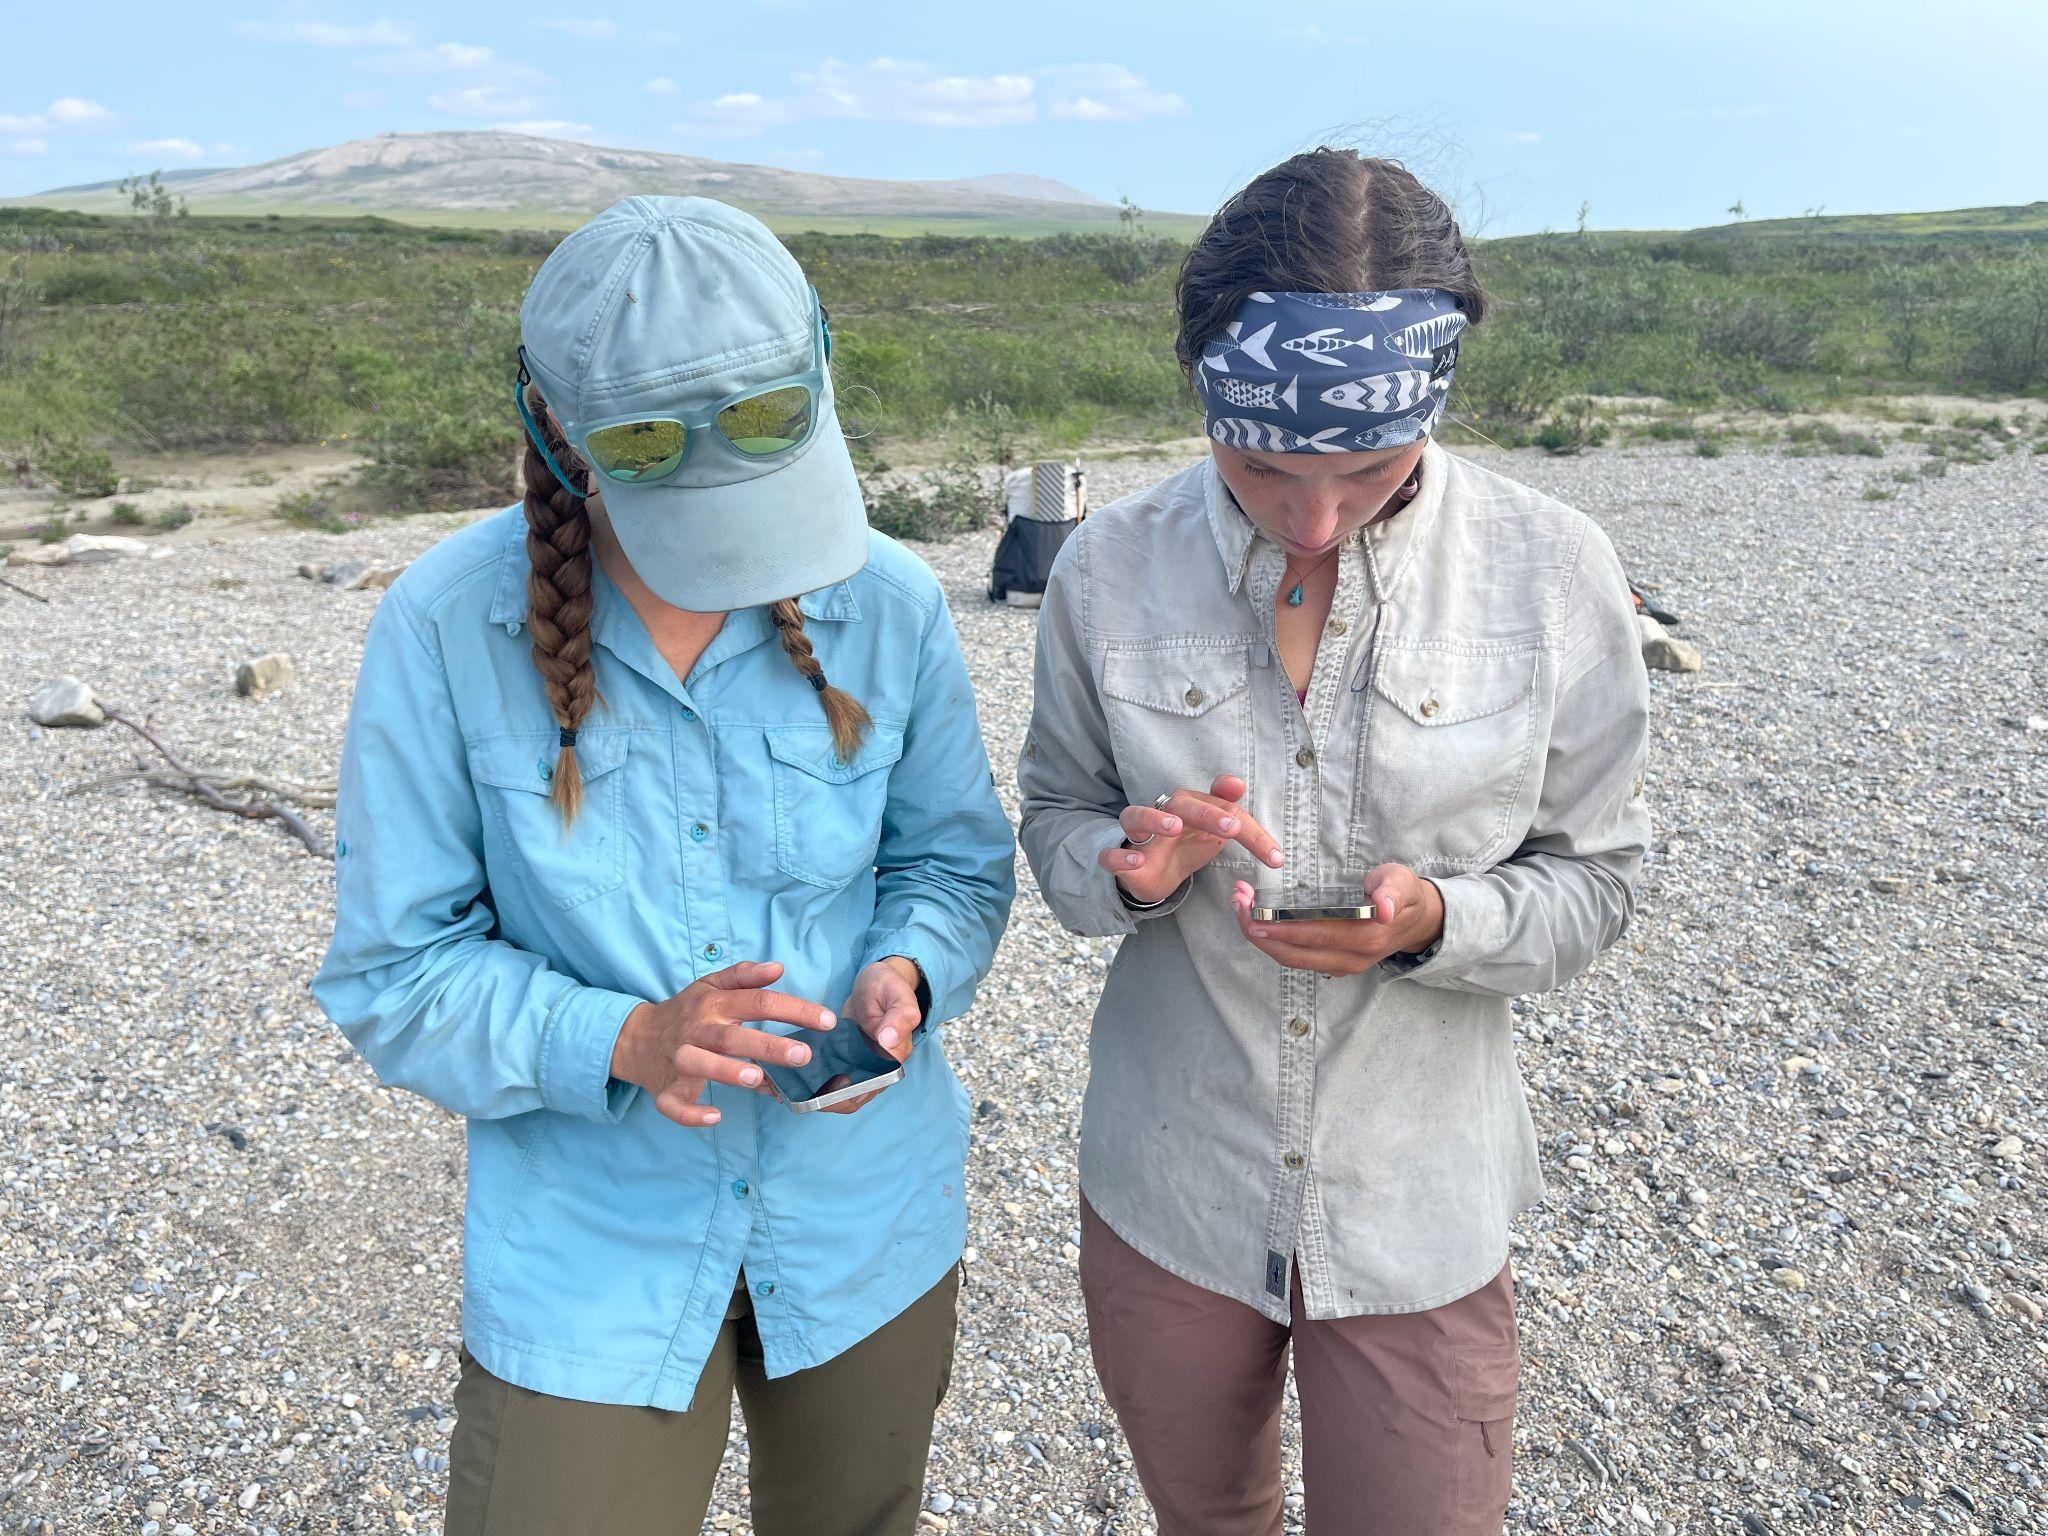
During summer 2021, Dial’s research team pixel-walked over 800 miles from east to west through the Brooks Range, collecting data on vegetation composition for about 100,000 Landsat pixels. Over the coming year, Dial’s team will work with Berner, Burns, and Professor Scott Goetz (ABoVE Science Team Lead) at NAU to link these extensive field data with several decades of Landsat satellite observations provided by NASA. This collaboration will help unravel the mysteries of Arctic greening and browning by shedding light on where, how, and why plant communities changed in recent decades. NASA’s Earth-observing satellites provide long-term observations that are crucial for monitoring and understanding ongoing environmental changes in the rapidly-warming Arctic, especially when complemented by field data collected across large regions.
When asked how you get to Vandenberg Air Force Base, Boston University’s Brian Walsh and his Goddard Space Flight Center (GSFC) co-investigators are likely to reply “Practice, Practice, Practice” and “Teamwork, Teamwork, Teamwork.” They’ve been at this business for quite a while.
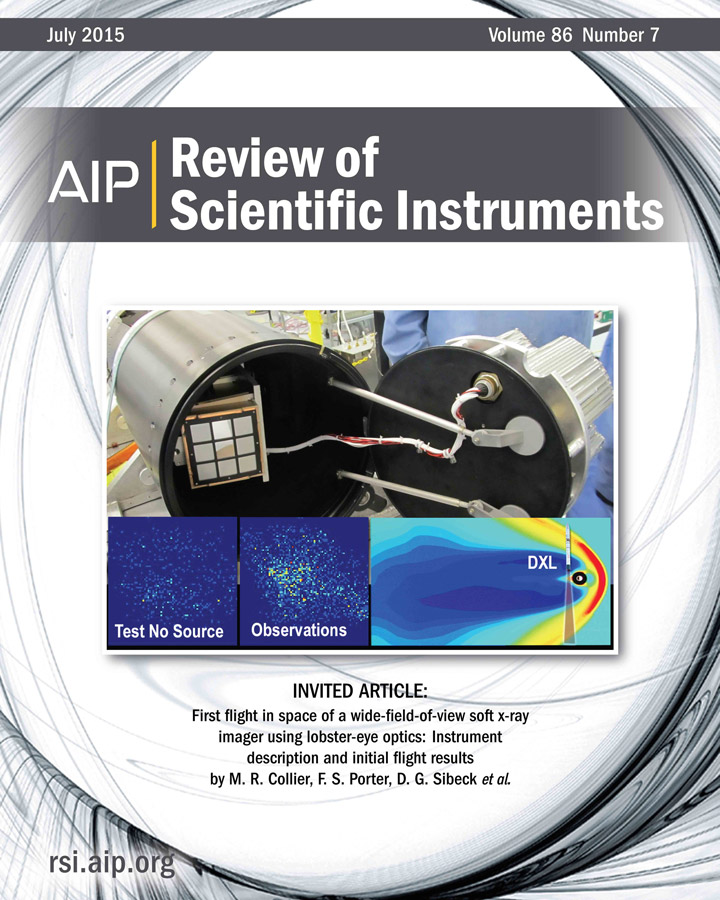
It all started in 2005, when GSFC astrophysicist Scott Porter told GSFC heliophysicist Michael Collier about a soft X-ray foreground signal coming from the vicinity of the Earth that astrophysicists were struggling to remove. The signal was interfering with their efforts to image distant stars and galaxies. Michael’s eyes widened in surprise – he immediately realized that heliophysicists could use this ‘unwanted’ signal. This soft X-ray signal was produced when solar wind ions collided with atoms in the Earth’s outer atmosphere, exchanging electrons. By carefully imaging it, they could paint the outline of the invisible magnetic bubble, or magnetosphere, surrounding Earth that shields us from the oncoming solar wind.
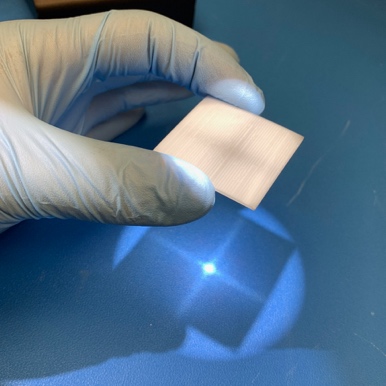
Colleagues at the University of Kansas ran simulations to calculate the strength of the X-ray signals, while Scott and Michael set out to find the right technology for the task. Working with partners at the University of Leicester in the United Kingdom, they realized that so-called ‘Lobster-eye’ optics could do the trick (see Figure 2). These special cameras could take wide field-of-view pictures of the X-rays.
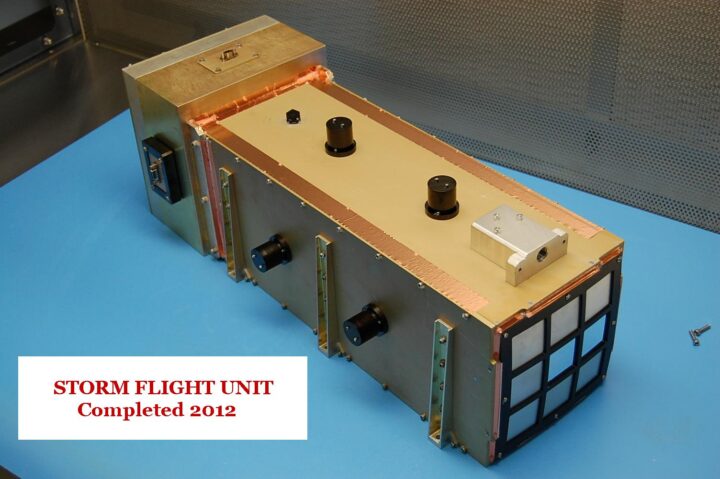
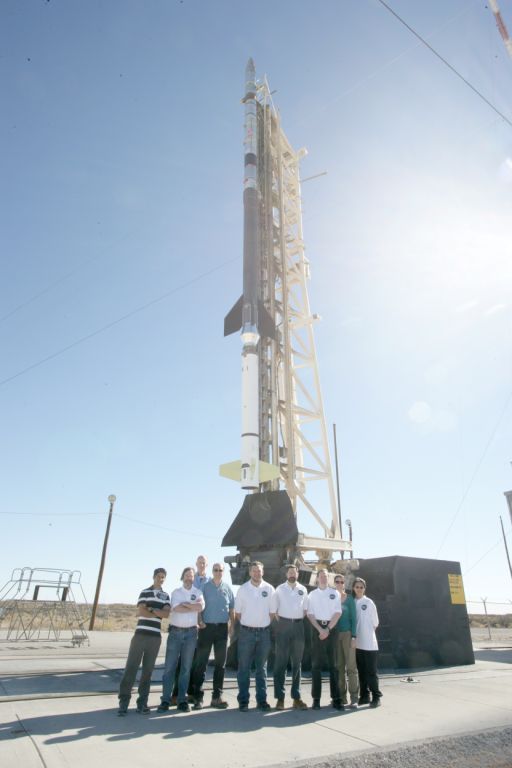
Fast forward to the Decembers of 2012 and 2015, and Scott, Michael, and GSFC Post-Doc Brian Walsh are launching prototype ‘Lobster-eye’ telescopes on the DXL-I and DXL-II rocket flights from White Sands, New Mexico. It was near midnight on December 12, 2012. A few hundred feet away, the DXL sounding rocket had just lifted off from White Sands Missile Range carrying, as a secondary payload, the Sheath Transport Observer for the Redistribution of Mass or STORM instrument, the first wide field-of-view soft X-ray imager ever launched into space.
Michael remembers sitting hunched over a terminal, his index finger hovering nervously over the ‘self-destruct’ button. Should there be any evidence STORM was jeopardizing the success of the main DXL mission, the principal investigator would order Michael to shut it down. Thankfully, that order never came. Despite a bumpy launch and an equally bumpy crash landing, the instruments were recovered, undamaged, from the bone-dry desert plains of New Mexico. They had functioned perfectly throughout their brief flights into the nighttime sky. Michael wrote up the paper and it took pride of place on the cover of the journal.
These successful rocket flights laid the groundwork for Dr. Brian Walsh, now a professor at Boston University, to propose and win funding to fly the very same lobster-eye soft X-ray imager again. This time, it would be the main science instrument on the forthcoming Cusp Plasma Imaging Detector, or CuPID CubeSat. Brian’s first-year grad student Emil Atz inherited the CuPID design and some hardware from GSFC engineer Lisa Billingsley. He became responsible for taking the hardware from model to flight, spending days (and nights) in the machine shop and lab making parts, sometimes multiple times because he messed some up and had to remake them. Emil, now lead engineer, says “I remember wondering whether NASA would ever send something I worked on to space.” One year later he was putting the avionics and instruments into the chassis Lisa had designed and he had modified and built.
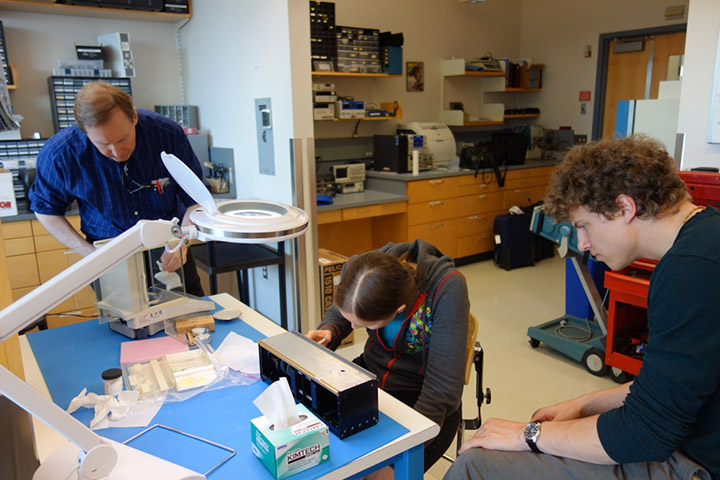
Systems engineering normally conducted by a spacecraft bus vendor was nearly entirely accomplished by the CuPID team. Although the avionics were purchased from a vendor, the design and integration of many elements were conducted by students and GSFC engineers. For example, the BU team built CuPID’s solar panels and the Merrimack team tested the settings for CuPID’s deployable radio antenna.
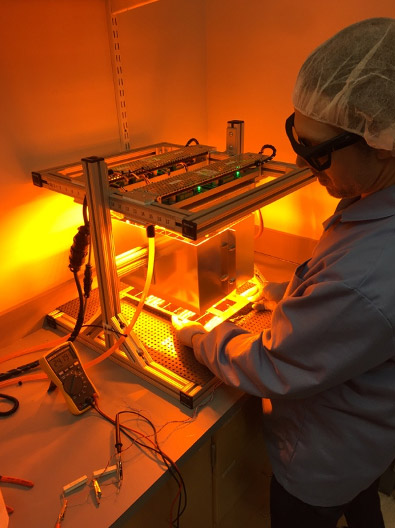
The COVID-19 pandemic caused a lot of problems. Early in the pandemic, Emil and crew drove down from Boston to GSFC to pick up the spacecraft and to keep the work on it going forward. Over the next year, he and colleagues came into the Boston University lab every day, testing the avionics, bus systems, software, and all three instruments. Discovering issues, he would contact the instrument or software teams, ask them what was going on, and conduct more tests and analysis until he figured out the problem. “It was fun – sometimes I felt like a detective,” Emil said. Over the past 4 years he and Professor Walsh have supervised 25 students as they worked on CuPID.
CuPID is now scheduled for launch as a rideshare with Landsat-9 from Vandenberg Air Force Base in California on September 27, 2021. The spacecraft has already been delivered and the team is getting ready to travel. But more about that later…
