Alex Haughton is a graduate student in the Astrophysical and Planetary Sciences department at University of Colorado Boulder studying ultraviolet instrumentation with sounding rockets. His team has traveled to Equatorial Launch Australia’s Arnhem Space Center near Nhulunbuy, Australia to launch the Dual-channel Extreme Ultraviolet Continuum Experiment (DEUCE) Sounding Rocket and observe the stars Alpha Centauri A & B in extreme ultraviolet wavelengths.
The light of a waxing gibbous illuminates the eucalyptus forests of East Arnhem Land. A mild breeze rustles the trees, and clouds pass overhead, first obscuring and then revealing Alpha Centauri A & B, our targets. A Hunstman spider we named “Jeremy,” recently displaced from its position guarding the detonator switch, scuttles along the ground near where the DEUCE payload stands vertical, perhaps moments away from being launched into space.
30,000 feet above this scene, a weather balloon floats, taking wind measurements and beaming them back down to the Range Control Center. The countdown is approaching T-minus two minutes, and range safety officer Brittany Empson concentrates on the wind readings. While the overall velocity of the winds has been low enough to continue, the variability of the winds this evening has been too high to launch – the tail end of a storm over Indonesia just clipping the Gove Peninsula where the launch range stands. Unless the variability goes down, Brittany will have to call for a hold, resetting the countdown to T-minus three minutes. Five seconds before she must make the call, the variability number drops into the green.
“RSO Check Item 140,” she announces. She continues watching the data come in – if it goes red anytime in the next two minutes, the count must be reset. Next to her, campaign manager Max King begins polling various people to “Report GO Status.” There’s a rhythm to it, exactly as you imagine from the movies:
“ACS?”
“Go.”
“CUF?”
“Go.”
“NFORSe?”
“Go.”
“PTM?”
“Go.”
And so on and so forth. A couple hundred meters away from the Range Control Center in the Command Uplink Facility (CUF), where the science team sits, chills run down my spine, and I do my best not to get emotional. Our team has been building to this moment for at least the past year, and more personally this night represents a dream come true for me. I’ve watched the two previous payloads launch, and while both of them were awesome, this time I’m in the room, and I have things to do. It’s real.
Dr. Brian Fleming, the principal investigator (the one who proposed the project and won funding to make it happen) announces “Go” for us. Also in the room are Emily Witt, the senior graduate student on the launch, Alex Sico, our technician, and Chris “Hox” Hoxworth, who runs the uplink equipment in the CUF and whose calming voice has guided many a graduate student through this stressful situation over the year. With 30 seconds left in the countdown, we scurry outside the CUF; our next responsibilities are one minute after launch.
We can’t see the rocket from our vantage point, as it is hidden behind trees, but we know in which direction it lies. The speakers on the range count out the last ten seconds, and the night seems to hold its breath in anticipation: “Ten, nine, eight, seven, six, five, four, three, two, one…”
The light comes first, a bright flare revealing the trees and the trucks, trailers and radar dishes, and then just as the top of the payload crests the trees the resounding wall of sound crashes into our ears.
BOOM.
The rocket flies up, up, and away, the first stage burning through its fuel in a mere six seconds before silence engulfs the night again and only an echo, perhaps real, perhaps imaginary, of that first guttural roar is left bouncing through my head. Emily and Brian quickly dash back in to get to their stations, but I linger a few seconds longer and catch the second stage of the rocket igniting before following them.
I check the screen I am assigned to watch: the numbers look not good but great – the temperatures and voltages are as they should be, even the vacuum gauge is reading surprisingly low. By 77 seconds into the flight the vacuum gauge finally starts increasing slightly before the shutter door opens and it drops back to zero. At this point the payload has separated from the two rocket motors and the Attitude Control System (ACS) begins pointing us towards our star. It appears on the touchscreen Emily uses to steer, and she leans into her screen, eager to move it to the correct place. She can’t quite yet, though: She has to wait for the ACS engineer, Brittany Barrett, to give her the go ahead. Excruciating seconds pass.
“ACS on target and ready for uplinks,” reports Ms. Barrett.
Emily quickly begins steering the telescope’s slit to align with the star, fingers flying over the screen: Target, Set, Send. Data is now coming in on the detector screen, and Brian begins reading out count numbers: more is better.
“132… 214… 189… 488… 603… 488… 603,” he reports. On the screen Emily has the star roughly aligned with the slit, but our pointing is a bit bouncy, so she is consistently nudging it back into line. Finally, a few minutes in, it largely settles where it is supposed to. On the data screen we watch as photons hit the detector, concentrating on the area where there should be spectral lines, the indication that we are getting data from the star and that the data will have interesting science results.
“There!” exclaims Brian, his finger indicating a region with more counts. “That’s a line. We have data!” There is still some tension in the room: Emily continues to nudge the star to get the best results, and Brian continues hunting for other obvious lines, but relief is starting to set in. We are getting what we came here for.
Seven minutes and six seconds after takeoff the shutter door closes. The payload reached its apogee of 258 kilometers and is falling back down to Earth. It will launch a parachute and hopefully land gently (some landings are gentler than others). We leave the CUF to head for the RCC, handshakes, hugs, and general celebration. Somewhere, Jeremy the Hunstman spider crawls away, seeking a hunting location unoccupied by space goers. The work isn’t done, but the scary part is. Success.
This is it. Launch night.
Sounding rocket scientists are the space cowboys of NASA. Satellite missions like the James Webb Space Telescope (JWST) do incredible science but are much more expensive and take much longer (almost $10 billion and 30 years) to build and launch into space. One of the main reasons for that is that JWST is designed to not fail. It will be in space taking data for over ten years, and therefore a huge amount of testing and redundancy is needed to ensure reliability and longevity.
Sounding rockets, on the other hand, take on a much larger amount of risk. I haven’t yet attended a failed sounding rocket launch, but stories percolate throughout the community. Once a rocket went off track so the self-destruct system (yes, this is a real thing in sounding rocket launches at White Sands Missile Range) was activated. Another time lightning struck a payload as it was sitting on the ground and it flew horizontally through a wall. Less dramatically, it’s possible for the telescope to go out of focus on launch, or for the star tracking system to fail and us to not be able to find the target in the five minutes allotted to us.
That’s right, five minutes. A sounding rocket flight takes only 15 to 20 minutes, of which about five are used to collect science data. Once that window opens up, the graduate student uses a computer-aided guidance system to steer the intended target into the telescope. The time it takes to do that is seconds shaved off of the time collecting data. If a student takes 30 seconds, that’s a tenth of the potential data lost. So the pressure to perform is real.
In return for more risk and shorter flight times, sounding rockets provide a fast and cheap route to prove the viability of cutting-edge instrumentation. A sounding rocket program costs about $1 million a year to run and launches a rocket about once a year. When you put a new instrument on a project like JWST, you want proof that that technology will work in space as advertised. Sure, there are vacuum chambers and radiation chambers and other laboratory equipment on the ground that attempt to mimic the conditions of space, but none of them are as good a test as going there. Sounding rockets go there and use the latest and greatest to do new science. If the instrument (or rocket) fails, we can rebuild and try again at no great cost. If it succeeds, the instrument has been proven to work in space, and can now be used on bigger but lower risk projects like JWST.
So as we prepare to launch the Dual-channel Extreme Ultraviolet Continuum Experiment (DEUCE) tonight to observe Alpha Centauri A & B, there is a real chance that things go wrong. Everyone involved has done this before—it’s a levelheaded crew steering this operation. But the jitters are real. Catch you on the flip side.
Alex Haughton is a graduate student in the Astrophysical and Planetary Sciences department at University of Colorado Boulder studying ultraviolet instrumentation with sounding rockets. His team has traveled to Equatorial Launch Australia’s Arnhem Space Center near Nhulunbuy, Australia to launch the Dual-channel Extreme Ultraviolet Continuum Experiment (DEUCE) Sounding Rocket and observe the stars Alpha Centauri A & B in extreme ultraviolet wavelengths.

We learned in school that plants take in CO2 and water and use light to drive photosynthesis to grow. But what you may not know is that as part of the process of photosynthesis plants also emit light, called chlorophyll fluorescence. The fluoresced light provides information about the rate of photosynthesis and plant responses to stress. Although the fluoresced light is very dim, we can use sensitive instruments to measure that fluorescence, and this can be done even with satellite instruments in space.
Arctic tundra is the coldest ecological community. It circles the high latitudes of the northern hemisphere which is experiencing strong climate changes that affects the growth of tundra plants. Much of the tundra regions are remote and very hard to reach, so it is difficult for us to know just how tundra is responding to climate change. Satellites flying overhead can provide information about the tundra across the entire region, even in all of those difficult to reach places. In our project, “clarifying linkages between canopy SIF and physiological function for high latitude vegetation,” we want to learn how to use the fluorescence signal to describe the functioning of the tundra ecosystem so that we can understand how the diverse tundra vegetation is responding to climate change and make the best use of satellite images of this region. Our project is part of the NASA Terrestrial Ecology program’s Arctic-Boreal Vulnerability Experiment (ABoVE), a large-scale field study in Alaska and western Canada, whose overall goals are to make use of NASA technology to gain a better understanding of ecosystems at high latitudes, their responses to environmental change, and the effects of those changes.
This took our team—from the University of Maryland Baltimore County, NASA’s Goddard Space Flight Center, and the University of Texas El Paso—north to Utqiaġvik (formerly Barrow) Alaska on the shores of the Arctic Ocean. Utqiaġvik, the northernmost city in the United States, is on the lands of the Iñupiat people. There are no roads to Utqiaġvik, so all of our equipment had to be shipped by air up there.
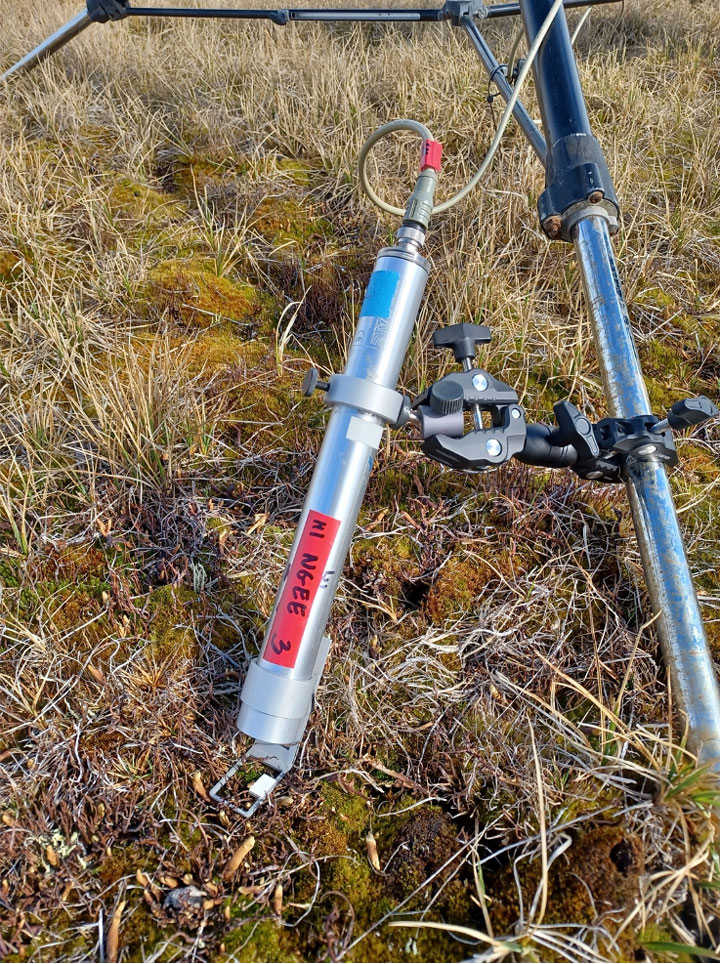
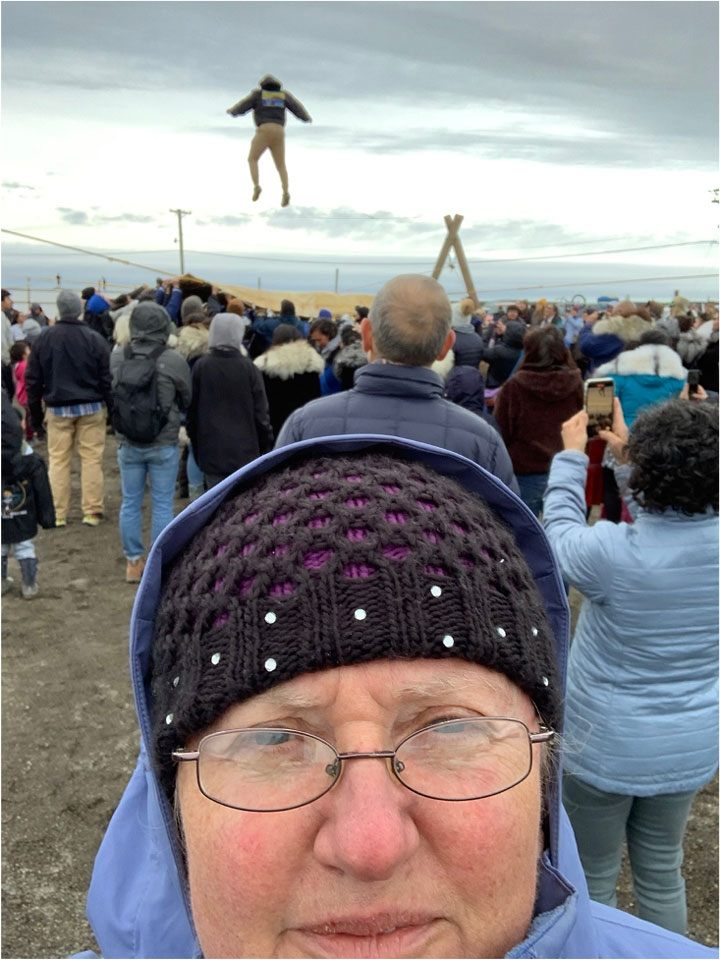
The goal of our June campaign was to install automated sensors to capture the springtime green-up of the tundra. Even though it is June and after the official first day of summer, spring is just starting in Utqiaġvik. There is ice in the ocean (Figure 1), the snow is just melting off the land, and the tundra is brown. Our instruments include the FLoX (Fluorescence Box) that measures the reflected light and solar induced chlorophyll fluorescence of patches of the tundra (Figures 2, 3 and 4) and the monitoring PAM (MoniPAM) whose probes illuminate small patches of leaves or moss with controlled pulses of light to measure fluorescence and photosynthetic processes at the leaf level (Figure 5). These instruments automatically measure the fluorescence throughout the day to observe the effects of varying light levels and temperatures and through the course of the growing season as the tundra plants grow. The FLoX gives us measurements that are similar to the kinds of data we can get from satellite. Making these measurements on the ground lets us know exactly what we are looking at, which helps better understand what the data mean.
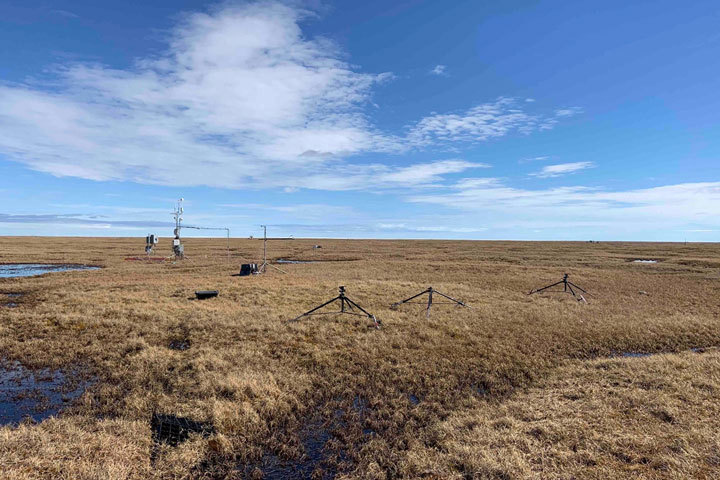
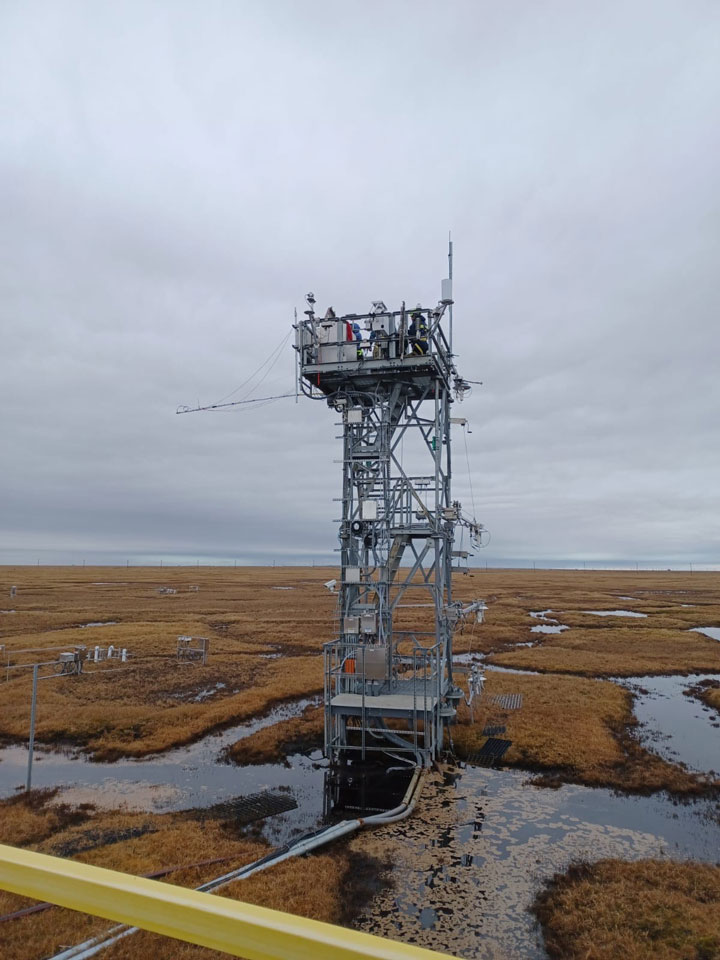
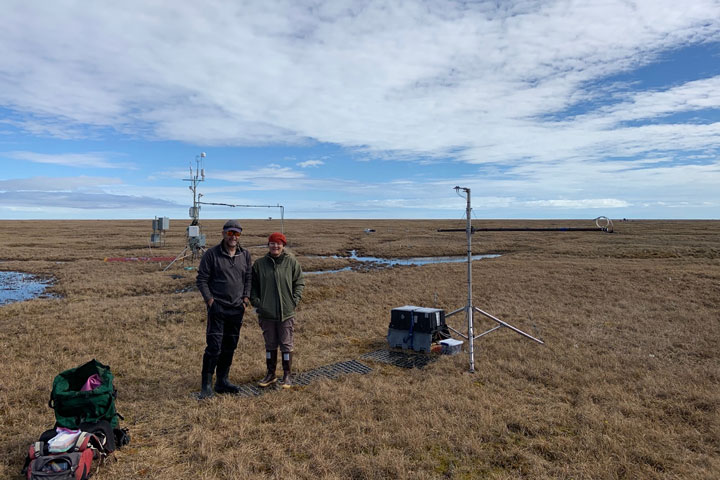
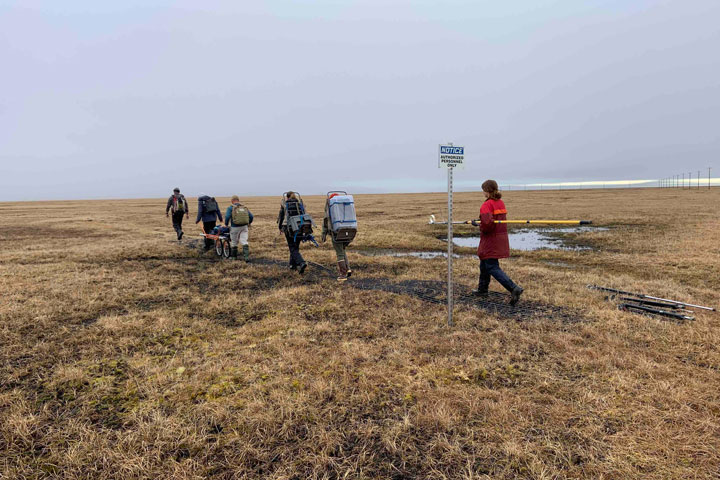
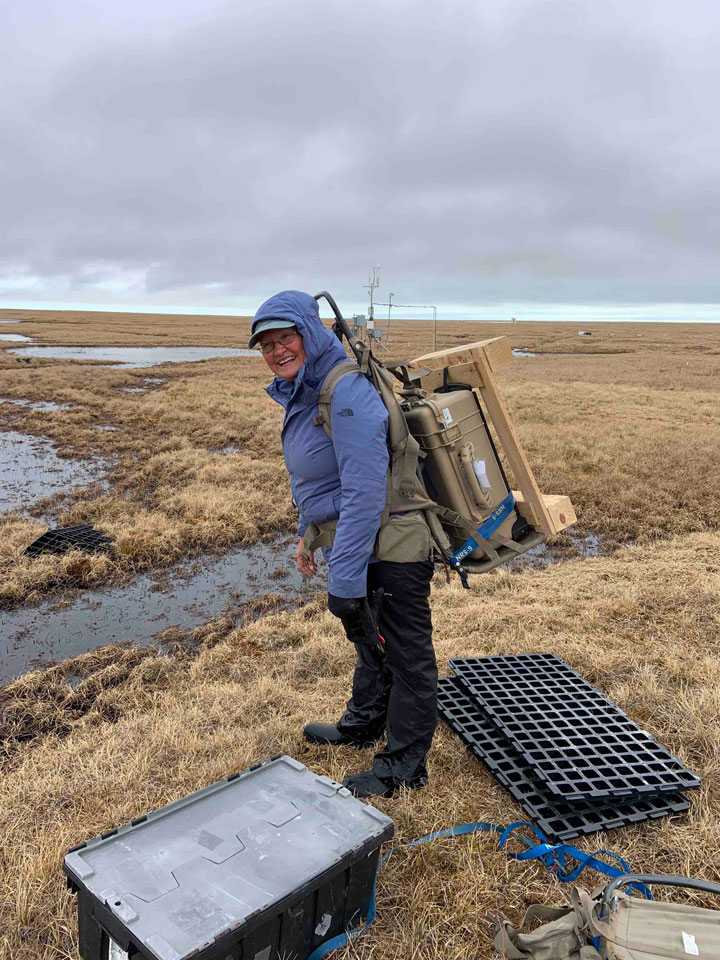
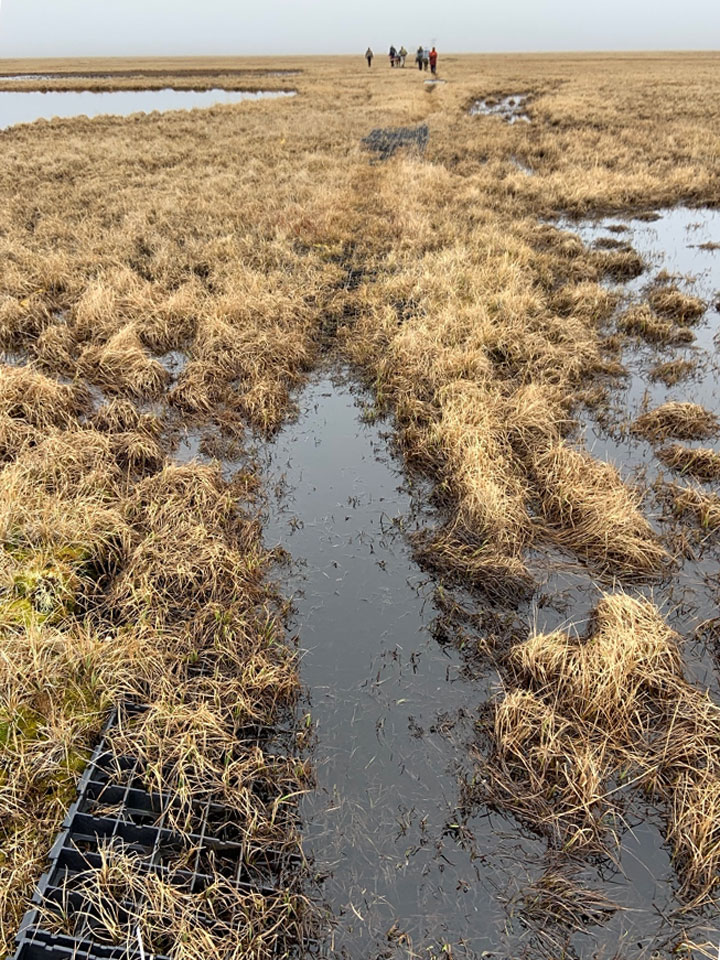
Our instruments are deployed at existing flux tower sites. Flux towers measure water, heat, and carbon dioxide exchange between the ground and the atmosphere as well as provide weather data. The flux towers were about a mile from the nearest road, so all of our equipment had to be backpacked into the sites (Figures 6 and 7). It is a soggy hike in because this time of year the tundra is very wet, since the snow has just melted and the soil is still frozen keeping the water from seeping into the ground (Figure 8).
One site is the Department of Energy Next Generation Ecosystem Experiment (NGEE) Arctic flux tower and here we are measuring a drier tundra site (Figures 2 and 4). The other site is the National Science Foundation’s National Ecological Observatory Network (NEON) flux tower (Figure 3), which is a wetter site. We use the flux data to determine photosynthesis rates to compare with our measurements of fluorescence to develop approaches for relating remotely sensed optical measurements to tundra ecosystem productivity.
The trip wasn’t all work, Petya Campbell and students were able to attend a Nalukataq, the Iñupiat whaling festival, and see the traditional blanket toss that throws the blanket dancer high into the air (Figure 9).
We will return in August at the time of peak growth of the tundra to collect further measurements of fluorescence and productivity to add to the seasonal descriptions of fluorescence from these automated sensors.
Alex Haughton is a graduate student in the Astrophysical and Planetary Sciences department at University of Colorado Boulder studying ultraviolet instrumentation with sounding rockets. His team has traveled to Equatorial Launch Australia’s Arnhem Space Center near Nhulunbuy, Australia to launch the Dual-channel Extreme Ultraviolet Continuum Experiment (DEUCE) Sounding Rocket and observe the stars Alpha Centauri A & B in extreme ultraviolet wavelengths.
It takes a village to send something to space.
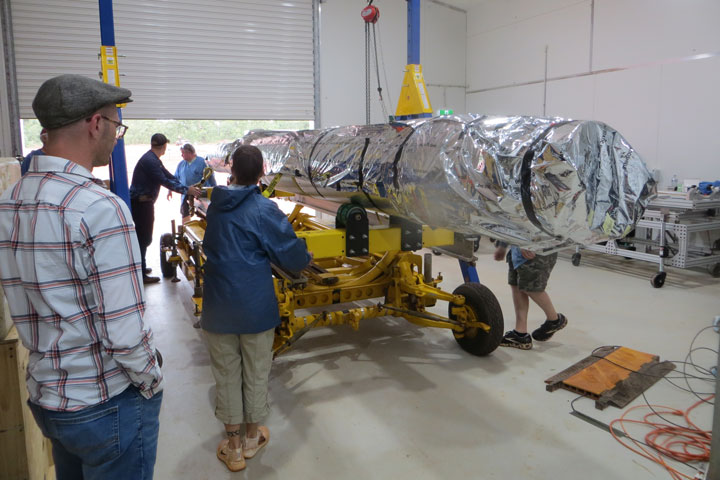
Currently, the Suborbital Imaging Spectrograph for Transition region Irradiance from Nearby Exoplanet host stars (SISTINE) rocket payload is sitting on the launch pad ready to go. As we wait for high winds to die down, I am reflecting on how many people it takes to get here.
SISTINE has a science team of four people in East Arnhem Land, but many others were left back at the lab in Colorado – mechanical and electrical engineers, technicians, graduate and undergraduate students. The payload itself consists of a telescope made by Nu-Tek in Maryland, special ultraviolet reflective coatings applied by NASA Goddard, a diffraction grating made by Horiba JY in France, and a microchannel plate detector made by Sensor Sciences in Berkely. If all those things sound like advanced technology that take a lot of people, work, and know how to make, it’s because they are.
And that’s just the science payload. There’s the minor matter of launching it into outer space. There are over 70 people here from NASROC (NASA Rockets), White Sands Missile Range, and NASA. These are people who can set up and operate the motors of a sounding rocket (the part that goes boom), people who can set up antennas to communicate with the rocket as it flies to and from space and monitor where it is, people who can point the rocket in the right direction when it gets there, people to pick up the rocket and bring it back when it comes back down, and people to manage all these other people. This blog post is facilitated by a NASA communications team sent to cover the launch (you can find some of their excellent work here).
Then there’s the local infrastructure. The launch site itself was built with a partnership between Equatorial Launch Australia and the Gumatj Corporation, the Indigenous owned and run corporation that manages the land on which the launch site was built. East Arnhem Land is beautiful, but densely populated it is not, and the influx of people requires places to stay, food to eat, vehicles to drive, and other resources that stretch the capabilities of the nearby town of Nhulunbuy (the area has responded admirably).
I feel like there’s a tendency to put a single face on scientific discovery or technical achievement. The Nobel Prizes certainly tend in this direction. Theoreticians of the past may have had fewer people supporting them, but modern scientific discoveries are built on the culmination of years, if not decades, of hard work by large teams of people, all of whom are critical to success.
Sometime in next few decades the astronomy community will begin detecting and analyzing atmospheric data from potentially habitable exoplanets. There’s a chance life signatures could be discovered. When this happens, the next two launches, along with a multitude of other projects, will have helped paved the way for that discovery. And these two launches, small potatoes compared to what it takes for even moderately sized space telescopes, take a village to succeed.
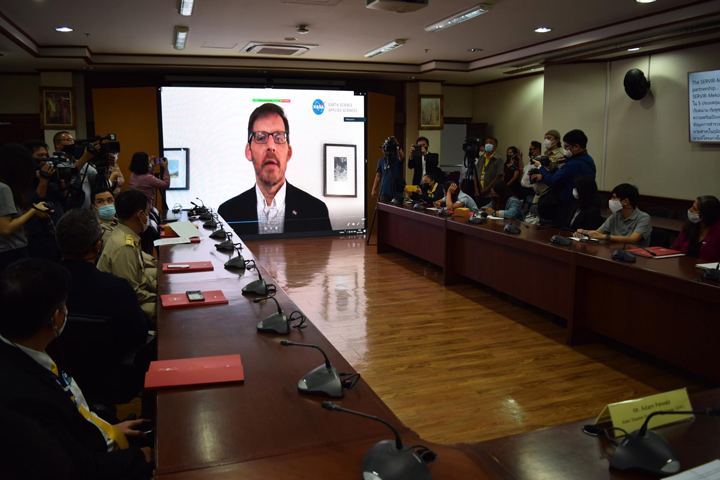
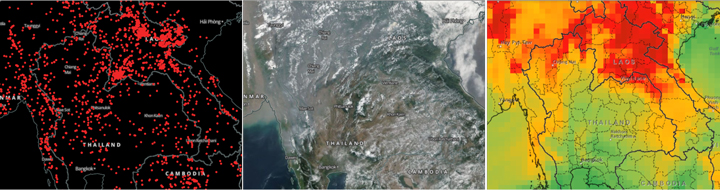
On November 23, the Royal Thai Government’s Pollution Control Department (PCD) and SERVIR-Mekong launched the Mekong Air Quality Explorer (AQE) tool at a press event in Bangkok, Thailand. Due to ongoing COVID restrictions, my colleagues from the SERVIR Science Coordination Office (SCO) and I participated in the event remotely. In working with the SERVIR-Mekong hub, I learned that poor air quality in Southeast Asia is a recurring problem that has lingered for over a decade. In contrast to smaller numbers of ground monitoring stations, Earth observations have proven essential to provide consistent and accurate air quality information. Co-developed by SERVIR-Mekong, PCD, and the Geo-Informatics and Space Technology Development Agency (GISTDA), the AQE uses Earth observation inputs in a web-based platform that forecasts and monitors air quality in the Lower Mekong region.
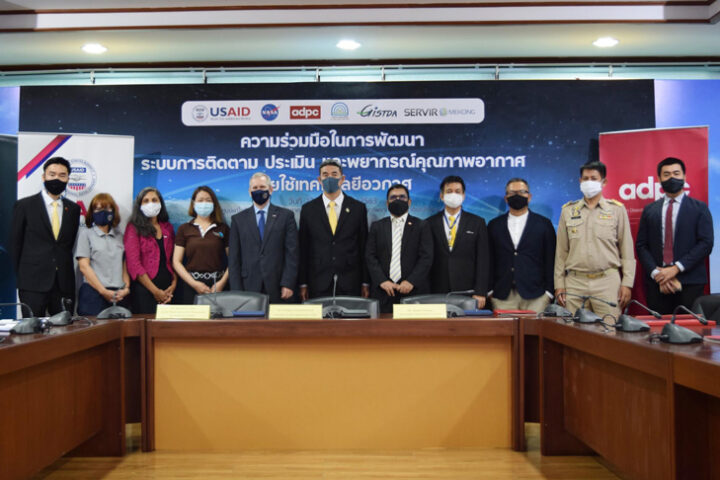
The press event took place at the Ministry of Natural Resources and Environment in Bangkok, and included remarks, a tool demo, and a Q&A session—and I got to watch it all live online. With about 40 participants, the event featured speakers such as: Mr. Athapol Charoenshunsa, PCD Director General and Chairman of the event; Dr. Steven G. Olive, Mission Director of USAID’s Regional Development Mission for Asia (RDMA); Dr. Lawrence Friedl, Director of NASA Earth Science Division’s Applied Science Program (through a pre-recorded video); and Mr. Aslam Perwaiz, Deputy Executive Director of the Asian Disaster Preparedness Center (ADPC). Additionally, GISTDA, the National Research Council of Thailand, the Prime Minister’s Delivery Unit, the Thai Health Promotion Foundation, the Department of Health, and about 20 local media channels and newspapers were at the event.
Collaboration with Local and Regional Partners
As some background, SERVIR, a joint NASA and USAID program, works with leading regional organizations to help countries worldwide use Earth observations and geospatial technologies to address environmental challenges. Led by the ADPC, SERVIR-Mekong works with organizations in countries across the Lower Mekong, including Thailand. I wasn’t working with the Mekong hub at the time, but in April of 2019, SERVIR-Mekong initiated a collaboration with local authorities to improve air quality monitoring and forecasting. The release event builds on nearly two years of research, trainings, and collaborative development in the area of air quality monitoring and forecasting. As Aekkapol Aekakkararungroj, a Remote Sensing and GIS Specialist from ADPC and my co-worker, stated: “Tackling air pollution needs to be done right now. This requires cooperation from grassroots to policy makers. Earth observation technology from space is one of the most important tools to bridge the gap—to help them better communicate, and collaboratively manage the situation on the ground.”
Research and Development for Air Quality Monitoring and Forecasting
I learned a lot about Air Quality monitoring from Dr. Gupta, the lead scientist of the AQE. He told me that in the past two decades, satellite observations of atmospheric aerosols and trace gases have been used to address surface air pollution issues. NASA has invested significant resources in researching and developing data products ready to be used in applications. The products used for the AQE are created through a research and analysis (R&A) project of NASA’s Science of Terra, Aqua and Suomi-NPP program (PI – Dr. Pawan Gupta). The R&A project focuses on air quality research and data product development for the Indian-Subcontinent, which has been expanded to include Thailand in collaboration with SERVIR. “AQE is an excellent example where NASA’s R&A program collaborated with NASA’s Applied Science program to use science for real-life application,” said Dr. Gupta.
The AQE uses aerosol and meteorological forecasts from NASA’s existing advanced climate model called the Goddard Earth Observing System (GEOS). GEOS assimilates millions of daily Earth observations and provides global forecasts up to 10 days in advance under its forward processing (FP) stream. Forecasts using the GEOS system are experimental and are produced for research purposes only. Therefore, the AQE uses NASA’s global aerosol forecasts informed by satellite observations, real-time ground monitoring data from the PCD, and an advanced machine learning algorithm to provide three hourly air quality forecasts for the next three days. The machine learning algorithm helps calibrate global forecasts with local conditions and provide better accuracy. This all sounds super cool, right?
In addition, AQE has real-time satellite imagery, fire detection, and aerosol retrievals from NASA’s MODIS and VIIRS sensors. These near real-time products can help human forecasters evaluate model forecasted fields for improved decision making on final forecast outputs. AQE also has gridded historical (past two decades) data on aerosols and fires developed under the R&A project (Gupta et al., 2020). The historical datasets can evaluate change over time and help understand the impact of any significant policy changes on emissions in the region.
Capacity Building Through Training at Partner Institutions
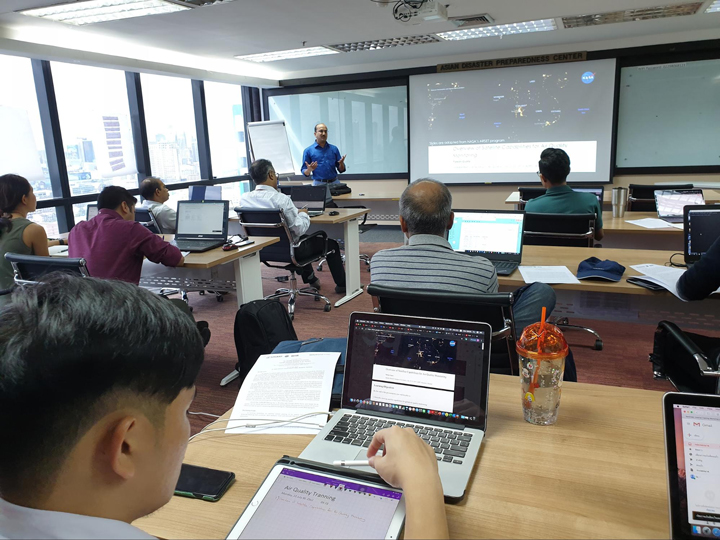
In addition to app development, the SERVIR-Mekong team has supported training and youth outreach efforts. Dr. Gupta conducted two training sessions on the Remote Sensing of Air Quality: the first for the ADPC in July 2019, and the second in August 2020 for the PCD and GISTDA, in which I had the chance to participate. The latter was supported by NASA Applied Remote Sensing Training and the Committee of Earth Observation Satellites. These trainings built technical capabilities within Thai institutions on satellite remote sensing basics, the use of satellite data for air quality applications, and advantages and limitations of satellite datasets. These trainings were also used to introduce and get feedback on AQE while still under development.
To increase youth engagement in the work, in February of 2020, SERVIR-Mekong, PCD, USAID, and the Department of State’s Young Southeast Asian Leaders Initiative hosted Smogathon Thailand 2020. The event brought together young professionals, students, and technical experts to tackle air pollution using satellite data.
Development of an Online Visualization System – An Air Quality Explorer
The AQE started as a simple visualization tool for historical aerosols and fire data to support a R&A project. Around the same time, SERVIR-Mekong showed an interest in air quality applications in the Lower Mekong region, which motivated the SERVIR team to further develop this visualization tool and include other data sets. The collaboration with PCD allowed us to use their ground monitoring data, which then combined with GEOS reanalysis (MERRA2) to develop machine learning (ML) models. These ML models were evaluated against independent datasets using a 10-fold validation strategy. Finally, an ensemble model is used to calculate surface PM2.5 for the entire region. These ML models were implemented in automatic data processing, which generate three hourly air quality index maps for the next three days following Thai air quality standards. In addition to historical data and forecasting, near real-time satellite data layers from NASA’s Land, Atmosphere Near real-time Capabilities for EO (LANCE) were incorporated in the tool. The AQE had been through testing and improvement for almost a year with all the partners, including PCD, GISTDA, and SERVIR-Mekong, before it was adopted by PCD and became part of the Thai air quality management system.

Future Work
The adoption of AQE by the PCD is an excellent example of how NASA’s science, research, and data are being applied around the world to address real-life problems. The AQE is also a first step by PCD in adopting Earth observations to complement and fill gaps in ground-based air quality monitoring systems. The AQE also addresses air quality forecasting, a gap in their air quality management program.
Since the adoption and release, PCD has already made several improvement requests for the AQE tool to serve their air quality needs. This includes improved spatial resolution, expanding the regional coverage to include neighboring countries to understand transboundary pollution, and including data on more air pollutants such as ozone, SO2, and NO2. There is also an opportunity to explore air quality observations by geostationary satellites by JAXA (i.e., Himawari-8/9) and KARI (i.e., GEMS) for the region. SERVIR-Mekong and SCO will continue to work on these aspects in close collaboration with PCD and GISTDA. I’m really excited to contribute to this effort and see the direction the AQE will take in the future!
