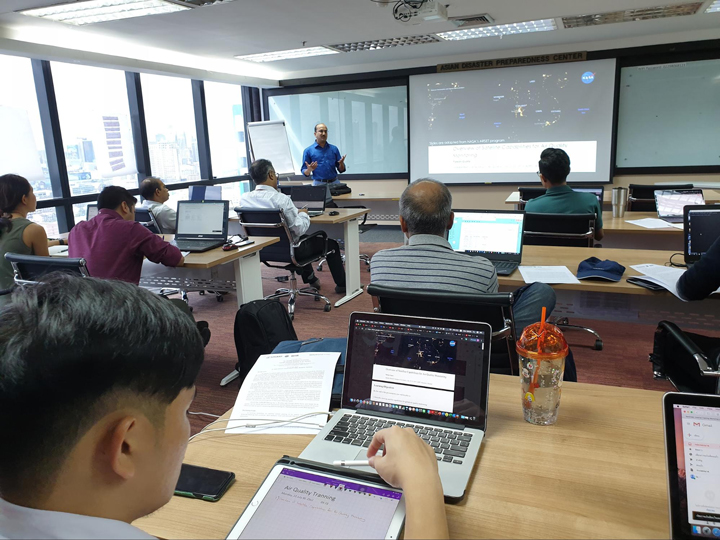
On November 23, the Royal Thai Government’s Pollution Control Department (PCD) and SERVIR-Mekong launched the Mekong Air Quality Explorer (AQE) tool at a press event in Bangkok, Thailand. Due to ongoing COVID restrictions, my colleagues from the SERVIR Science Coordination Office (SCO) and I participated in the event remotely. In working with the SERVIR-Mekong hub, I learned that poor air quality in Southeast Asia is a recurring problem that has lingered for over a decade. In contrast to smaller numbers of ground monitoring stations, Earth observations have proven essential to provide consistent and accurate air quality information. Co-developed by SERVIR-Mekong, PCD, and the Geo-Informatics and Space Technology Development Agency (GISTDA), the AQE uses Earth observation inputs in a web-based platform that forecasts and monitors air quality in the Lower Mekong region.
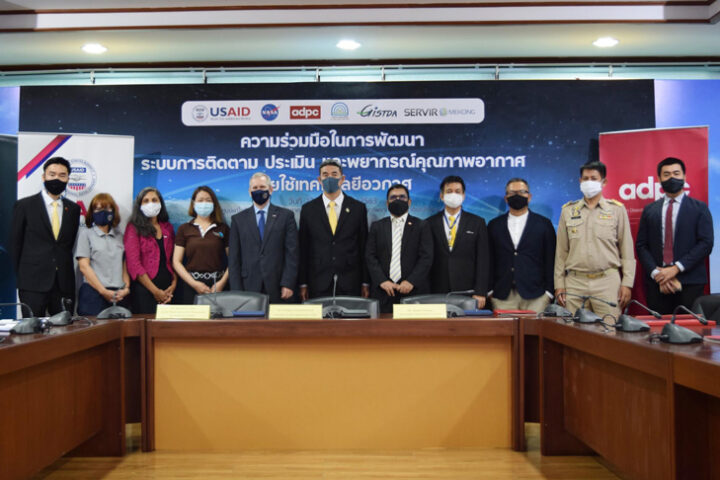
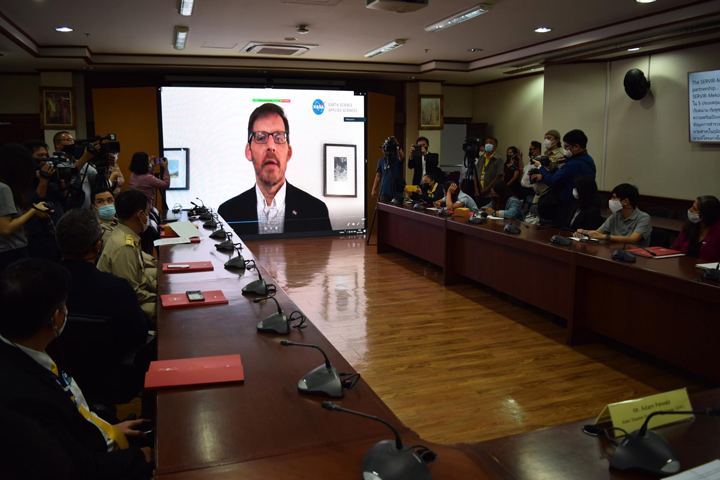
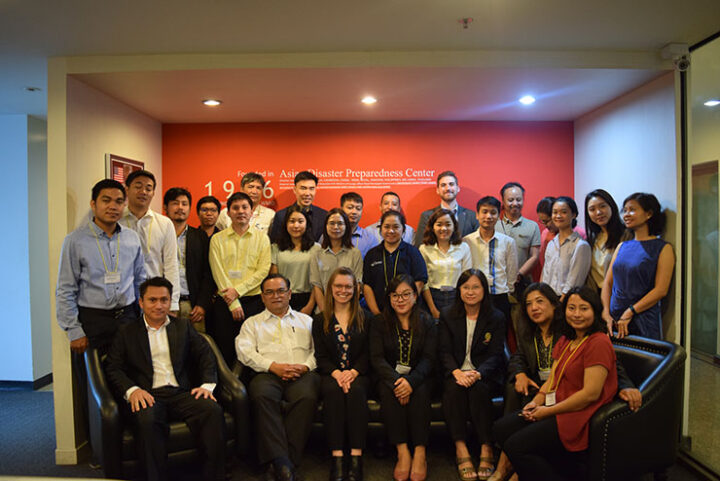
The press event took place at the Ministry of Natural Resources and Environment in Bangkok, and included remarks, a tool demo, and a Q&A session—and I got to watch it all live online. With about 40 participants, the event featured speakers such as: Mr. Athapol Charoenshunsa, PCD Director General and Chairman of the event; Dr. Steven G. Olive, Mission Director of USAID’s Regional Development Mission for Asia (RDMA); Dr. Lawrence Friedl, Director of NASA Earth Science Division’s Applied Science Program (through a pre-recorded video); and Mr. Aslam Perwaiz, Deputy Executive Director of the Asian Disaster Preparedness Center (ADPC). Additionally, GISTDA, the National Research Council of Thailand, the Prime Minister’s Delivery Unit, the Thai Health Promotion Foundation, the Department of Health, and about 20 local media channels and newspapers were at the event.
Collaboration with Local and Regional Partners
As some background, SERVIR, a joint NASA and USAID program, works with leading regional organizations to help countries worldwide use Earth observations and geospatial technologies to address environmental challenges. Led by the ADPC, SERVIR-Mekong works with organizations in countries across the Lower Mekong, including Thailand. I wasn’t working with the Mekong hub at the time, but in April of 2019, SERVIR-Mekong initiated a collaboration with local authorities to improve air quality monitoring and forecasting. The release event builds on nearly two years of research, trainings, and collaborative development in the area of air quality monitoring and forecasting. As Aekkapol Aekakkararungroj, a Remote Sensing and GIS Specialist from ADPC and my co-worker, stated: “Tackling air pollution needs to be done right now. This requires cooperation from grassroots to policy makers. Earth observation technology from space is one of the most important tools to bridge the gap—to help them better communicate, and collaboratively manage the situation on the ground.”
Research and Development for Air Quality Monitoring and Forecasting
I learned a lot about Air Quality monitoring from Dr. Gupta, the lead scientist of the AQE. He told me that in the past two decades, satellite observations of atmospheric aerosols and trace gases have been used to address surface air pollution issues. NASA has invested significant resources in researching and developing data products ready to be used in applications. The products used for the AQE are created through a research and analysis (R&A) project of NASA’s Science of Terra, Aqua and Suomi-NPP program (PI – Dr. Pawan Gupta). The R&A project focuses on air quality research and data product development for the Indian-Subcontinent, which has been expanded to include Thailand in collaboration with SERVIR. “AQE is an excellent example where NASA’s R&A program collaborated with NASA’s Applied Science program to use science for real-life application,” said Dr. Gupta.
The AQE uses aerosol and meteorological forecasts from NASA’s existing advanced climate model called the Goddard Earth Observing System (GEOS). GEOS assimilates millions of daily Earth observations and provides global forecasts up to 10 days in advance under its forward processing (FP) stream. Forecasts using the GEOS system are experimental and are produced for research purposes only. Therefore, the AQE uses NASA’s global aerosol forecasts informed by satellite observations, real-time ground monitoring data from the PCD, and an advanced machine learning algorithm to provide three hourly air quality forecasts for the next three days. The machine learning algorithm helps calibrate global forecasts with local conditions and provide better accuracy. This all sounds super cool, right?
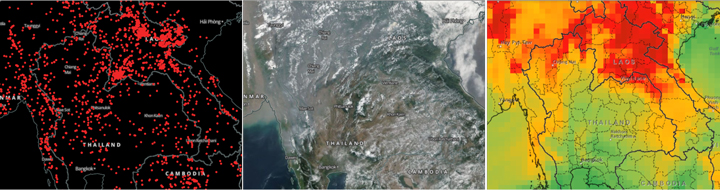
In addition, AQE has real-time satellite imagery, fire detection, and aerosol retrievals from NASA’s MODIS and VIIRS sensors. These near real-time products can help human forecasters evaluate model forecasted fields for improved decision making on final forecast outputs. AQE also has gridded historical (past two decades) data on aerosols and fires developed under the R&A project (Gupta et al., 2020). The historical datasets can evaluate change over time and help understand the impact of any significant policy changes on emissions in the region.
Capacity Building Through Training at Partner Institutions
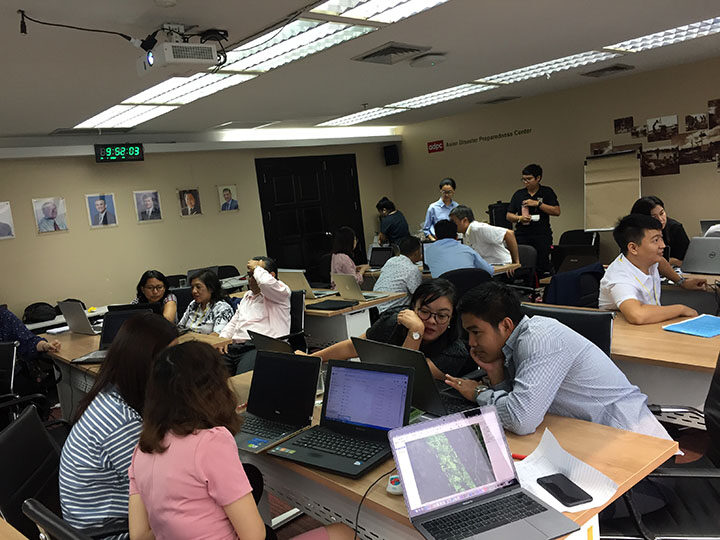
In addition to app development, the SERVIR-Mekong team has supported training and youth outreach efforts. Dr. Gupta conducted two training sessions on the Remote Sensing of Air Quality: the first for the ADPC in July 2019, and the second in August 2020 for the PCD and GISTDA, in which I had the chance to participate. The latter was supported by NASA Applied Remote Sensing Training and the Committee of Earth Observation Satellites. These trainings built technical capabilities within Thai institutions on satellite remote sensing basics, the use of satellite data for air quality applications, and advantages and limitations of satellite datasets. These trainings were also used to introduce and get feedback on AQE while still under development.
To increase youth engagement in the work, in February of 2020, SERVIR-Mekong, PCD, USAID, and the Department of State’s Young Southeast Asian Leaders Initiative hosted Smogathon Thailand 2020. The event brought together young professionals, students, and technical experts to tackle air pollution using satellite data.
Development of an Online Visualization System – An Air Quality Explorer
The AQE started as a simple visualization tool for historical aerosols and fire data to support a R&A project. Around the same time, SERVIR-Mekong showed an interest in air quality applications in the Lower Mekong region, which motivated the SERVIR team to further develop this visualization tool and include other data sets. The collaboration with PCD allowed us to use their ground monitoring data, which then combined with GEOS reanalysis (MERRA2) to develop machine learning (ML) models. These ML models were evaluated against independent datasets using a 10-fold validation strategy. Finally, an ensemble model is used to calculate surface PM2.5 for the entire region. These ML models were implemented in automatic data processing, which generate three hourly air quality index maps for the next three days following Thai air quality standards. In addition to historical data and forecasting, near real-time satellite data layers from NASA’s Land, Atmosphere Near real-time Capabilities for EO (LANCE) were incorporated in the tool. The AQE had been through testing and improvement for almost a year with all the partners, including PCD, GISTDA, and SERVIR-Mekong, before it was adopted by PCD and became part of the Thai air quality management system.

Future Work
The adoption of AQE by the PCD is an excellent example of how NASA’s science, research, and data are being applied around the world to address real-life problems. The AQE is also a first step by PCD in adopting Earth observations to complement and fill gaps in ground-based air quality monitoring systems. The AQE also addresses air quality forecasting, a gap in their air quality management program.
Since the adoption and release, PCD has already made several improvement requests for the AQE tool to serve their air quality needs. This includes improved spatial resolution, expanding the regional coverage to include neighboring countries to understand transboundary pollution, and including data on more air pollutants such as ozone, SO2, and NO2. There is also an opportunity to explore air quality observations by geostationary satellites by JAXA (i.e., Himawari-8/9) and KARI (i.e., GEMS) for the region. SERVIR-Mekong and SCO will continue to work on these aspects in close collaboration with PCD and GISTDA. I’m really excited to contribute to this effort and see the direction the AQE will take in the future!
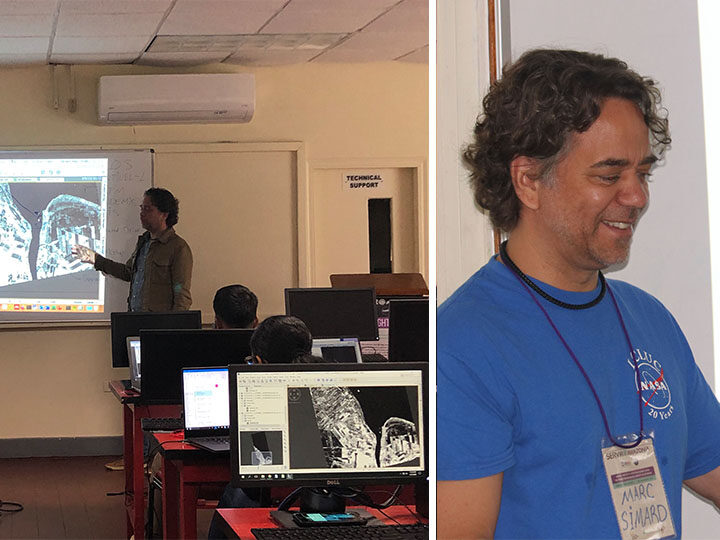
Mangrove forests are some of the most productive ecosystems in the world, sustaining the livelihoods of millions of coastal dwellers. These unique forests sequester carbon, protect coastlines and infrastructure against storm surges, promote fisheries, and are sources of lumber and charcoal. Last week I supported a workshop at the University of Guyana on using Synthetic Aperture Radar (SAR) to monitor these unique ecosystems with my colleague Glenn Hyman from SERVIR-Amazonia and Marc Simard from NASA-JPL (Check out Chapter 6 of the SAR Handbook for the training/tutorials).
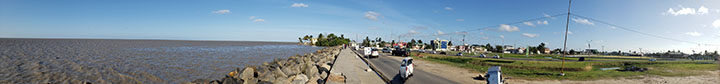
When I arrived in Georgetown, the capital of Guyana, I was impressed to learn Guyana’s coast is as much as 2 meters below mean high tide! The country already foresees problems of (intensive flooding and saltwater intrusion) in its lowlands related to sea level rise from climate change.
That is why Guyana’s government agencies, NGOs and SERVIR-Amazonia are working to support the generation of an operational monitoring system for mangrove forests. Mangroves can serve as a natural sea wall by building up soils and sediments, protecting the coast.
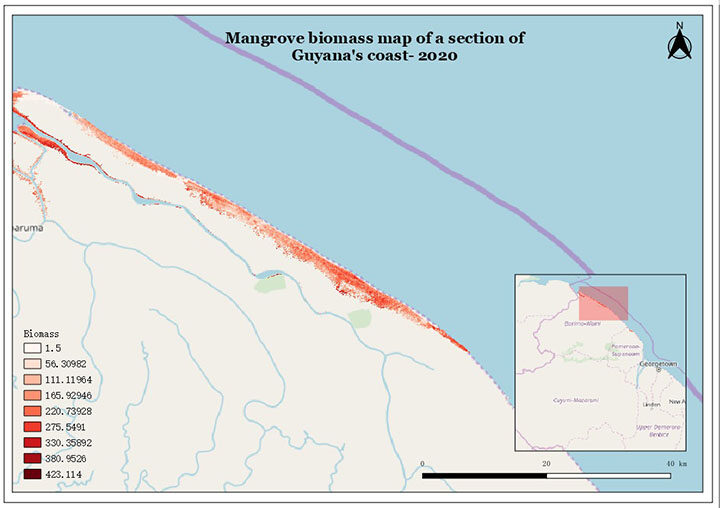
This first workshop exposed participants to available satellite imagery, including the Japan Aerospace Exploration Agency’s (JAXA) ALOS PALSAR data, ALOS PALSAR 2 mosaics, and the European Space Agency’s (ESA) Sentinel-1 data; as well as how to use the Alaska Satellite Facility’s (ASF) Vertex to access these datasets. Participants also learned how to pre-process radar data using ESA’s SNAP platform, and how open-source QGIS software and digital elevation models (SRTM and TanDEM-X) can be used to estimate height and biomass of mangrove forests. Trust me, the look on the participants’ faces after they finalized their first biomass maps was exhilarating. The knowledge gained in this training will enable the use of the most up-to-date information on the state of mangroves along the entire coast in Guyana’s national forest.
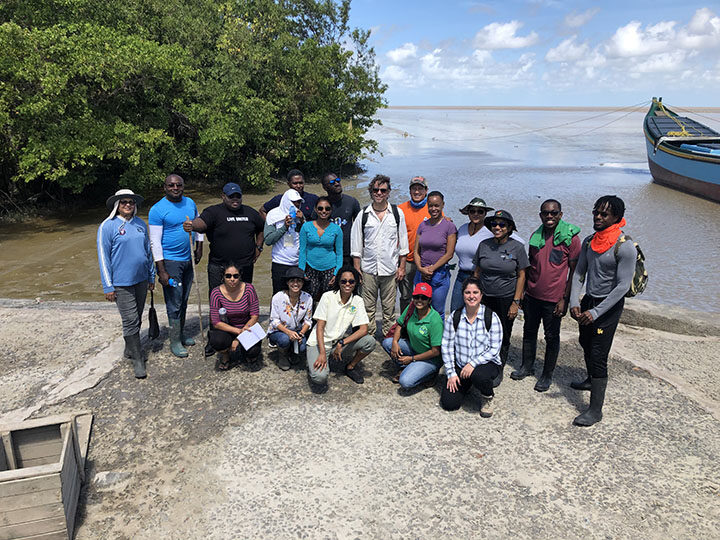
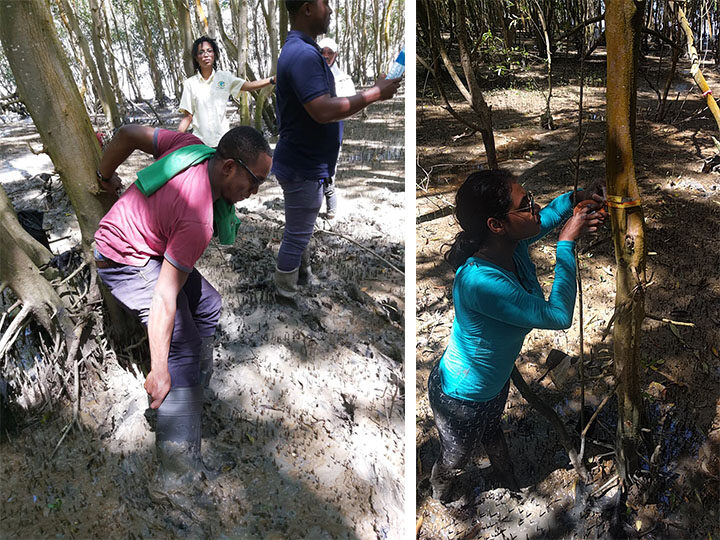
From my perspective, the best part of the workshop was going out into the field. On the last day, we visited a nearby mangrove restoration site and moving through the forest was no easy task! At the end of the visit, we were lucky to still have our boots on from our struggle to walk in the deep, sticky mud. The participants were instructed to measure tree height, diameter at breast height (DBH) and establish forest plots using clinometers (a fancy word for an instrument that measures elevation, slope, and depression of an object), laser range finders for measuring the distance to an object, and measuring tapes for recording tree diameter. With this information (known to scientists as validation data) we are able to calibrate the equations we use to model mangrove forests with remote sensing.
I am really looking forward to our continued work with this enthusiastic group of people and to be back in Georgetown for a follow up training in May of this year. We are planning to do a “hackathon” as the second phase to develop the mangrove monitoring system.
My colleague, Tim Mayer, and I just made it home from leading a three-day workshop focused on estimating forest stand height using L-band Synthetic Aperture Radar (SAR) data. Hosted by the SERVIR-Mekong hub at the Asian Disaster Preparedness Center (ADPC), this activity is part of the SERVIR and SilvaCarbon forest monitoring SAR Handbook initiative, which provides researchers with tools to use SAR for forest monitoring and biomass estimation.
Generally, remote sensing researchers interested in tropical regions have a difficult time finding satellite imagery with little to no clouds. L-band SAR, with a wavelength of about ~25 cm, penetrates through clouds, providing a unique opportunity to see through forest canopies and enabling measurements of the limbs and trunks of trees from space. Forest height and density reflect the forest age and health. In addition, forest height can be used to estimate Above Ground Biomass (AGB), and the amount of carbon sequestered by vegetation. This is important to organizations like the United Nations REDD+ Programme, which works with partner countries to reduce greenhouse gas emissions from deforestation and degradation. In South and Southeast Asia, the SERVIR-Mekong and SERVIR-Hindu Kush Himalaya hubs support these partners in deriving estimates for forest monitoring and evaluation purposes.
Over 20 representatives from six countries (Thailand, Nepal, Myanmar, Vietnam, Cambodia and Laos) participated in the workshop. The attendees had a range of expertise, with backgrounds in engineering, geography, computer science, remote sensing, forestry and Geographic Information Systems (GIS). Most of the attendees support forest monitoring and reporting activities as part of their work. Participants left with the tools needed to explore how this technique can be integrated into their work with land classification, carbon pool estimation, and forest monitoring.
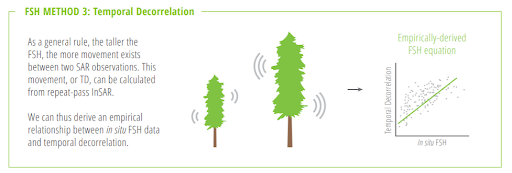
We focused on the temporal decorrelation method of estimating forest stand height (FSH) as described in the SAR Handbook chapter four by Paul Siqueira. Siqueira, Yang Lei, and other authors published a novel approach to estimate FSH above 10m in 2019. The temporal decorrelation method relies on the assumption that if a sensor captures two snapshots of the same area of forest at different times, the sensor will measure a change between the two scenes. On average, the taller the trees the more change the sensor will detect. The algorithm takes the relationship between known tree heights and the amount of change detected by the sensor, and applies that relationship to areas where no known tree height measurements exist in order to estimate forest stand height.
Participants left with a concrete understanding of how to apply these techniques to their own countries for MRV (Monitoring Reporting and Verification) and land classifications. One participant commented, “This training revolutionize[d] my concept of boring and complex coding to fun and powerful way[s] of analyzing Earth Observation data in an understandable way.” I look forward to working on improvements to the forest stand height estimation algorithm with the SERVIR network and building upon the relationships established during the workshop to estimate forest stand height in their respective countries. After the launch of NASA-ISRO Synthetic Aperture Radar (NISAR) mission in 2021, we will be able to adapt our methods to include NISAR’s current and more frequent global L-band SAR dataset.
Karibu! Welcome! I just returned from a training in Dar es Salaam, Tanzania, after an incredible week focused on using satellite data to better understand complex watershed dynamics and manage water resources. Referred to as Dar by locals, Tanzania’s largest city sits on the tropical east coast of Africa and is full of salty sea smells and friendly people. Our SERVIR colleagues from the Regional Centre for Mapping of Resources for Development (RCMRD) and I spent a full 5 days with Tanzanian water resources managers from the Rufiji Basin, Wami-Ruvu Basin, and other offices focused on…you guessed it…water.
Flowing from the Eastern Arc Mountains, the Rufiji river basin is one of the largest in East Africa and where most of Tanzania’s agriculture grows. The Wami-Ruvu basin is where Tanzania’s largest urban centers (including Dar) and industrial complexes are concentrated, but you will also find agricultural fields. Both basins are vulnerable to environmental factors that affect water quantity and quality. Examples include increased water demand from population growth, pollution from industrial and agricultural runoff, and uncertainty in rainfall patterns as our climate changes. With NASA’s freely-available satellite data, hydrologists can measure streamflow at a given place and time, and estimate discharge using different hydrologic models.
These predictions support sustainable water management, as other factors change in and around the basin. In Tanzania, the long rains are from March to June while the short rains are from October to December. As our climate changes, Tanzania experiences high and low extremes with intense drought or floods with the changing of seasons. These anomalies threaten agricultural production and livelihoods in the region as populations grow, pollution increases, and natural disasters are more devastating. Monitoring and modeling water resources can help to plan ahead and respond more efficiently.
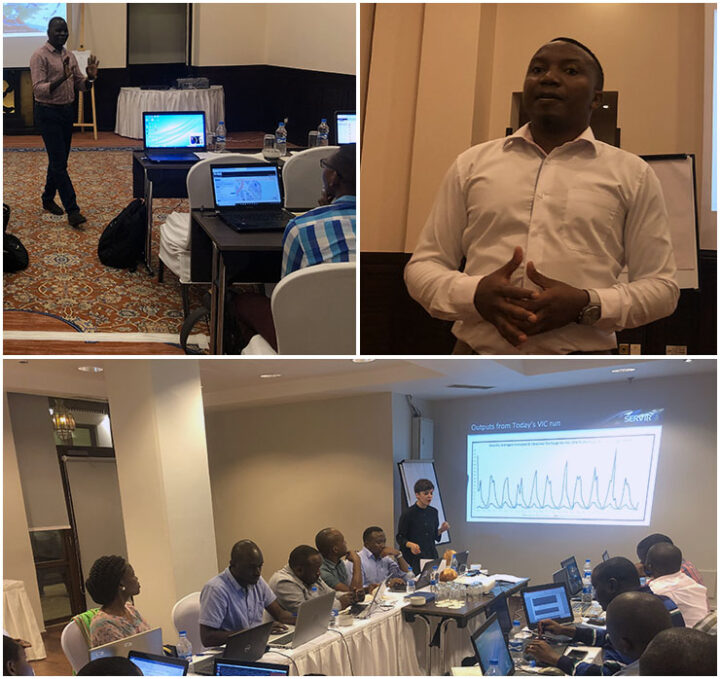
One of the goals of the SERVIR program is to build capacity to use satellite data in the regions we work in by training the trainers with tools, products, and services that aid in environmental management. For this training, we used a common hydrological model– the Variable Infiltration Capacity (VIC) model– to estimate streamflow. Over five days, the intensive training covered the entire modeling process for VIC– from data access and preparation to model run, calibration, and interpretation.
As a result of this workshop, stakeholders are equipped to return to their offices and replicate the process for different sub-basins. Estimating discharge over time with satellite data will save resources and allow hydrologists in the region to better understand long-term basin characteristics for improved management practices.
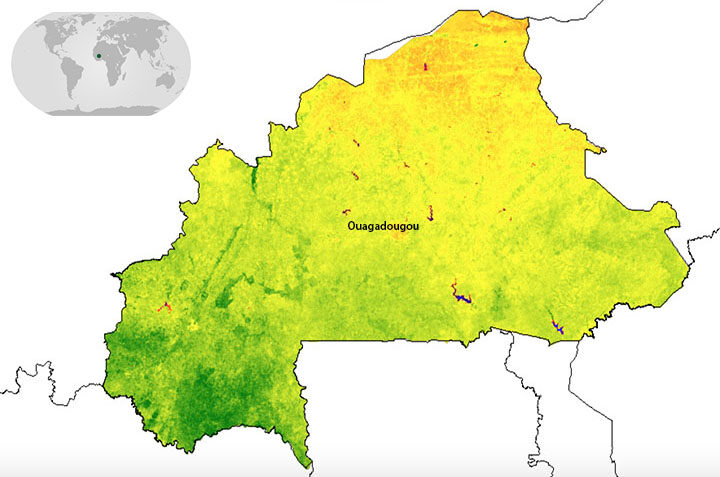
When I said I was going to Ouagadougou (Wa-ga-du-gu), the first question was “where, again?” So let’s start with the basics. Ouagadougou is the capital of Burkina Faso–a land-locked country in West Africa–located to the south of Mali, southwest of Niger, and north of Ghana and Togo. It is home to over 80 ethnic groups as well as Africa’s largest craft market. Burkina Faso also happens to be one of four pilot countries of the SERVIR-West Africa program, which launched in July 2016. The country’s forests are quickly degrading and shrinking; therefore, the first SERVIR service in Burkina Faso focuses on resource management, land use, and restoration.
The week-long workshop brought together members from communes, or sub-provinces, across Burkina Faso with representatives from SERVIR-West Africa, the West Africa Biodiversity and Climate Change (WABiCC) program, NASA, and the US Agency for International Development (USAID). Together, we discussed environmental problems impacting the local communities–from degraded forests due to agricultural expansion, to the build-up of garbage around communities. Through the work of SERVIR-West Africa, one idea is to use satellite datasets (e.g. from Landsat) for land use planning and monitoring environmental degradation.
One major limitation many communes throughout Burkina Faso encounter with any activity is safety. The primary concern of safety is related to terrorism, which spiked in December of 2018. This can be a major hurdle when trying to map the landscape like we want to do with this service, because there is no easy way for someone to physically go to different areas to validate land cover and land use maps. Therefore, one innovative approach SERVIR-West Africa and the Higher Institute for Space Studies and Telecommunications (ISESTEL) is using small Unmanned Aerial Vehicles (sUAVs) with cameras attached. I had the opportunity to actually see this technology in action, and the sUAVs drew quite the crowd. The goal is to use this drone imagery to validate the larger-scale NASA satellite data to map communes and monitor changes over time.

The second week of the trip to Burkina Faso included stakeholders from across Niger and Burkina Faso brought together to discuss a wide range of water-related issues. We focused on flooding, groundwater, and surface water monitoring. Each of the partners in attendance were able to discuss what they are currently involved in around these various topics and where they may be able to work together.
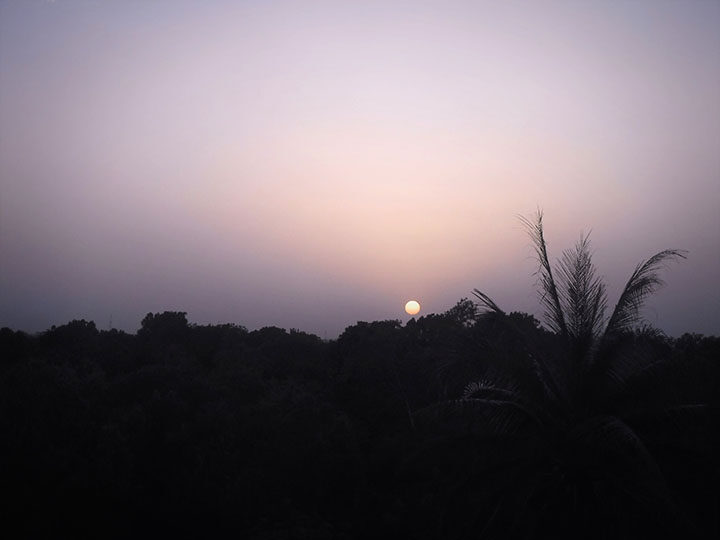
After two productive weeks in Ouagadougou, it was time for the sun to set on the trip and for me to head back to the United States. From what I saw of Burkina Faso, it is a beautiful country with plenty of greenery and different flora, delicious food, and lots to see. I look forward to being a part of the innovative work being done with our institutional partners–from the fusion of sUAVs with satellite data to finding new ways to do field work.