In 2022, severe lightning ignited many fires in Alaska. Notably, several exceptionally large fires burned in the tundra of Southwest Alaska, an ecosystem that is traditionally less prone to fire. While our understanding of the carbon emissions of boreal forest fires in Alaska and Canada has strongly advanced in recent years thanks to the work of several teams within NASA’s Arctic-boreal Vulnerability Experiment (ABoVE), the impacts of these tundra fires on the ecosystem’s carbon balance and permafrost has remained less well known.
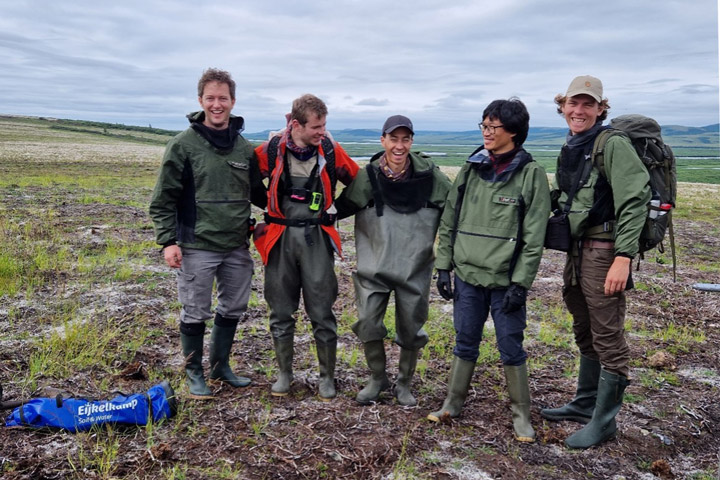
Our Climate and Ecosystems Change research group from the Vrije Universiteit Amsterdam in the Netherlands is currently in Southwest Alaska to fill these critical knowledge gaps. Our team received tremendous help of Dr. Lisa Saperstein from the Alaska Fish and Wildlife Service in organizing the campaign. Lisa will also start a field campaign in the same fires in the next few days and we plan to pool our datasets to maximize synergies between our efforts.
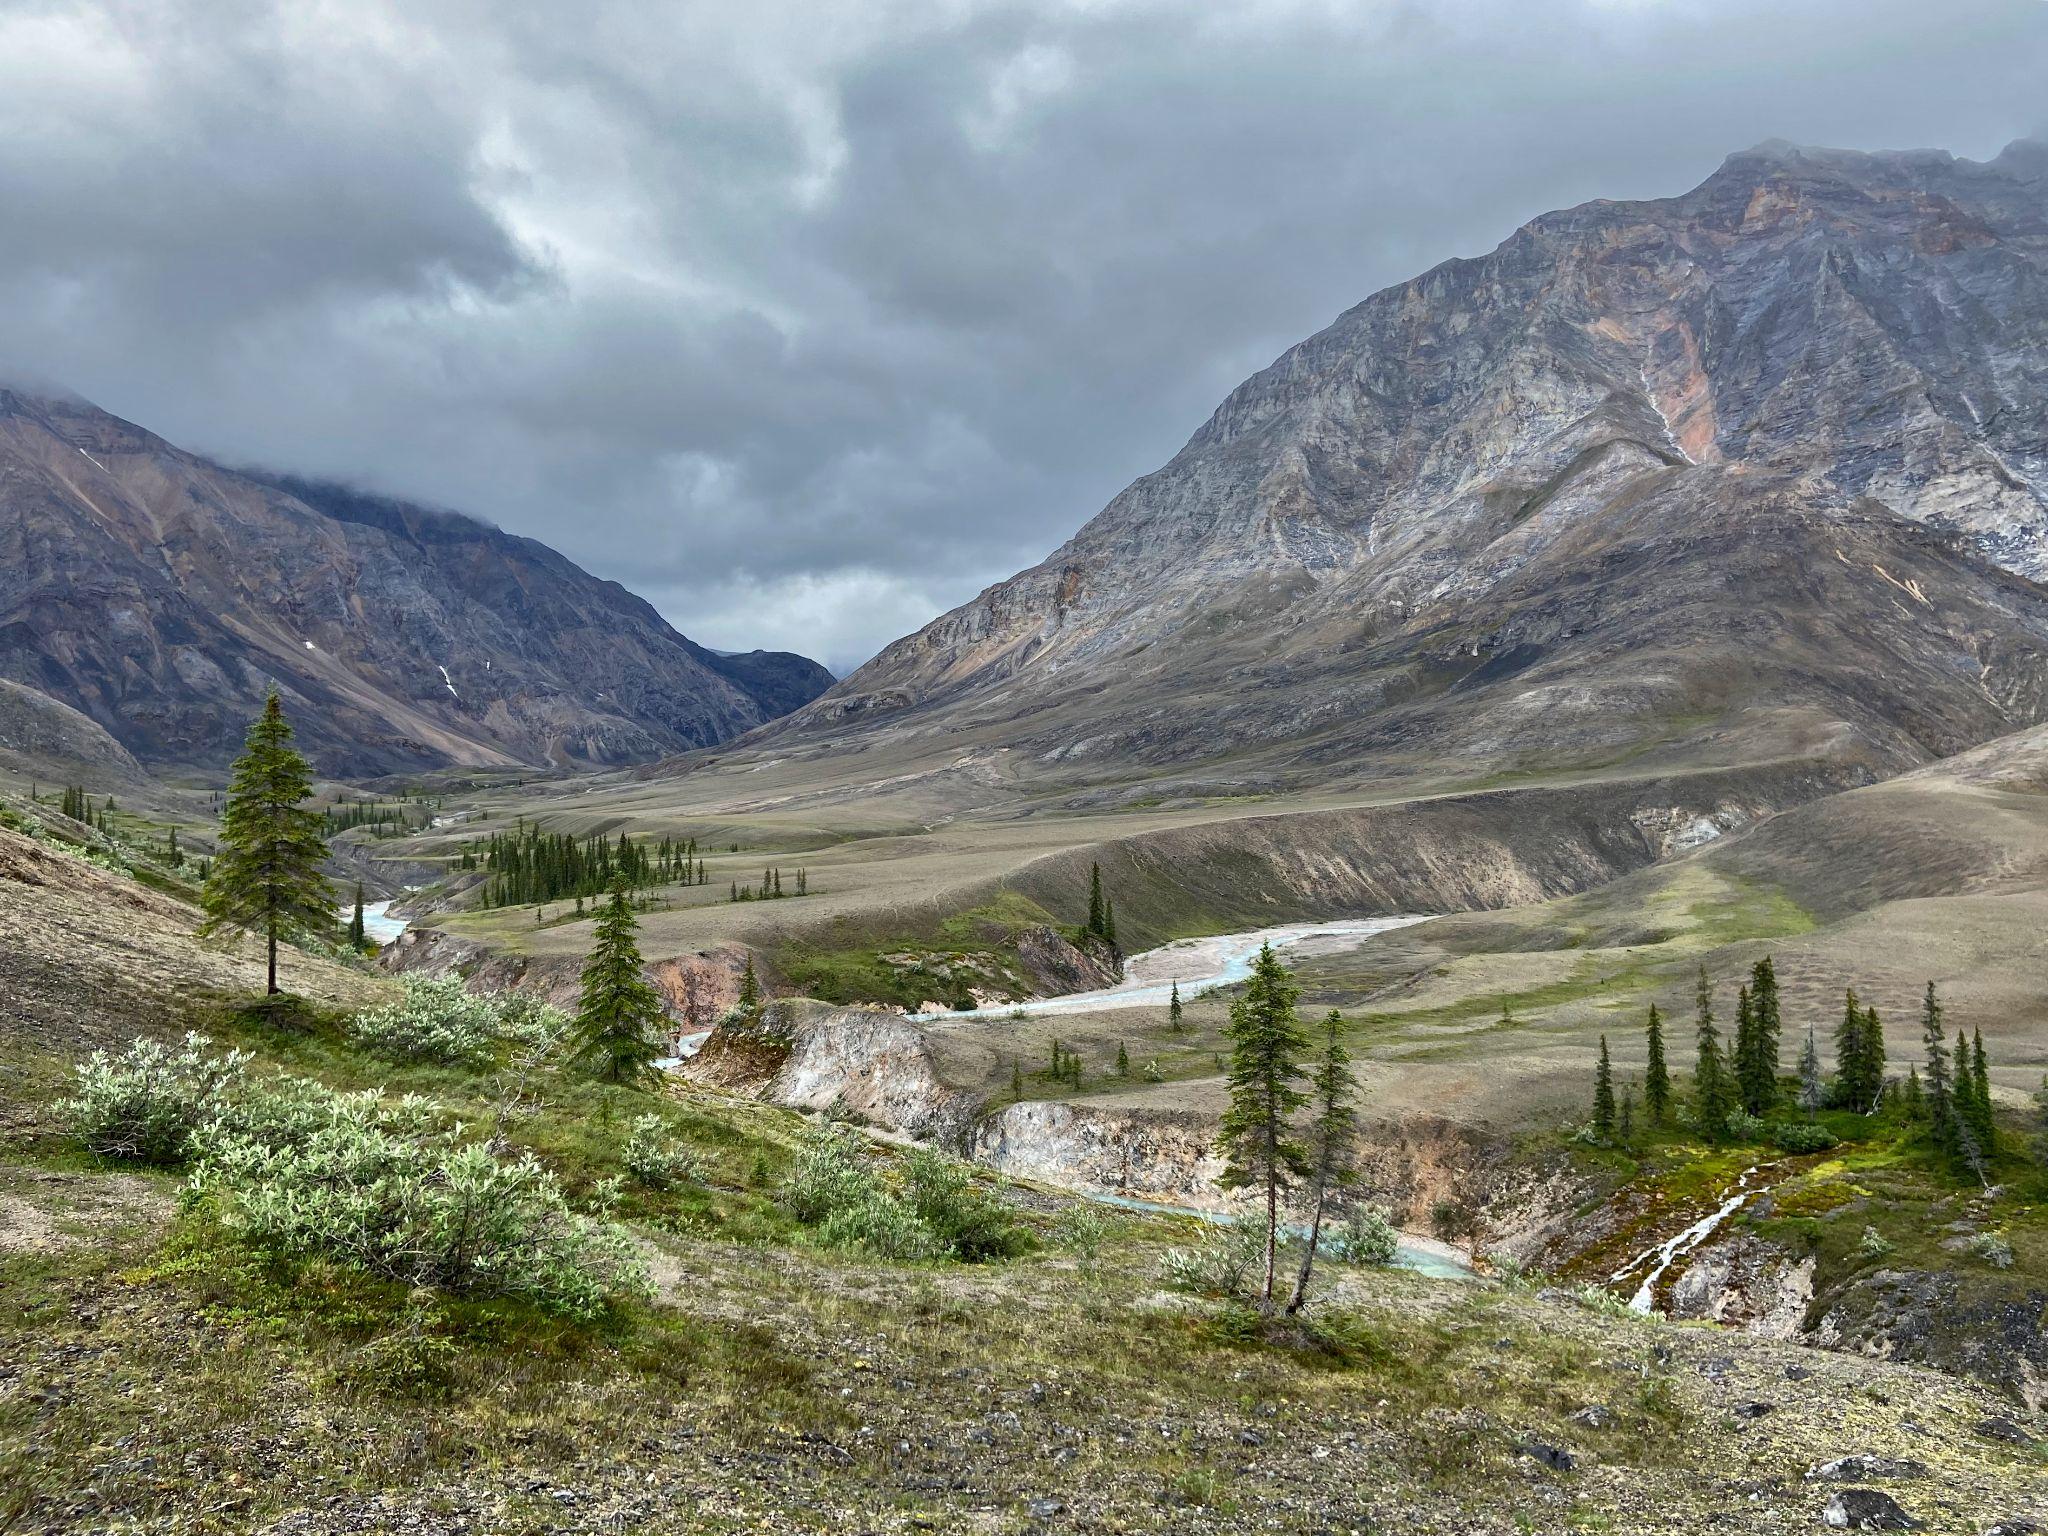
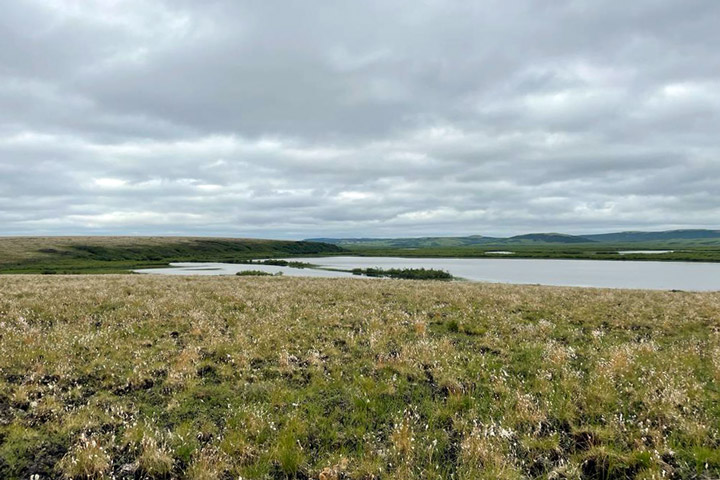
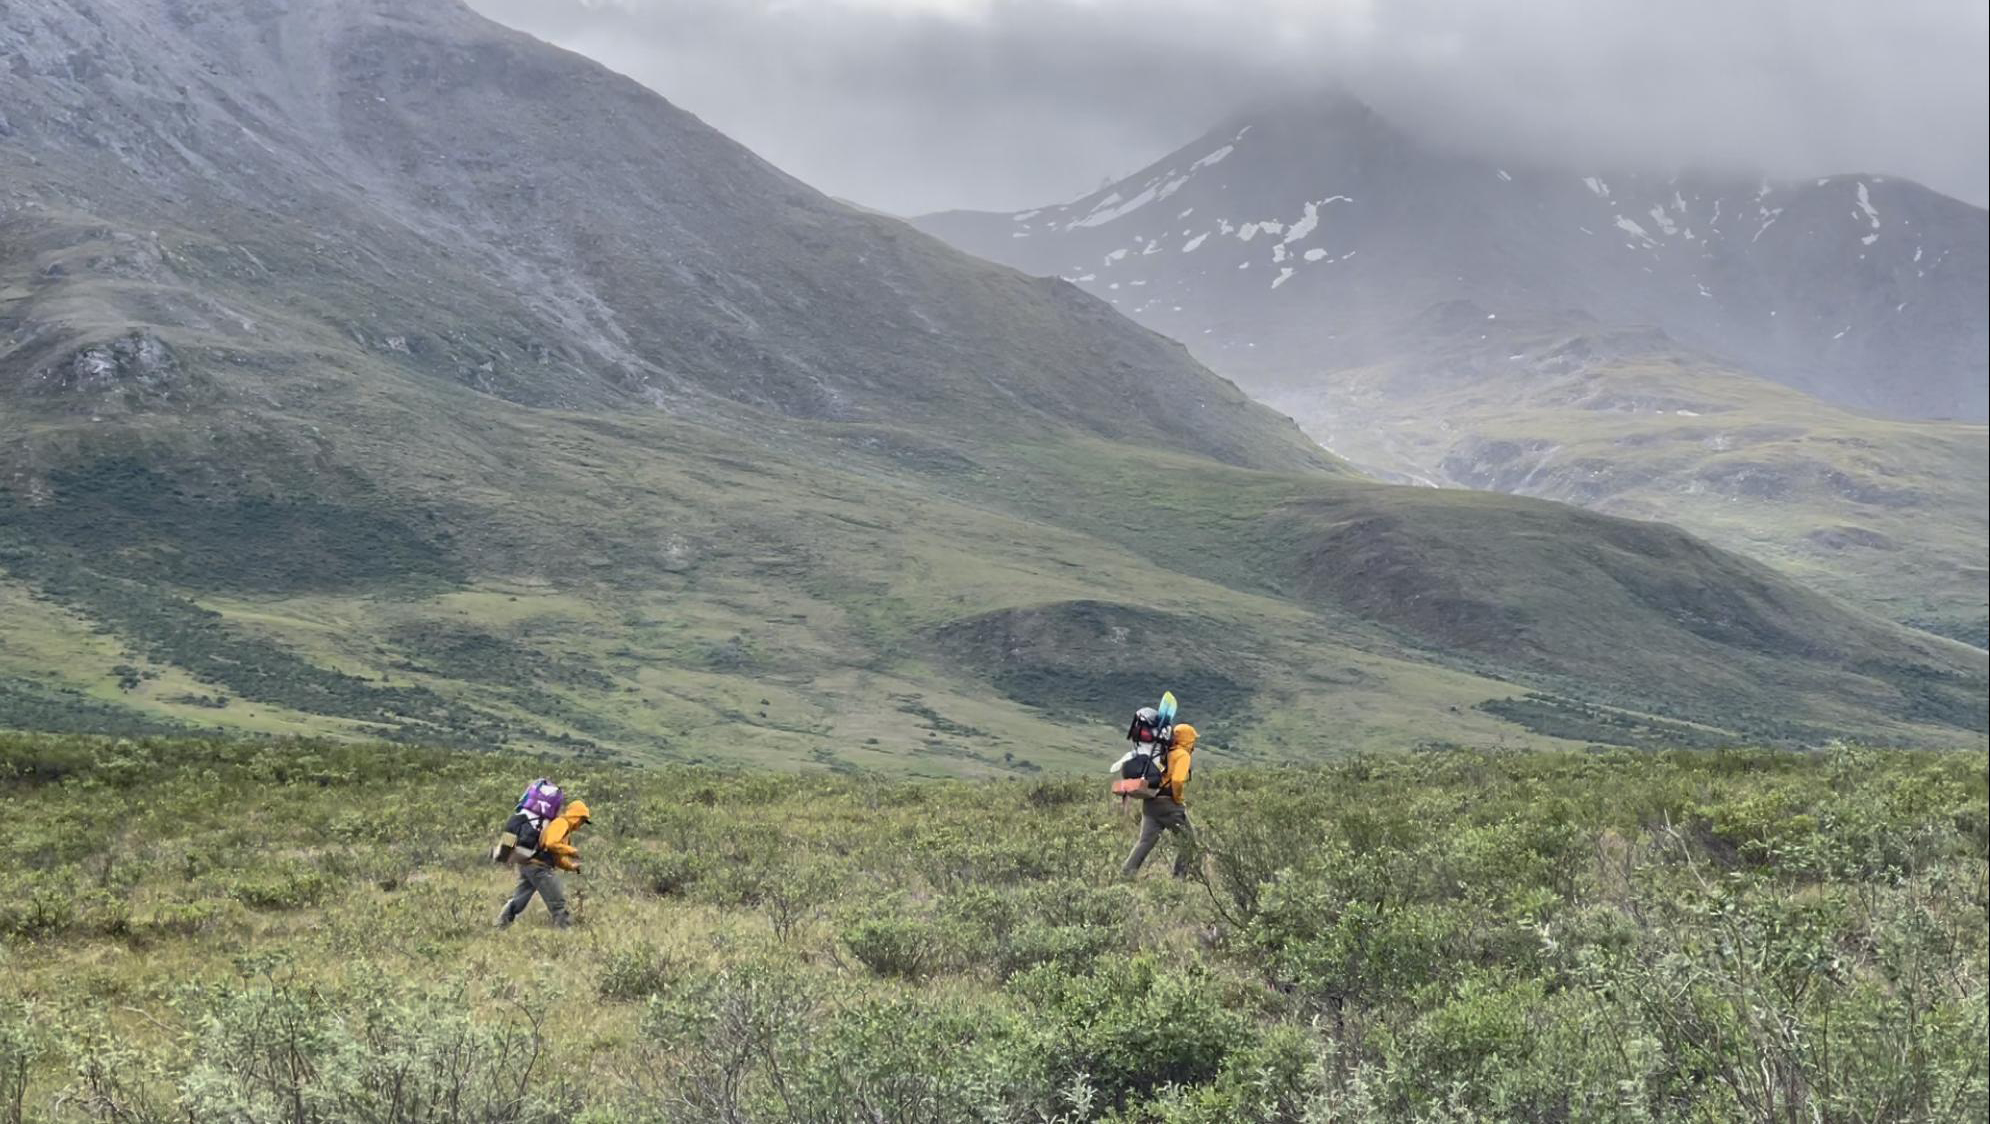
The 2022 East Fork and the Apoon Pass fires together burned more than 100,000 hectares (380 square miles) of primarily tundra landscapes in Southwest Alaska. They were among the largest tundra fires on record for the region.
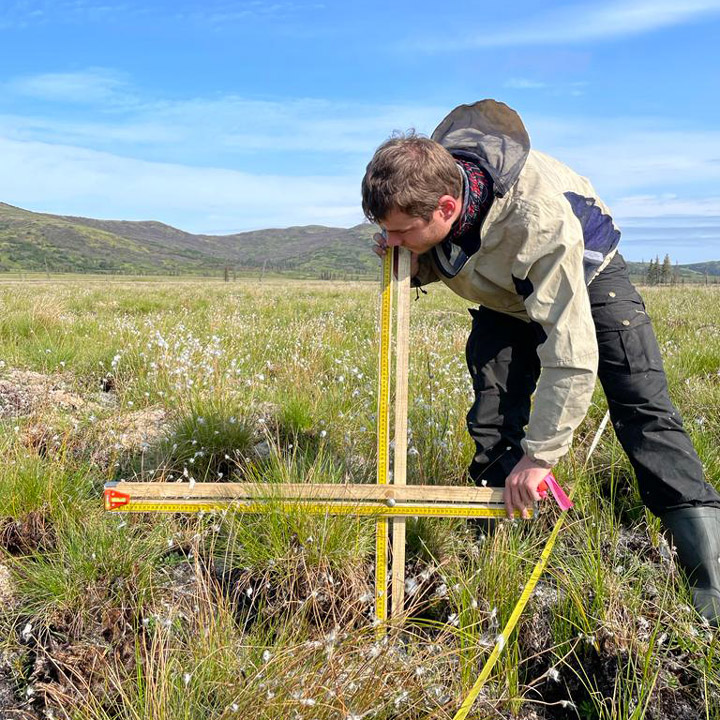
Our basecamp is the village of St. Mary’s, located just west of the East Fork fire on the Andreafsky River. For the first part of our campaign, we are taking a boat upstream to access the fire scar. We are looking for burned tussock tundra sites, where we can measure the effects of the fire on the vegetation, soils, and permafrost in our plots. We are also sampling unburned tundra sites, which provide us a reference of the conditions without fire disturbance. During the last part of our campaign we will access sites in the remote Apoon Pass fire by helicopter.
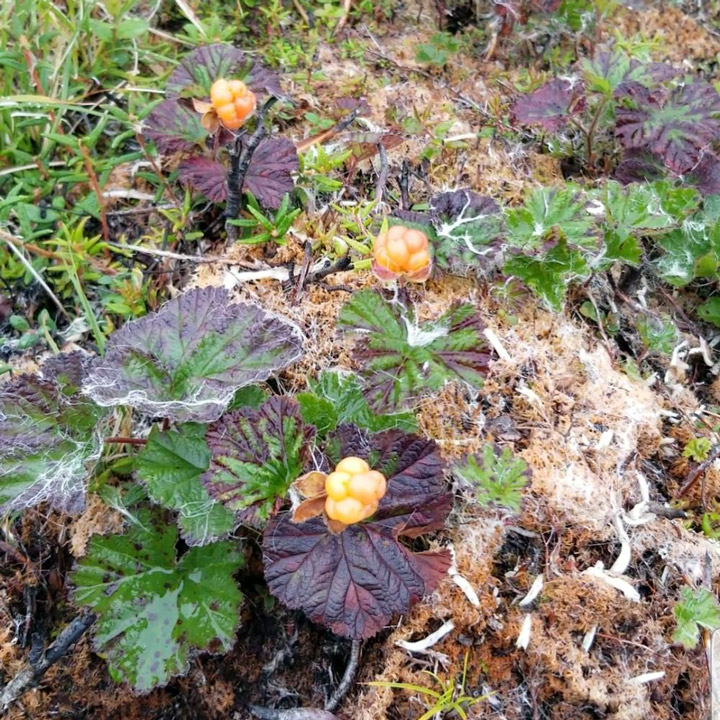
The local community heavily relies on the landscape for subsistence activities, like hunting and berry picking. Our boat driver, Matty Beans, is native to the area and is extremely helpful in bringing us to the right places. A large concern of the community is how the fire has effected the abundance of berries in the burned tundra. Our preliminary observations indicate that the cloudberries, locally also called salmonberries, were abundantly present in the burned sites. However, this was not the case yet for blueberries.
So far, we have been extremely lucky with mostly dry weather and only a little bit of rain. However, the dry weather has affected the water levels in the Andreafsky River. We came across collapsed river banks and exposed sand banks in the river. Our boat driver has switched to his jet boat so that we can continue on, even in more shallow parts of the river. The weather is changing though, with rain coming in for several days. This is good for the water levels, but the colder and rainy weather may make our sampling efforts more challenging.
After seven days and 19 plots of sampling, we are now taking a well-deserved rest day. I used this rest day to write this blog and digitize some datasheets. Over the next four days, we will continue sampling along the river and then use a helicopter to access the Apoon Pass fire site for more sampling.
This field expedition is part of FireIce (Fire in the land of ice: climatic drivers & feedbacks). FireIce is a Consolidator project funded by the European Research Council. FireIce is affiliated with NASA ABoVE.
The boreal forest is Earth’s northernmost forest. It circles the Earth at high latitudes, covering large parts of Russia, Canada, Scandinavia, and Alaska. These forests are some of the largest intact forests on Earth. They store a large amount of carbon—as much as (if not more than) is stored in tropical forests. The trees use photosynthesis to grow, and in the process, they take in carbon dioxide from the atmosphere. Carbon dioxide is an important greenhouse gas and a driver of global climate change, which is why it is vital to understand the rates of the transfer and storage of carbon between the atmosphere and the boreal forest.
Due to their vast area and remoteness, boreal forests are difficult to monitor from the ground. Data from satellites provide the means for observing these forests’ condition and detecting change across wide areas. In our project, “Clarifying Linkages Between Canopy Solar Induced Fluorescence (SIF) and Physiological Function for High Latitude Vegetation,” our team from University of Maryland Baltimore County, NASA’s Goddard Space Flight Center, and the University of Texas El Paso is working to develop advanced approaches to using satellite data to describe boreal forest productivity and detect stress responses. Our project is part of the NASA Terrestrial Ecology program’s Arctic-Boreal Vulnerability Experiment (ABoVE), a large-scale field study in Alaska and western Canada, whose overall goals are to make use of NASA technology to gain a better understanding of ecosystems at high latitudes, their responses to environmental change, and the effects of those changes.
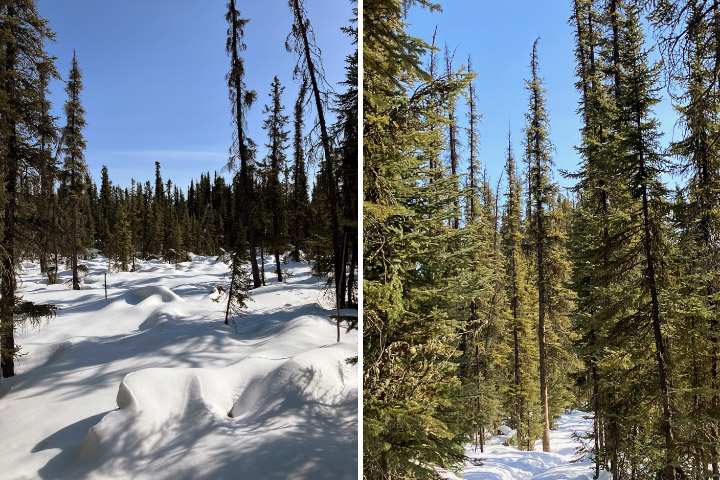
A large proportion of the trees in the boreal forest are conifers, such as spruce trees (images above). These trees keep their green needles all year long. This makes it hard to determine when they start photosynthesizing in the spring, compared to deciduous trees, like oaks, where we can clearly see the growth of new green leaves in the spring.
The timing of the start of the growing season is key to determining the overall productivity of the forest and can be a useful predictor of possible stress events later in the summer. So, one of the goals of our project is to find ways to use light to detect when these evergreens “turn on” photosynthesis in the spring and actively start taking up carbon from the atmosphere.
This brought team members to Fairbanks, Alaska, right in the heart of the boreal forest. We arrived with our instruments in April 2023 to observe the very start of the boreal growing season. Our instruments use different methods to detect the onset and rate of photosynthetic activity in plants. One method we are using to identify photosynthetic activity in the evergreens is based on light that is actually emitted from the trees. Plants absorb light to power photosynthesis, but in the process of photosynthesis some of that light energy is radiated out from the plant; this is called chlorophyll fluorescence. This fluoresced light is very dim, which is why we don’t see plants glowing, but we can use sensitive instruments to measure fluorescence at leaf and canopy scales, which can even be done with instruments on satellites from space.
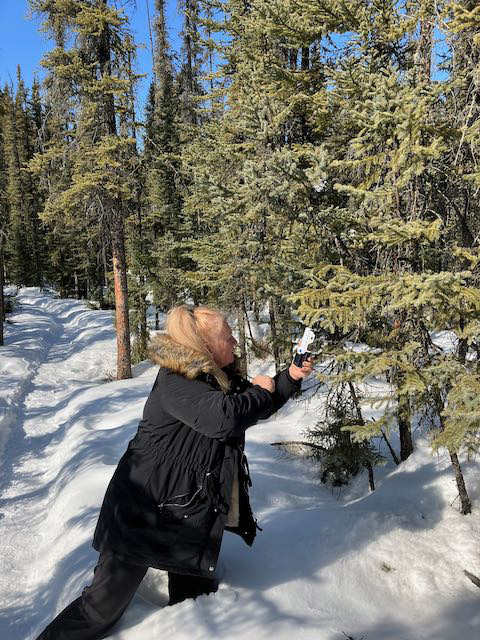
A second method is to detect very subtle changes in the color of the needles that are related to changes in the pigments in the leaves. Pigments such as chlorophyll, which makes leaves green, and carotenoids, which cause the yellow color of leaves in the fall, control potential rates of photosynthesis as well as provide protection to the leaves when stressed. These color changes are also subtle enough that we don’t see them with our naked eyes, but our instruments can measure and detect these pigment changes.
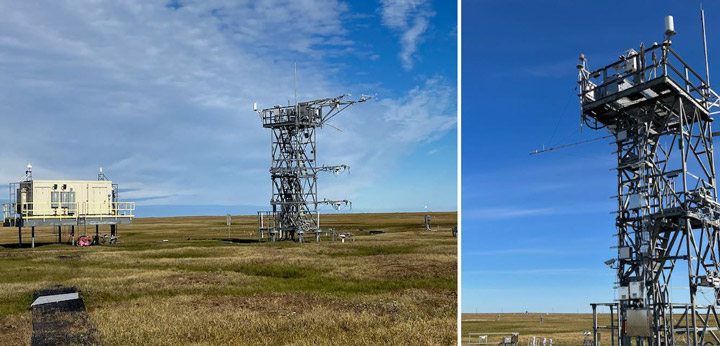
Instruments that are already on the flux tower measure the transfer of heat, moisture, and carbon dioxide between the atmosphere and the forest (images below).
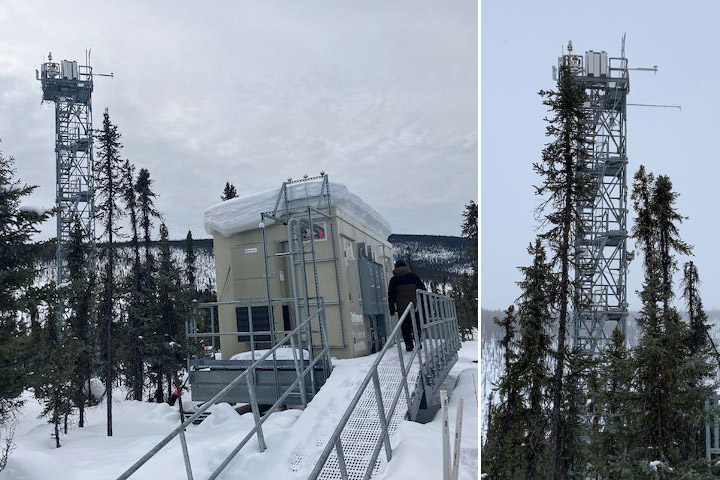
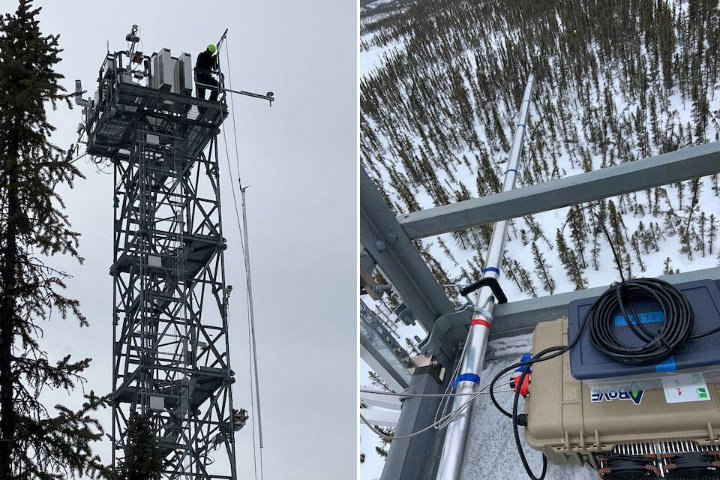
With the help of Jeb Timm, a NEON tower lead technician, we mounted our FLoX (Fluorescence Box) on the top of the tower. The FLoX looks down on the forest and measures the reflected light and solar induced chlorophyll fluorescence every few minutes continuously through the growing season (images below). FLoX measurements are similar to the data satellites provide, but with far more detail.
From the flux data we can determine photosynthesis rates and compare them with our fluorescence and reflectance measurements for relating the remotely sensed optical measurements to forest productivity. The continuous measurements allow us to examine the effects of varying light levels, moisture, and temperatures on the forest.
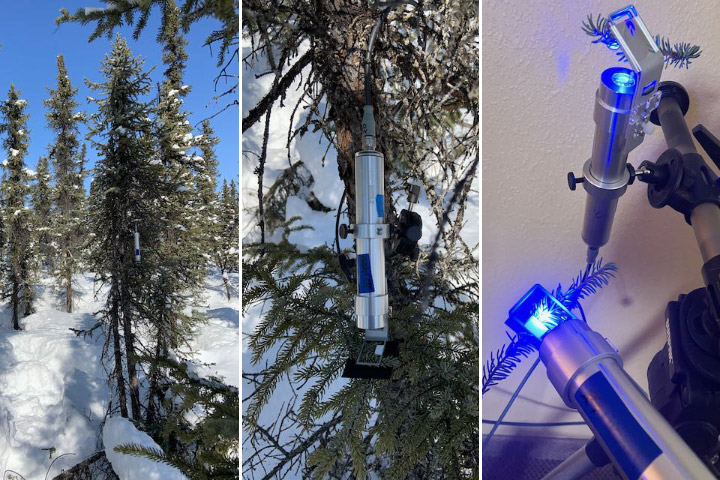
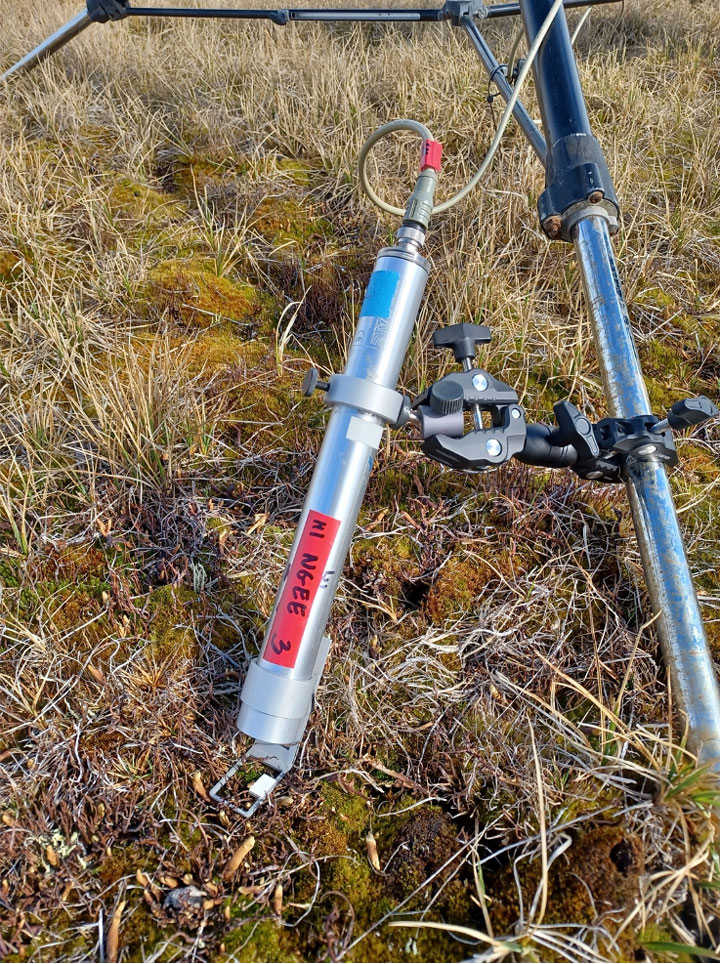
Near the flux tower we also put our MONITORING-PAM (MoniPAM) instruments whose probes actively illuminate individual spruce shoots with controlled pulses of light to measure fluorescence and photosynthetic processes at the leaf level (images below).
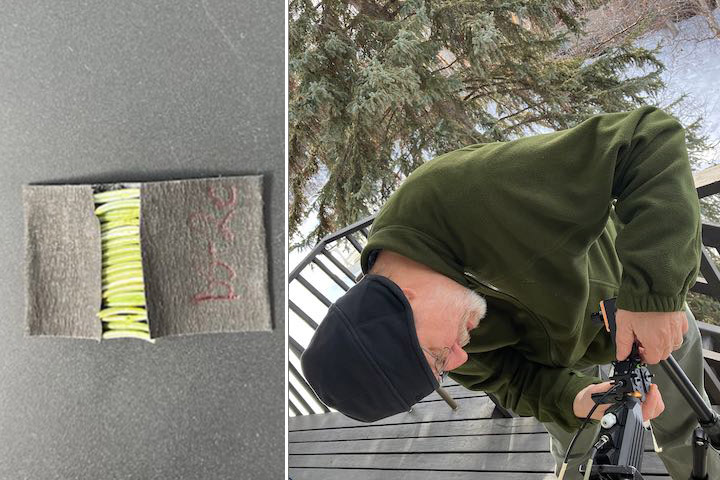
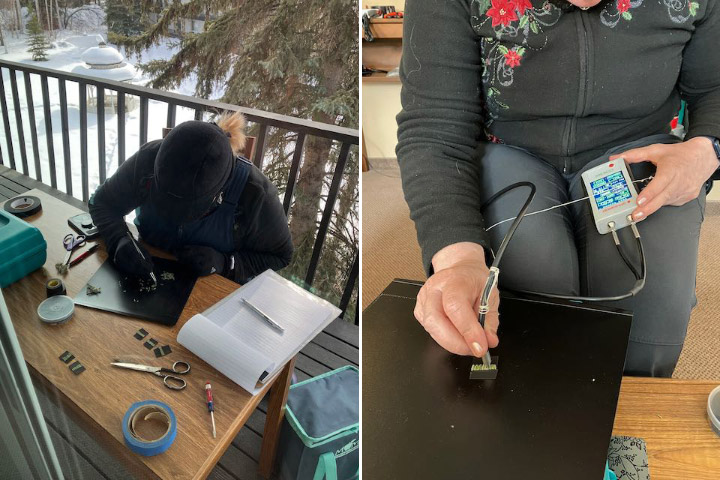
Besides setting up our instruments to catch the start of the growing season, we were hoping to be around when the spruce started to photosynthesize. This would allow us to test if we could detect the onset of photosynthesis through changes in needle reflectance due to changing pigment pools and/or fluorescence measured using a special leaf clip. To get consistent measurements using the same amount of needles, we had to pull off the individual tiny needles then line them up to make a solid mat to measure. And because photosynthesis and fluorescence are temperature sensitive, we had to make our measurements at the temperature the needles experience, so we worked on the deck outside in the cold (images below). The deck looked out on a big white spruce that was full of busy red squirrels who chattered and scolded us while we made our measurements.
Unfortunately, the temperatures mostly stayed below freezing the entire time we were there, so we didn’t get a chance to measure needles as they became photosynthetically active.
While we were there, there was also a NASA funded study of snow called SnowEx. In this part of the SnowEx study, researchers were studying changes in snow characteristics during the thaw period. The SnowEx field team made measurements of the snow on the ground, and NASA flew the Airborne Visible-Infrared Imaging Spectrometer – Next Generation (AVIRIS-NG) imaging system on an airplane, collecting high resolution canopy spectroscopy measurements. We plan to make use of the airplane imagery in our study to see if we can identify changes in tree reflectance (which is noise to the snow scientists) indicating the start of photosynthesis.
We will return in late July to collect measurements during the period of peak summer forest productivity.
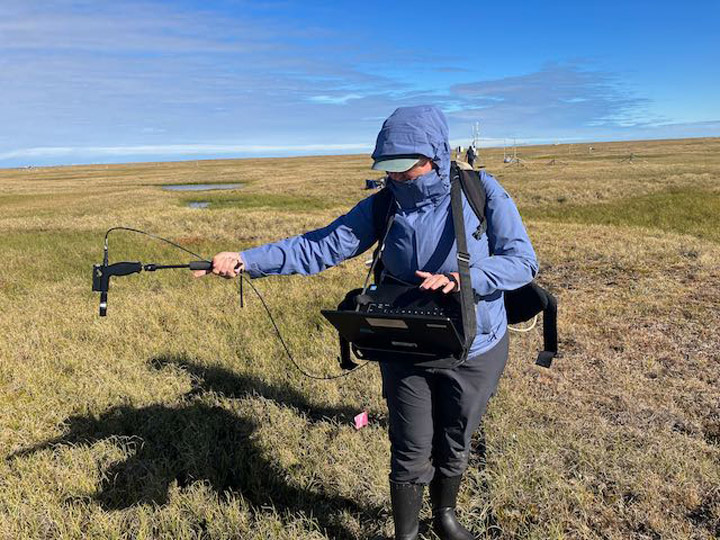
We returned to Utqiagvik, the northernmost town in the U.S., for fieldwork for our project “clarifying linkages between canopy SIF and physiological function for high latitude vegetation.” We want to learn how to use the information from the light emitted by tundra plants as solar induced fluorescence (SIF) to describe the functioning of the tundra ecosystem. In the process of photosynthesis, plants not only absorb light, but they also emit light called chlorophyll fluorescence. The fluoresced light provides information about the rate of photosynthesis and about plants responses to stress. Although not much light is emitted by fluorescence, we can detect it with sensitive instruments, and even from space with instruments on satellites. We are making measurements on the ground so that we can understand how the diverse tundra vegetation is responding to environmental conditions, and how to make the best use of satellite images of this region.
This project is part of the NASA Terrestrial Ecology program’s Arctic-Boreal Vulnerability Experiment (ABoVE), a large-scale field study in Alaska and western Canada, whose overall goals are to make use of NASA technology to gain a better understanding of ecosystems at high latitudes, their responses to environmental change, and the effects of those changes.
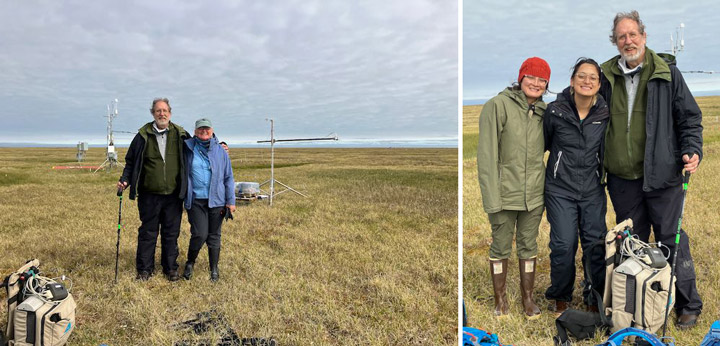
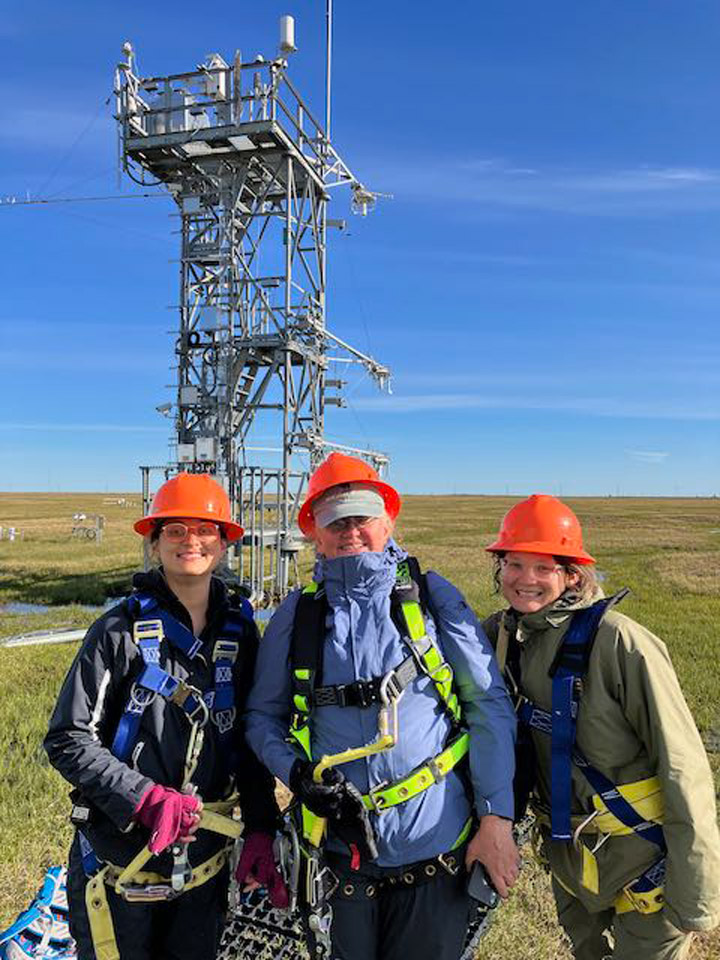
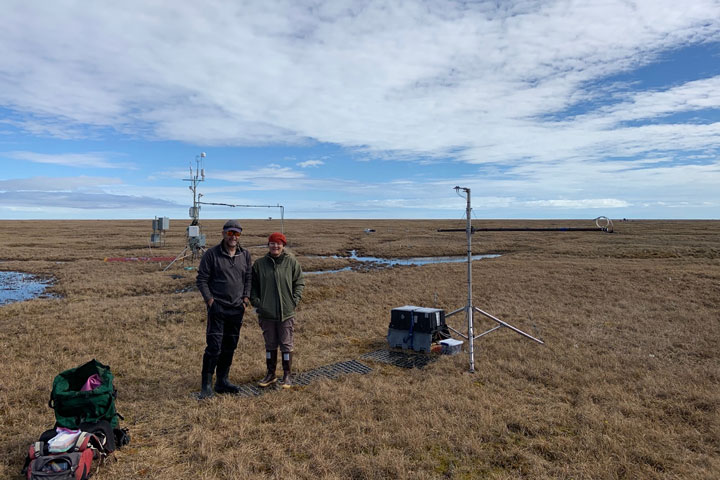
Our field team …
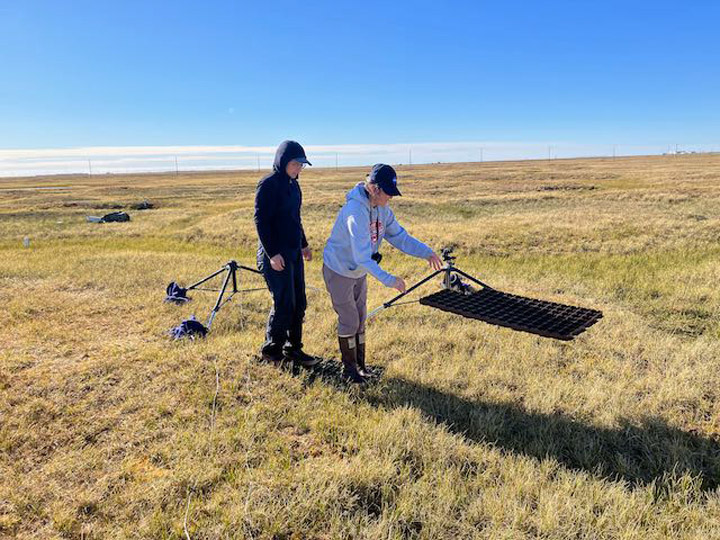
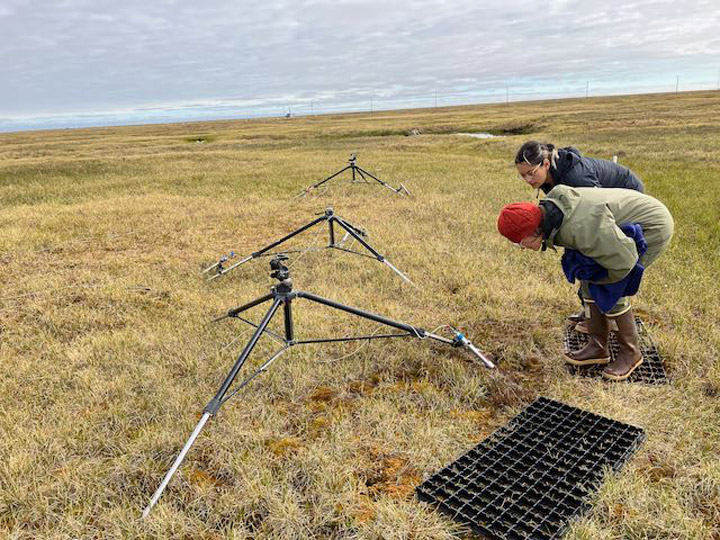
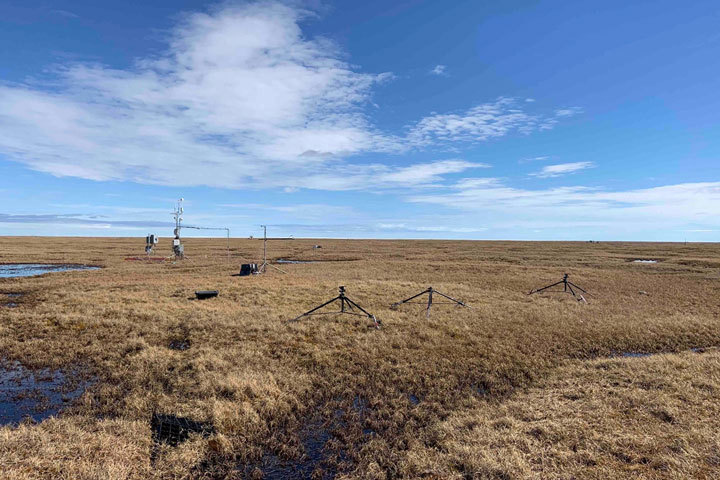
In June, which is early spring for the tundra, we set up automated instruments at two existing tundra sites. Our instruments include the FLoX (Fluorescence Box), which measures the reflected light and solar induced chlorophyll fluorescence of patches of the tundra, and the monitoring PAM (MoniPAM), whose probes illuminate small patches of leaves or moss with controlled pulses of light to measure fluorescence and photosynthetic processes at the leaf level. These instruments automatically measured the fluorescence throughout the day to observe effects of varying light levels and temperatures and through the course of the growing season as the tundra plants grow. The FLoX gives us measurements of patches of ground that are like the data we can get from satellites, although measuring a very much smaller area than the satellite sees.
We returned in August to measure the tundra during its peak of summer growth.
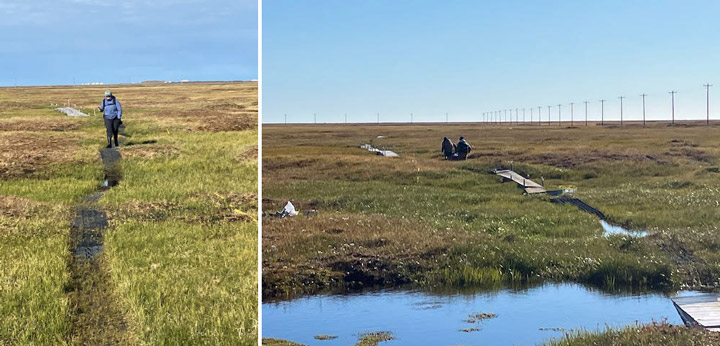
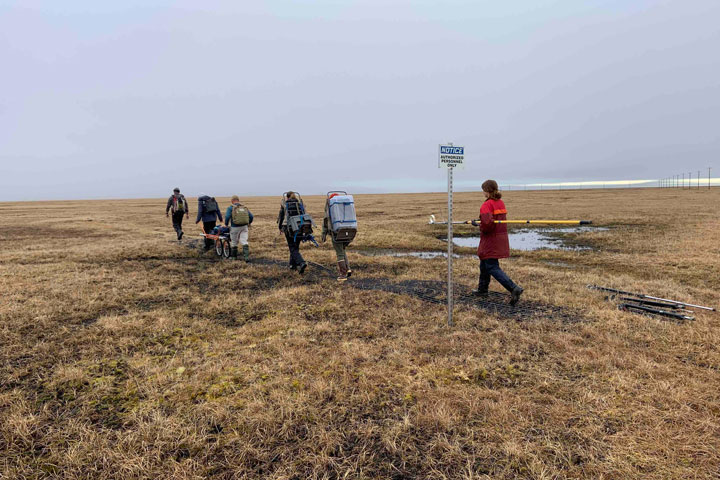
It is a bit of a stroll out to our sites. The path has boardwalks and plastic matting laid down to protect the tundra from serious erosion from people’s feet.
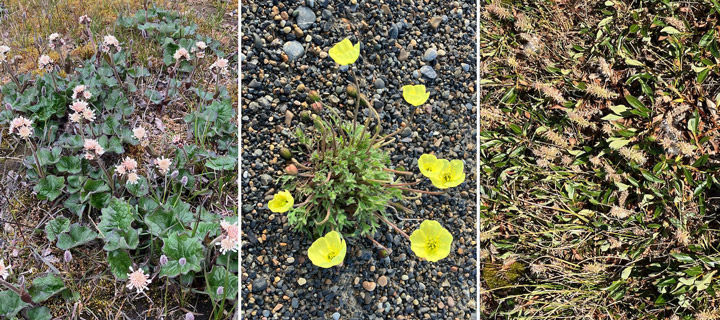
Along the way there were flowers, birds, and animals to see. There were a lot of lemmings this year. When we startled these small gerbil-like animals, they would quickly run along their trails through the tundra and disappear into holes in the ground. The lemmings need to be quick because we also saw several snowy owls and a couple of arctic foxes. The owls and foxes eat the lemmings, and these predators’ populations were high because of the number of lemmings. There were also Lapland longspurs and snow buntings, sparrow sized birds that breed in the Arctic, popping around our sites.
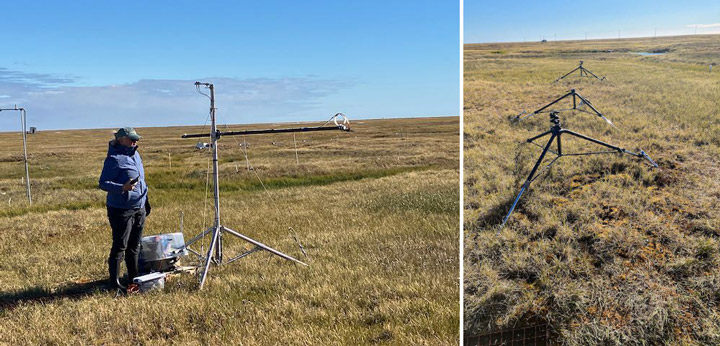
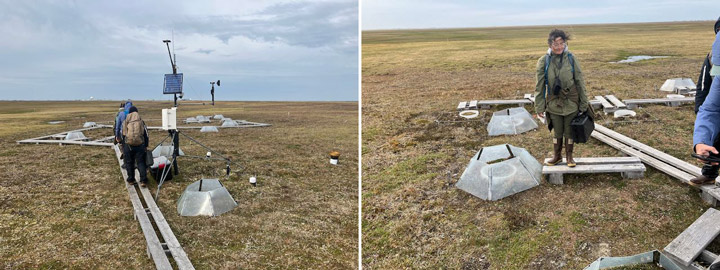
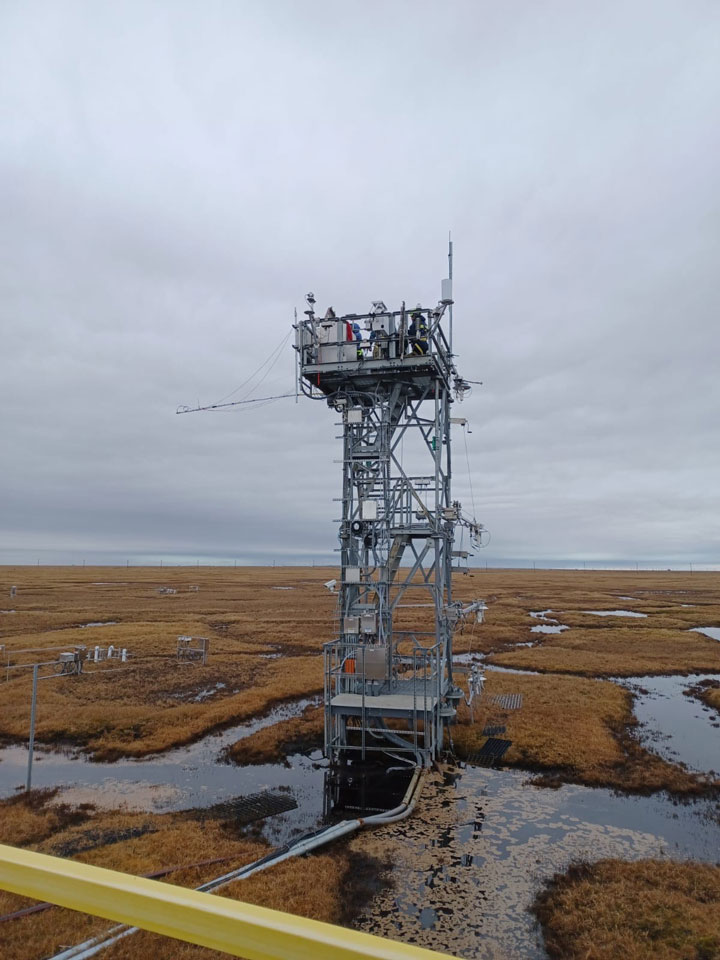
We visited our automated sensors at the Department of Energy Next Generation Ecosystem Experiment (NGEE) Arctic flux tower site.
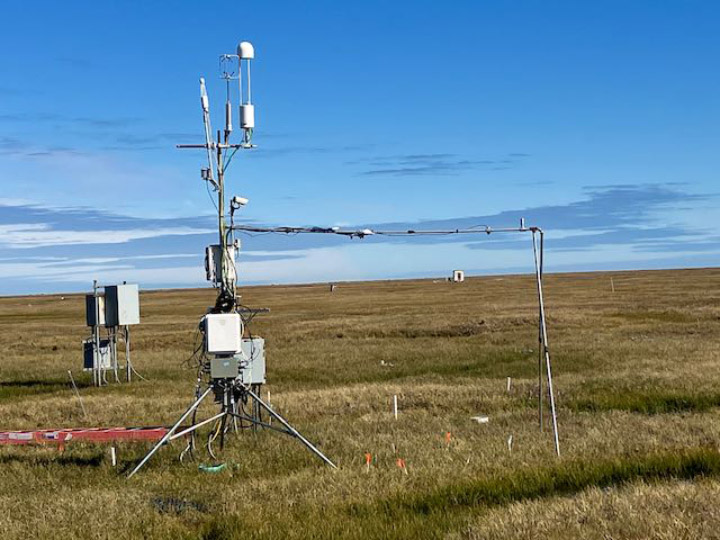
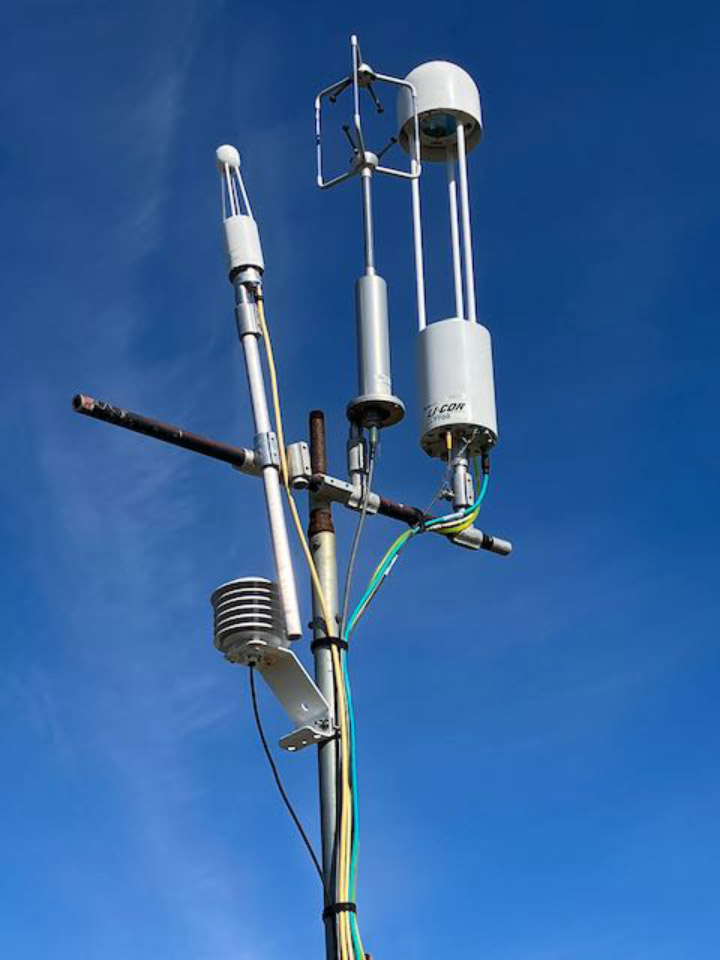
This image shows the three main instruments on the NGEE flux tower. On the left is an infrared gas analyzer, which measures the concentration of CO2 and water vapor in the air. On the right is an instrument to measure the methane concentration. In the center is a sonic anemometer. The sonic anemometer very accurately and rapidly measures the upward and downward wind speed. The vertical wind speed information combined with the measurements of CO2, water vapor, and methane concentrations from the other sensors can be used to calculate their transport into and out of the ecosystem. For example, CO2 taken up by the ecosystem is a measure of the rate of photosynthesis.
We visited our sites to check on our automated sensors to make sure they are running and collecting and storing data.
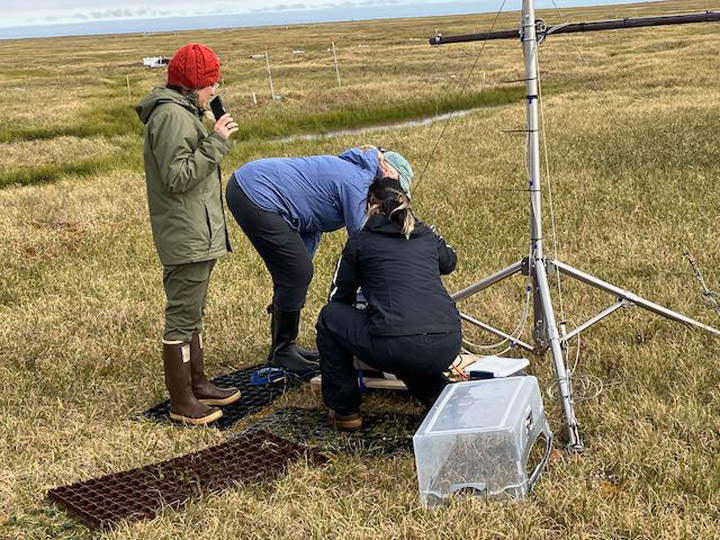
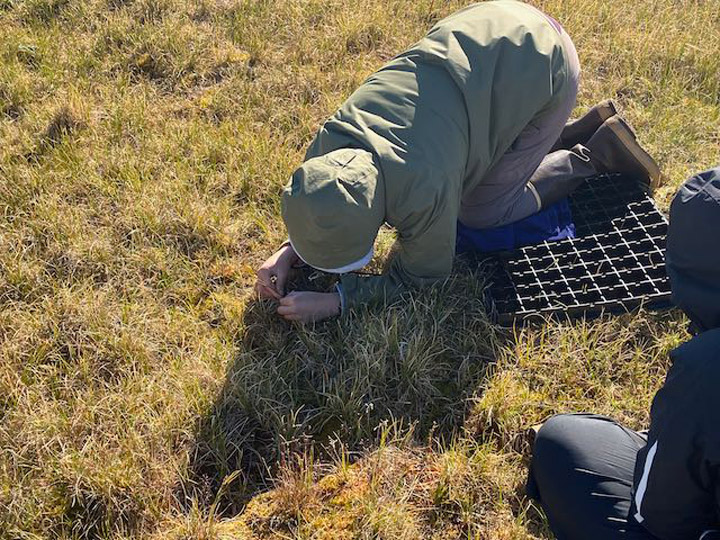
While at the sites, we also make additional measurements to add to the data from the automated sensors.
Our second site was at the National Science Foundation’s National Ecological Observatory Network (NEON) flux tower.
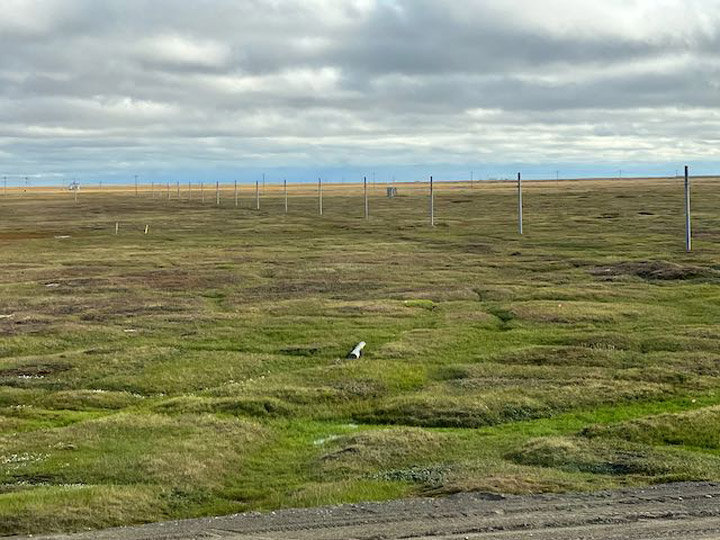
We also measured a number of plots with different types of vegetation cover within this area of high-centered polygon tundra near the lab building.
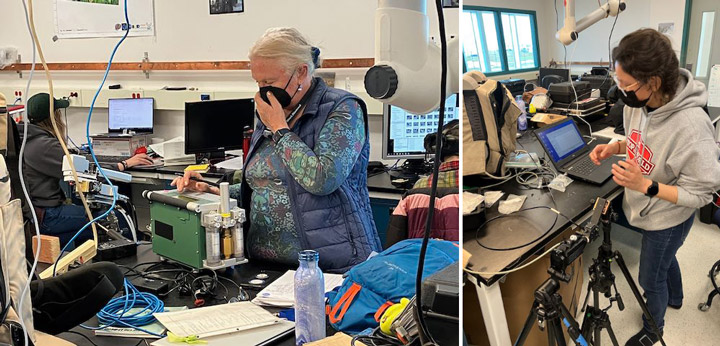
When the weather turned bad (rainy and in the 30s Fahrenheit) we worked in the lab measuring photosynthesis, fluorescence spectra, and chlorophyll content for plant samples from our study plots.
As a side project we located the transect I worked on 20 years ago and remeasured it. Even after all of these years I was surprised that I didn’t have any problem finding the start of the transect, and there was still a wooden stake there. But we couldn’t locate a marker for the far end, so we had to use GPS to locate it. It pleased me to see that the path we had worn by walking on the tundra 20 years ago had healed and I couldn’t see any sign of it now.
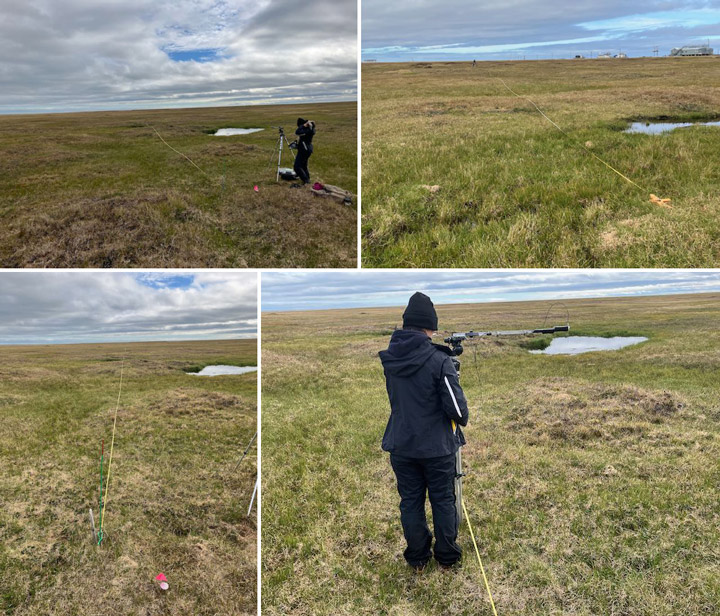
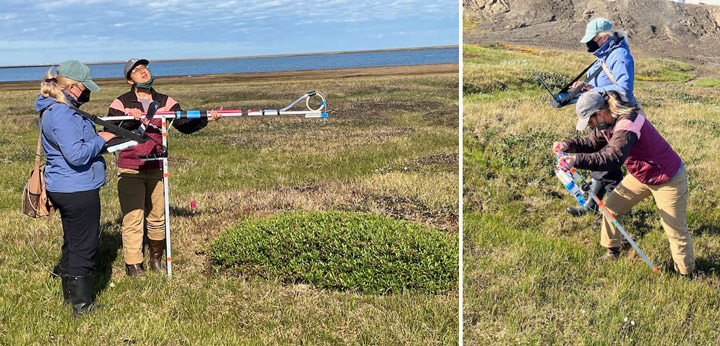
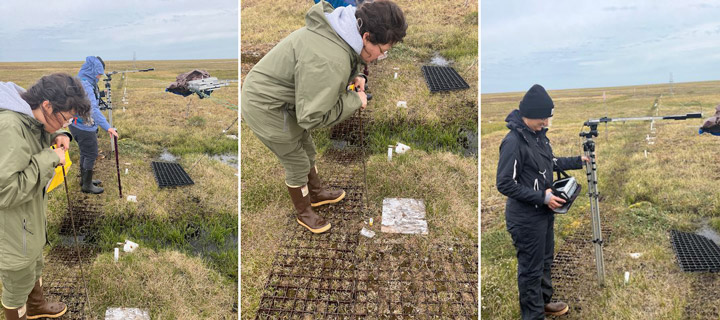
Another day we visited the International Tundra Experiment (ITEX) site. The site was established back in the 1990s for the long-term monitoring of plant growth.
Regular measurements of reflectance, soil moisture, water table height, and the depth of permafrost thaw (using the high-tech method of pushing a rod into the ground until it hits the frozen layer) are made throughout the growing season.
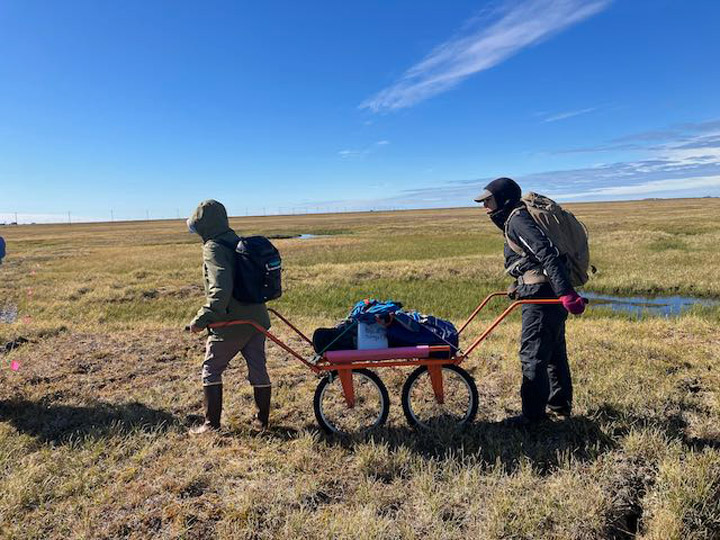
At the end of our field campaign, we removed all of our equipment from the field.
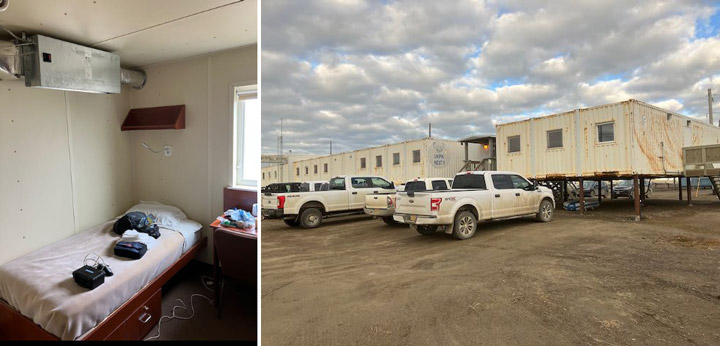
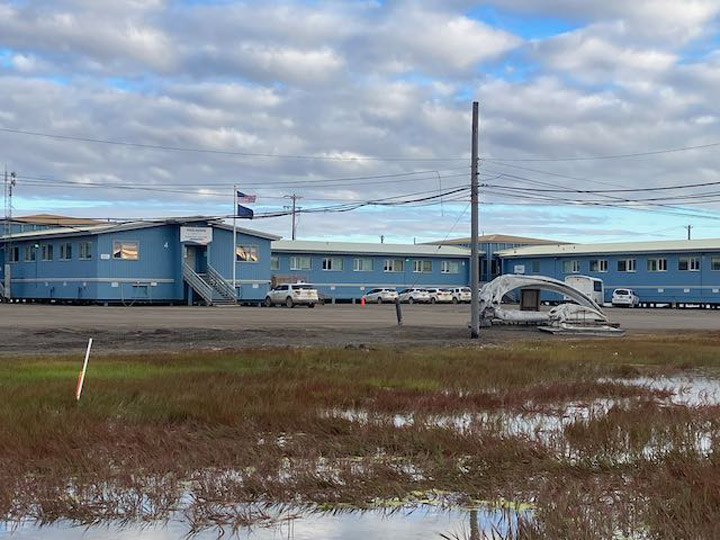
We live and work outside of Utqiagvik on the grounds of the former Naval Arctic Research Lab (NARL). NARL was founded 75 years ago, during the height of the Cold War. NARL was part of a tradition of research in Utqiagvik. The facility is now managed by the Ukpeaġvik Iñupiat Corporation (UIC), the native-owned corporation that manages the Barrow Arctic Research Center (BASC). Some of the buildings left behind by NARL are now used by BASC and Ilisagvik College, the only tribally controlled college in Alaska and the northernmost accredited community college in the U.S.
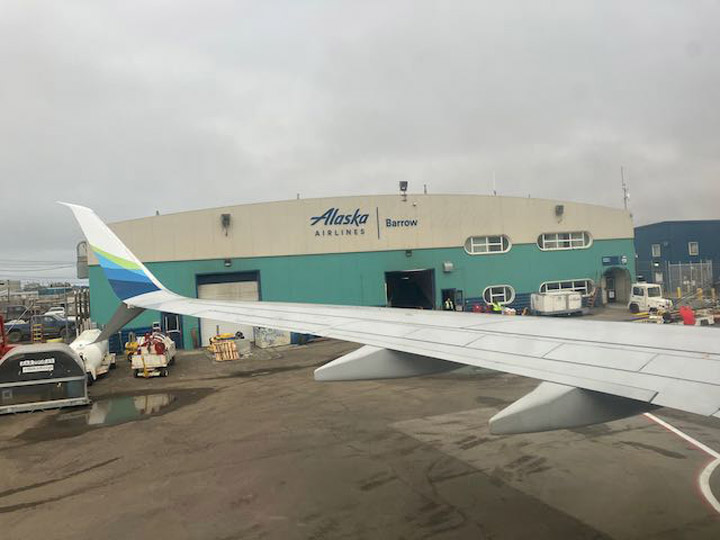
There are no roads to Utqiagvik. Almost everything has to come in by air.
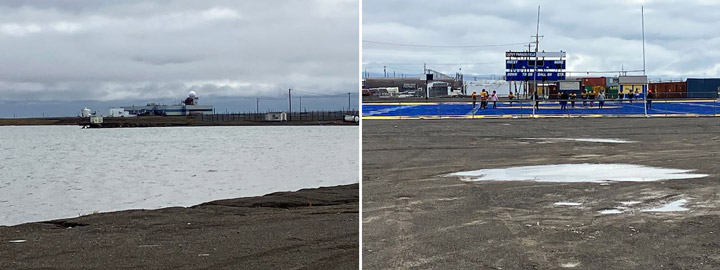
Heavy or bulky stuff that is not shipped by air freight comes up once a year on a barge.
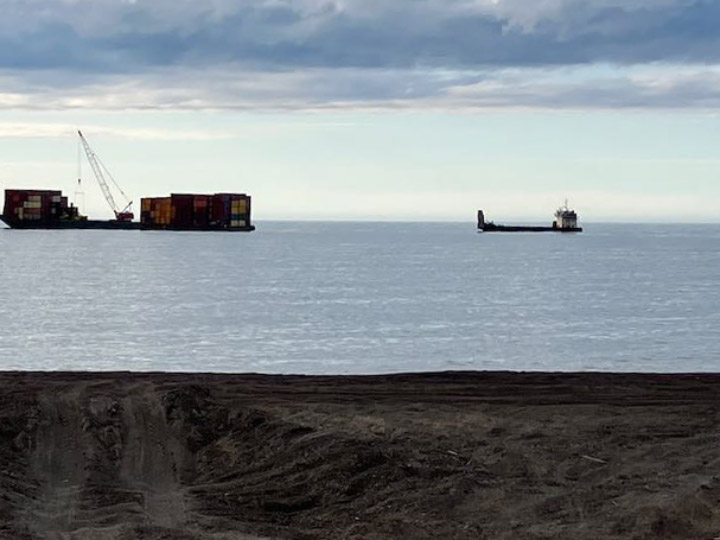
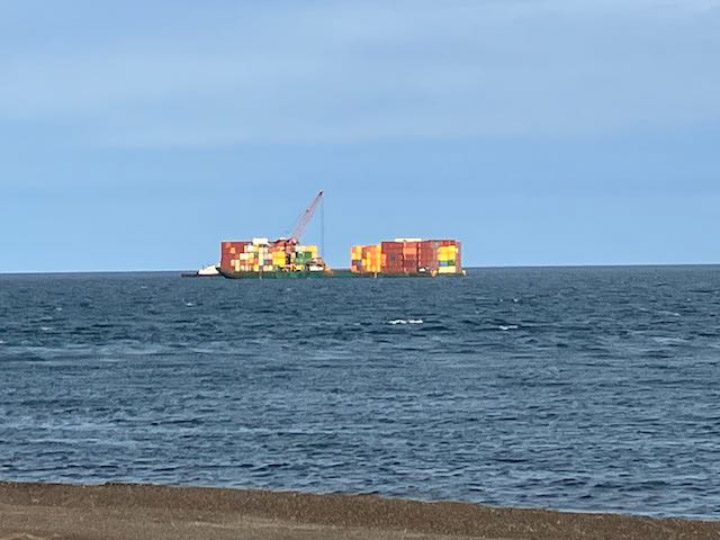
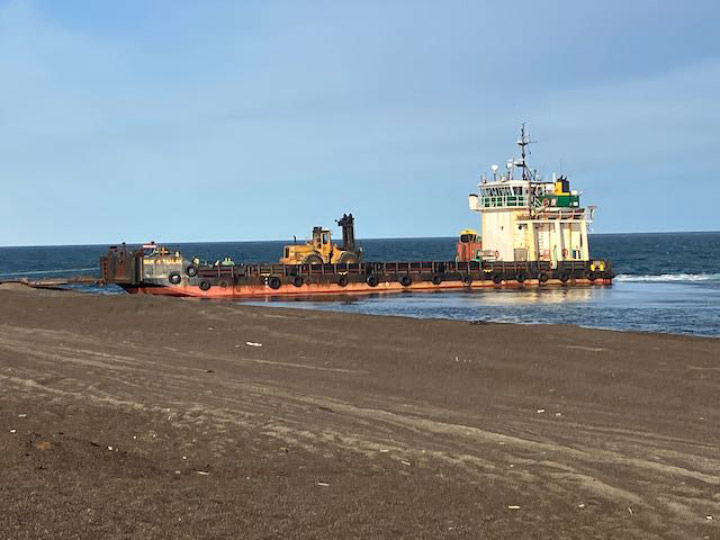
The annual barge arrived while we were up there. There’s no dock to unload on (the sea ice would probably destroy one) so they use a landing craft to bring the stuff ashore.
The most exciting animal sighting was on my last day when we saw several Beluga whales swimming near shore near the place where they had been bringing the cargo from the barge ashore.
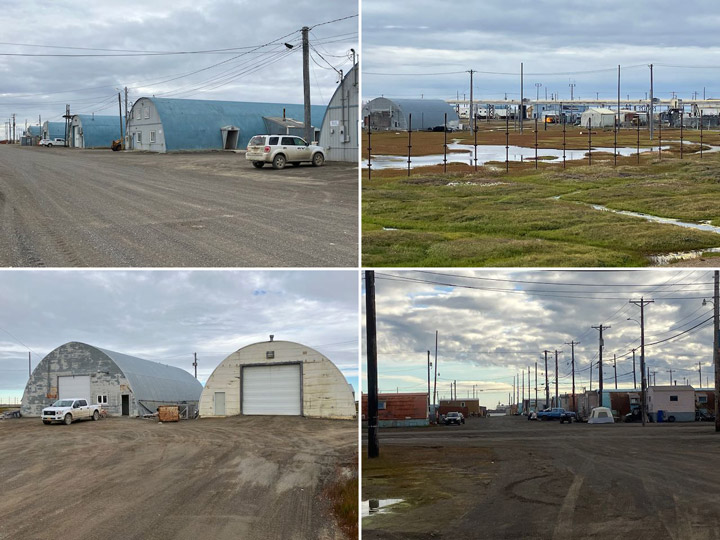
In a lot of ways Utqiagvik is like any other town.
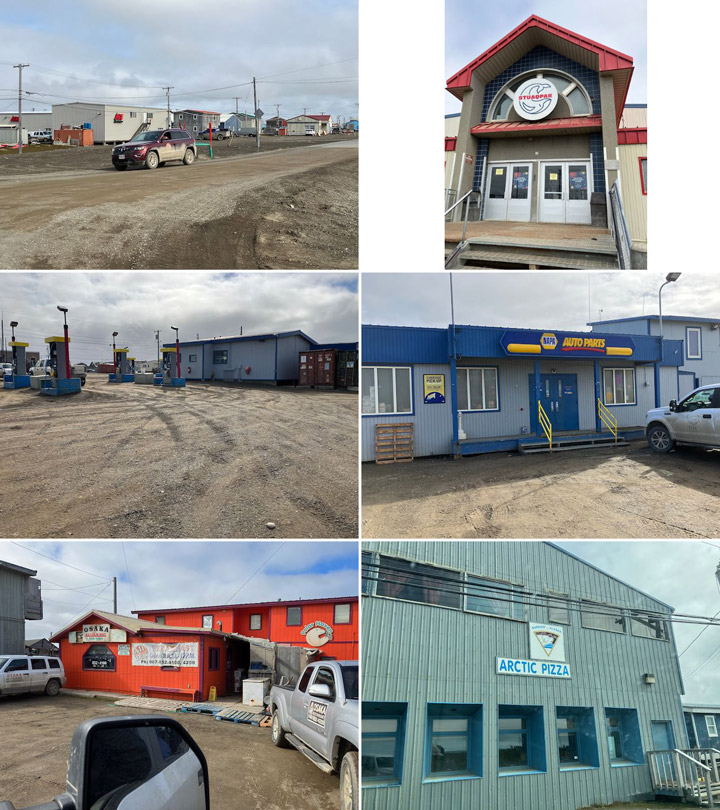
There’s a modern supermarket, the Stuaqpak (which means “big store” in Iñupiaq), a hardware store, pizza places, Chinese restaurant, and gas station. But then there are twists. All the streets are gravel, except for the one street that runs in front of the airport. The auto parts store also sells whaling equipment. Gas comes up on the barge once a year, so the price of gas stays the same until they start tapping the new shipment. When the restaurant is open, you can look out on the Arctic Ocean while you have a slice at Arctic Pizza.
Also in town is the Iñupiat Heritage Center, which has exhibits on the people and their culture.
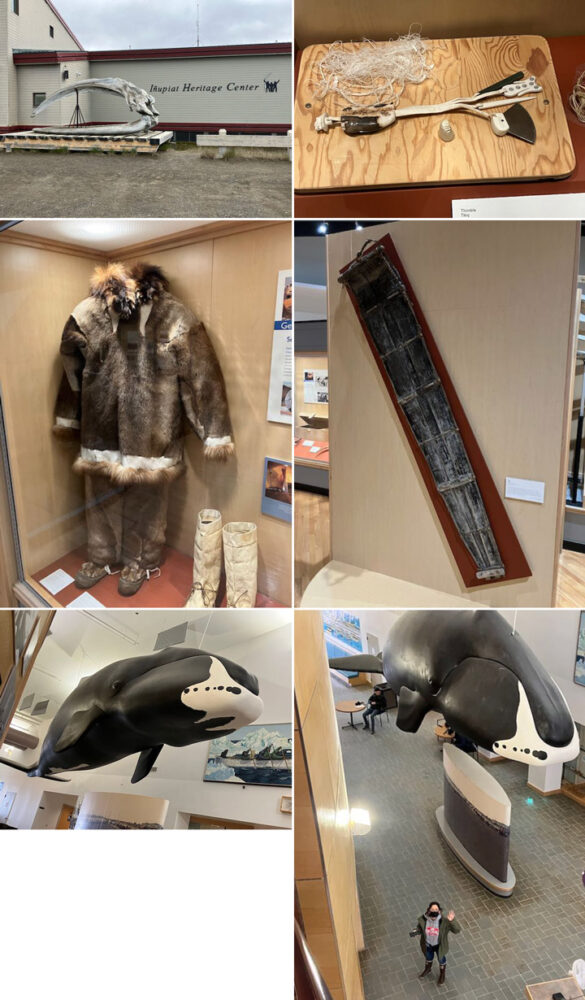
In front of the building is a bowhead whale skull about the size of a VW Beetle. There is a picture of a field sewing kit and sinew used for thread (upper-right). One thing I learned at the center is the critical importance of sewing for survival in the Arctic. The quality and maintenance of clothes is a matter of life and death in this harsh climate (middle-left picture). The ability to sew is also important for making the coverings for skin boats, which are used to hunt whales and other sea life. The middle right picture is a sled made out of the baleen from the whales. In the lobby is a life-sized model of a young bowhead whale (lower pictures). You can get a sense of its size compared to Brenda.

We learned in school that plants take in CO2 and water and use light to drive photosynthesis to grow. But what you may not know is that as part of the process of photosynthesis plants also emit light, called chlorophyll fluorescence. The fluoresced light provides information about the rate of photosynthesis and plant responses to stress. Although the fluoresced light is very dim, we can use sensitive instruments to measure that fluorescence, and this can be done even with satellite instruments in space.
Arctic tundra is the coldest ecological community. It circles the high latitudes of the northern hemisphere which is experiencing strong climate changes that affects the growth of tundra plants. Much of the tundra regions are remote and very hard to reach, so it is difficult for us to know just how tundra is responding to climate change. Satellites flying overhead can provide information about the tundra across the entire region, even in all of those difficult to reach places. In our project, “clarifying linkages between canopy SIF and physiological function for high latitude vegetation,” we want to learn how to use the fluorescence signal to describe the functioning of the tundra ecosystem so that we can understand how the diverse tundra vegetation is responding to climate change and make the best use of satellite images of this region. Our project is part of the NASA Terrestrial Ecology program’s Arctic-Boreal Vulnerability Experiment (ABoVE), a large-scale field study in Alaska and western Canada, whose overall goals are to make use of NASA technology to gain a better understanding of ecosystems at high latitudes, their responses to environmental change, and the effects of those changes.
This took our team—from the University of Maryland Baltimore County, NASA’s Goddard Space Flight Center, and the University of Texas El Paso—north to Utqiaġvik (formerly Barrow) Alaska on the shores of the Arctic Ocean. Utqiaġvik, the northernmost city in the United States, is on the lands of the Iñupiat people. There are no roads to Utqiaġvik, so all of our equipment had to be shipped by air up there.
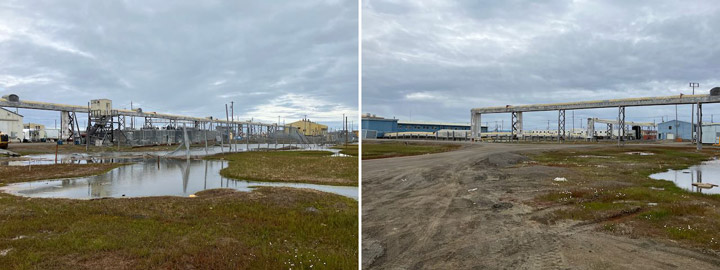
The goal of our June campaign was to install automated sensors to capture the springtime green-up of the tundra. Even though it is June and after the official first day of summer, spring is just starting in Utqiaġvik. There is ice in the ocean (Figure 1), the snow is just melting off the land, and the tundra is brown. Our instruments include the FLoX (Fluorescence Box) that measures the reflected light and solar induced chlorophyll fluorescence of patches of the tundra (Figures 2, 3 and 4) and the monitoring PAM (MoniPAM) whose probes illuminate small patches of leaves or moss with controlled pulses of light to measure fluorescence and photosynthetic processes at the leaf level (Figure 5). These instruments automatically measure the fluorescence throughout the day to observe the effects of varying light levels and temperatures and through the course of the growing season as the tundra plants grow. The FLoX gives us measurements that are similar to the kinds of data we can get from satellite. Making these measurements on the ground lets us know exactly what we are looking at, which helps better understand what the data mean.
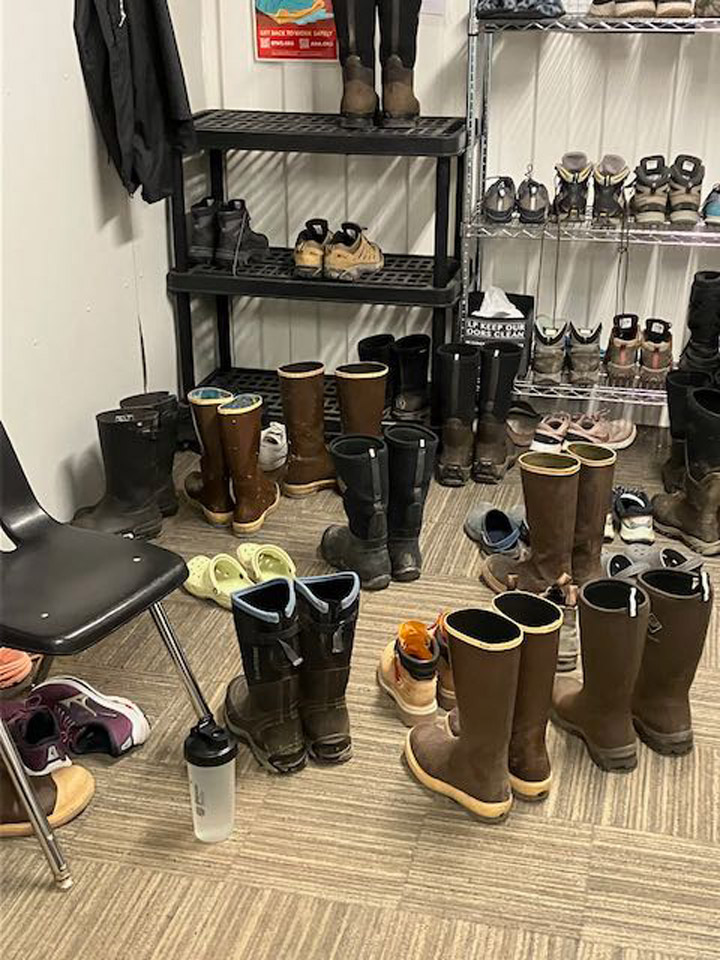
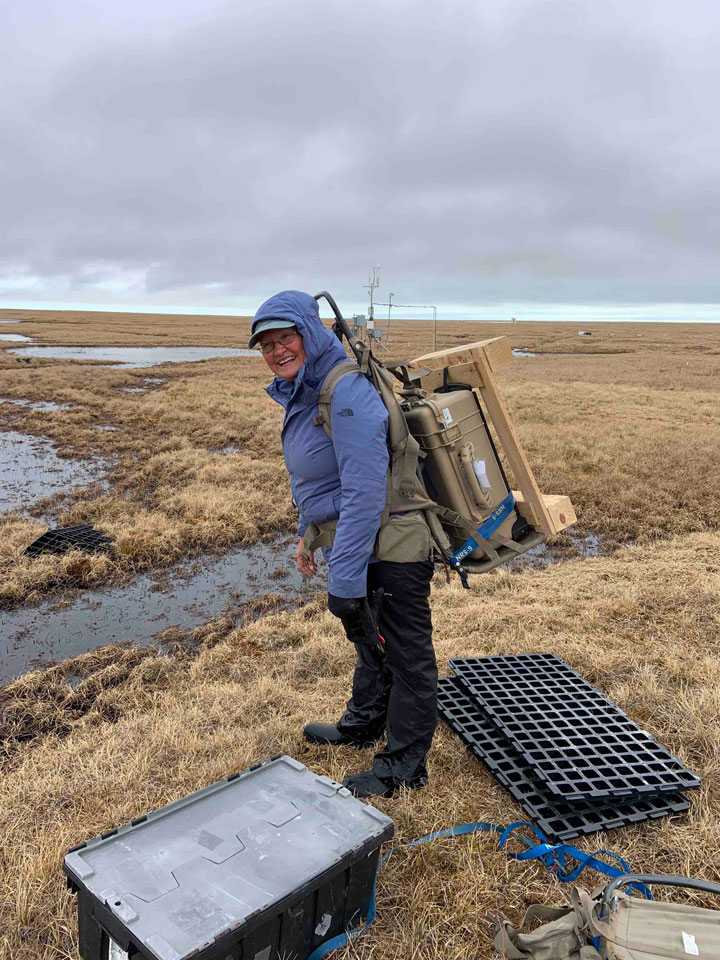
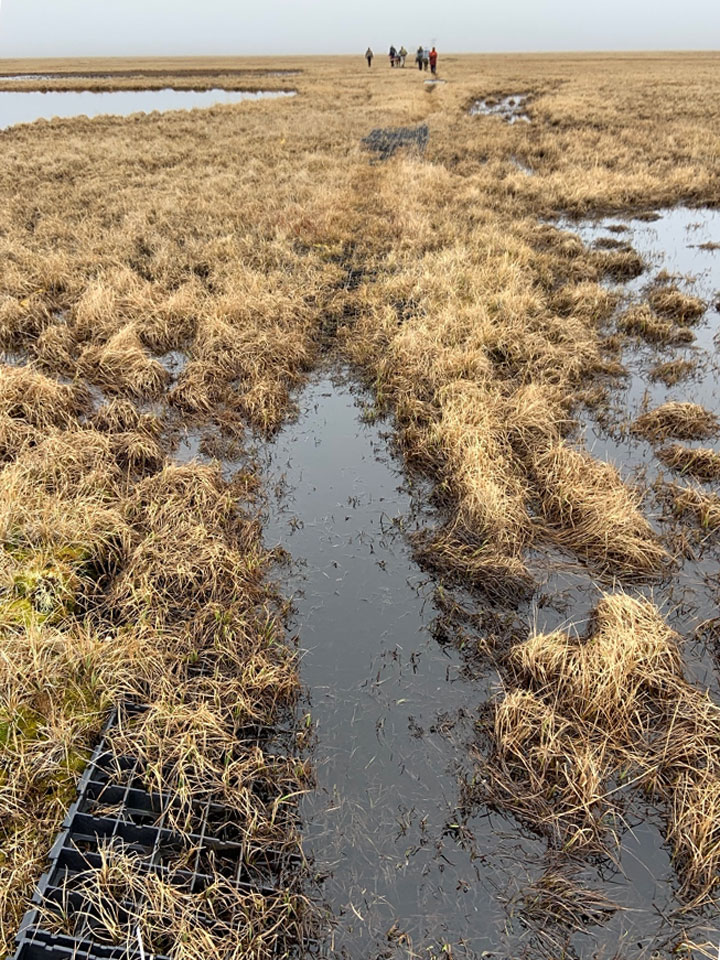
Our instruments are deployed at existing flux tower sites. Flux towers measure water, heat, and carbon dioxide exchange between the ground and the atmosphere as well as provide weather data. The flux towers were about a mile from the nearest road, so all of our equipment had to be backpacked into the sites (Figures 6 and 7). It is a soggy hike in because this time of year the tundra is very wet, since the snow has just melted and the soil is still frozen keeping the water from seeping into the ground (Figure 8).
One site is the Department of Energy Next Generation Ecosystem Experiment (NGEE) Arctic flux tower and here we are measuring a drier tundra site (Figures 2 and 4). The other site is the National Science Foundation’s National Ecological Observatory Network (NEON) flux tower (Figure 3), which is a wetter site. We use the flux data to determine photosynthesis rates to compare with our measurements of fluorescence to develop approaches for relating remotely sensed optical measurements to tundra ecosystem productivity.
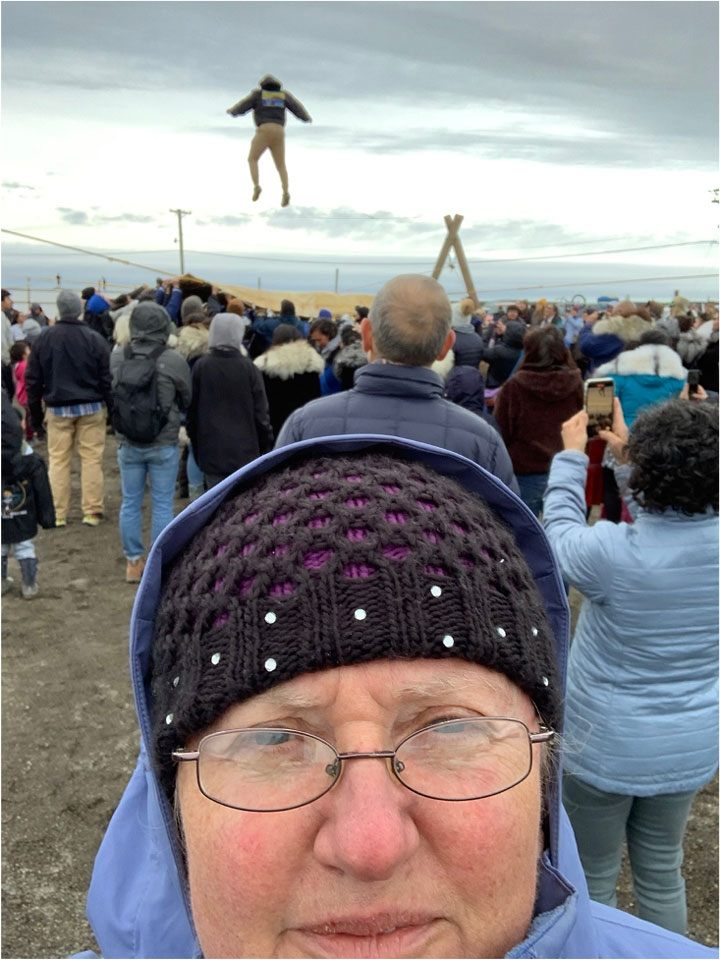
The trip wasn’t all work, Petya Campbell and students were able to attend a Nalukataq, the Iñupiat whaling festival, and see the traditional blanket toss that throws the blanket dancer high into the air (Figure 9).
We will return in August at the time of peak growth of the tundra to collect further measurements of fluorescence and productivity to add to the seasonal descriptions of fluorescence from these automated sensors.
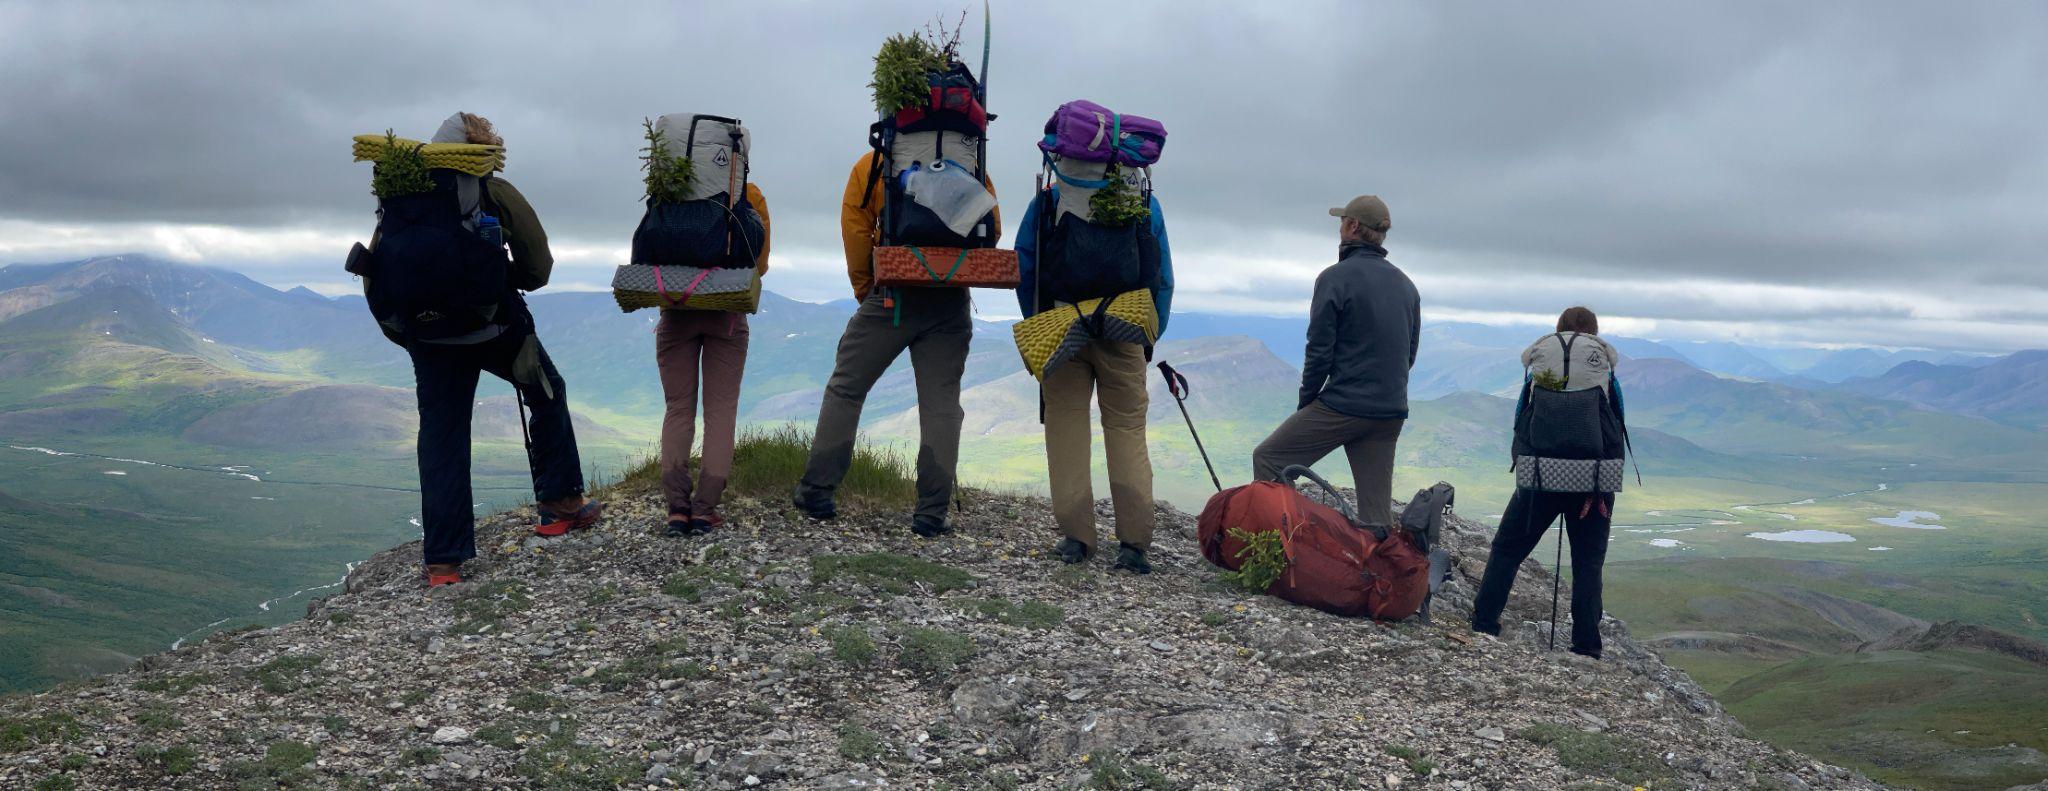
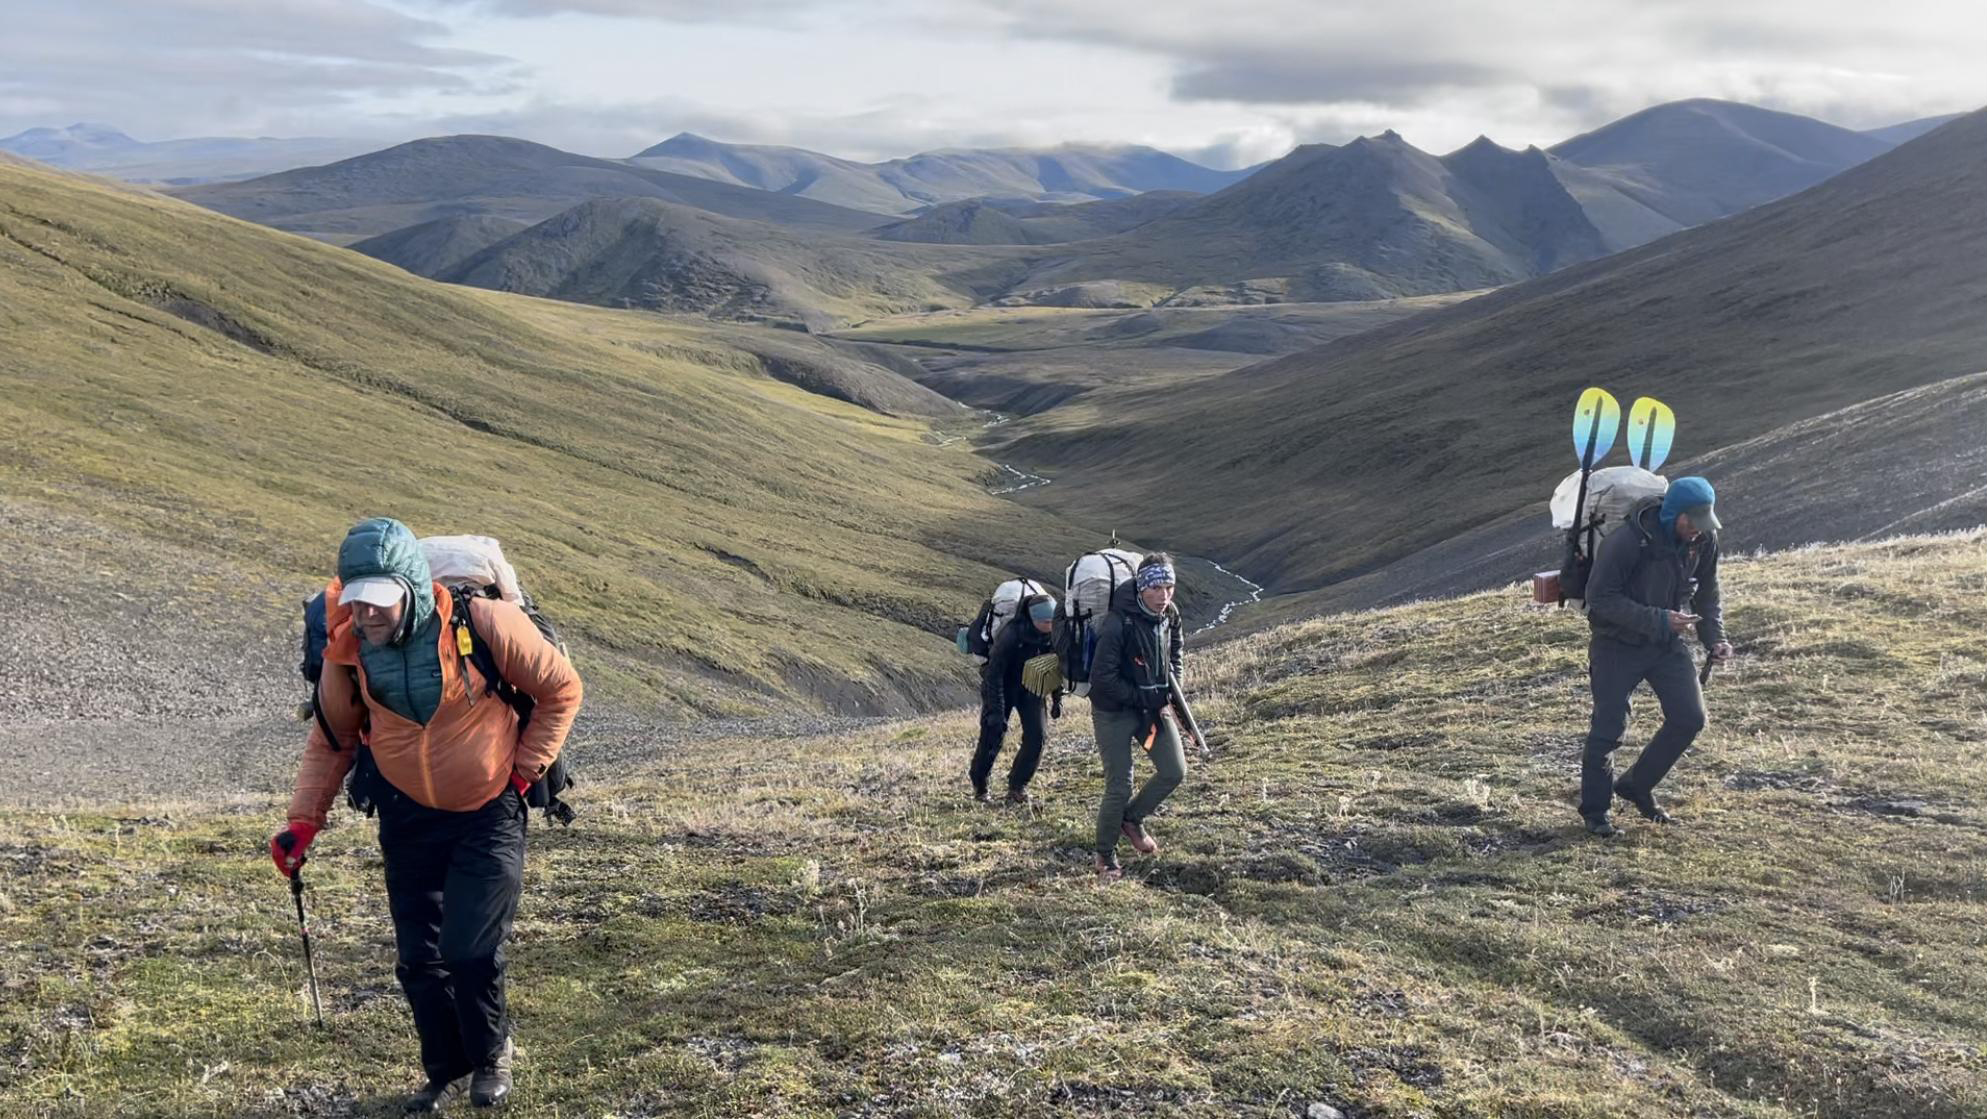
Following caribou and brown bear trails when possible, a small NASA-supported research team trekked 800 miles across Alaska’s Brooks Range last summer. With additional support from NSF, the Alaska Space Grant Program, and the Explorers Club/Discover, the research team is collecting extensive ecological field data that will be linked with satellite observations to better understand long-term changes in vegetation, including impacts of climate warming. The Arctic is warming nearly twice as rapidly as the rest of the planet and the impacts are becoming increasingly evident as glaciers melt, permafrost thaws, and tundra greens.
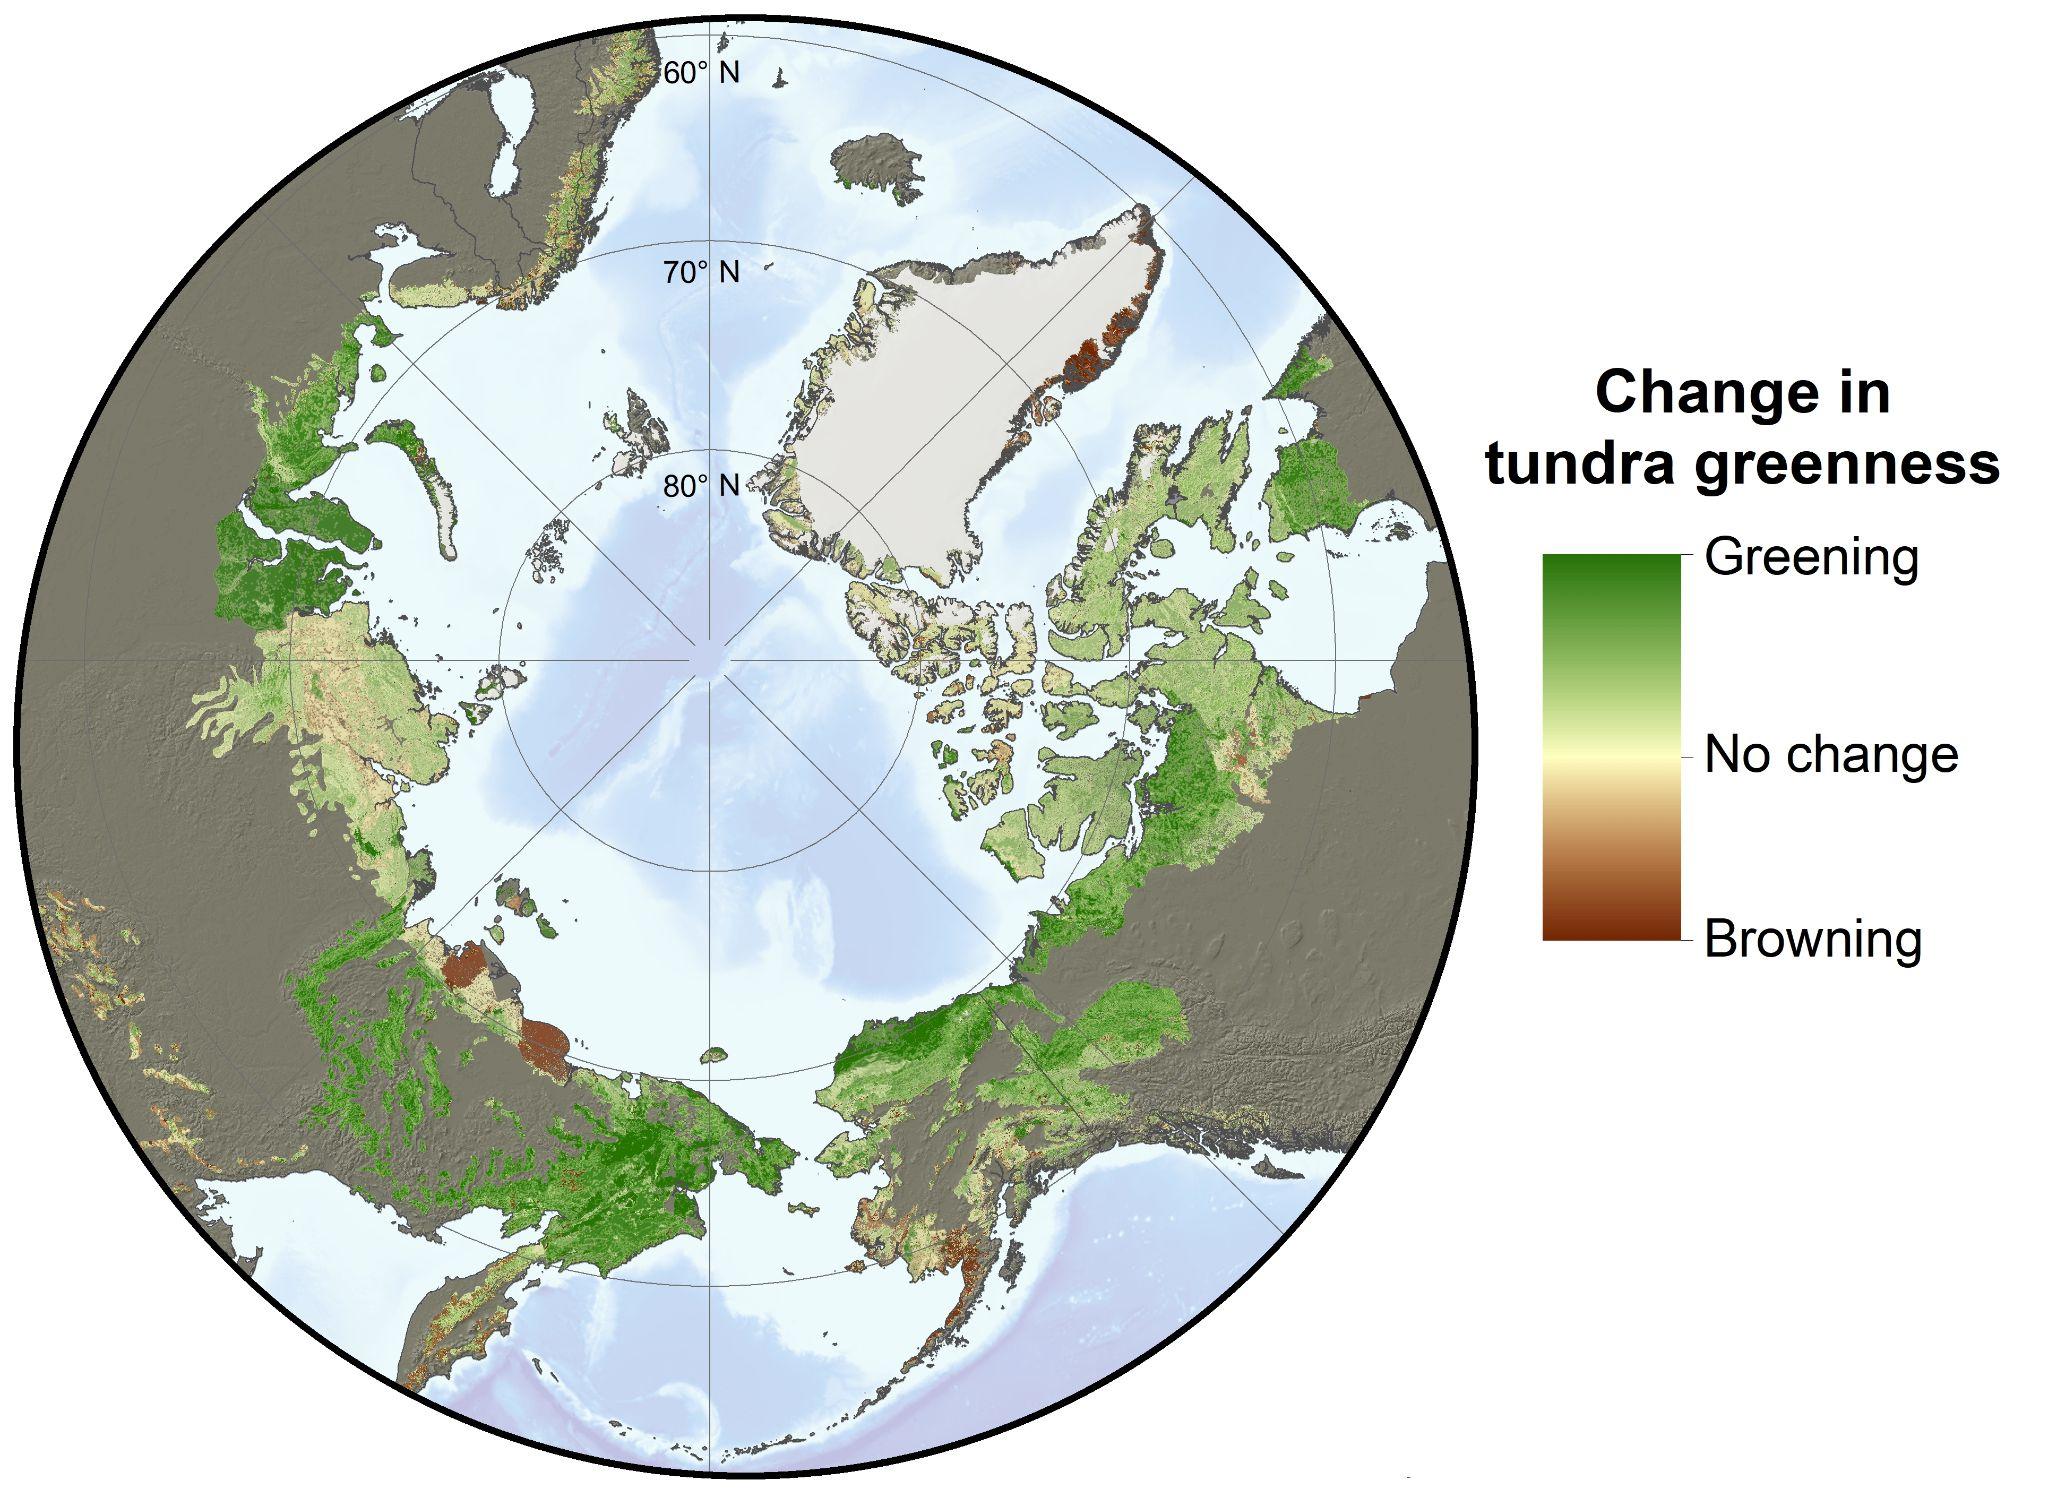
Earth-observing satellites have detected widespread increases in tundra greenness in the Arctic over the last four decades. The phenomena is caused, in part, by increases in vegetation growth as summers have become warmer and longer, and has been termed “Arctic greening.” On the other hand, satellite observations have also detected localized declines in tundra greenness attributed to surface flooding, extreme weather, and other disturbances. This has been termed “Arctic browning.” Satellite observations of greening and browning show that extensive changes are occurring in the Arctic, but much remains unclear about why specific regions have greened or browned in recent decades.
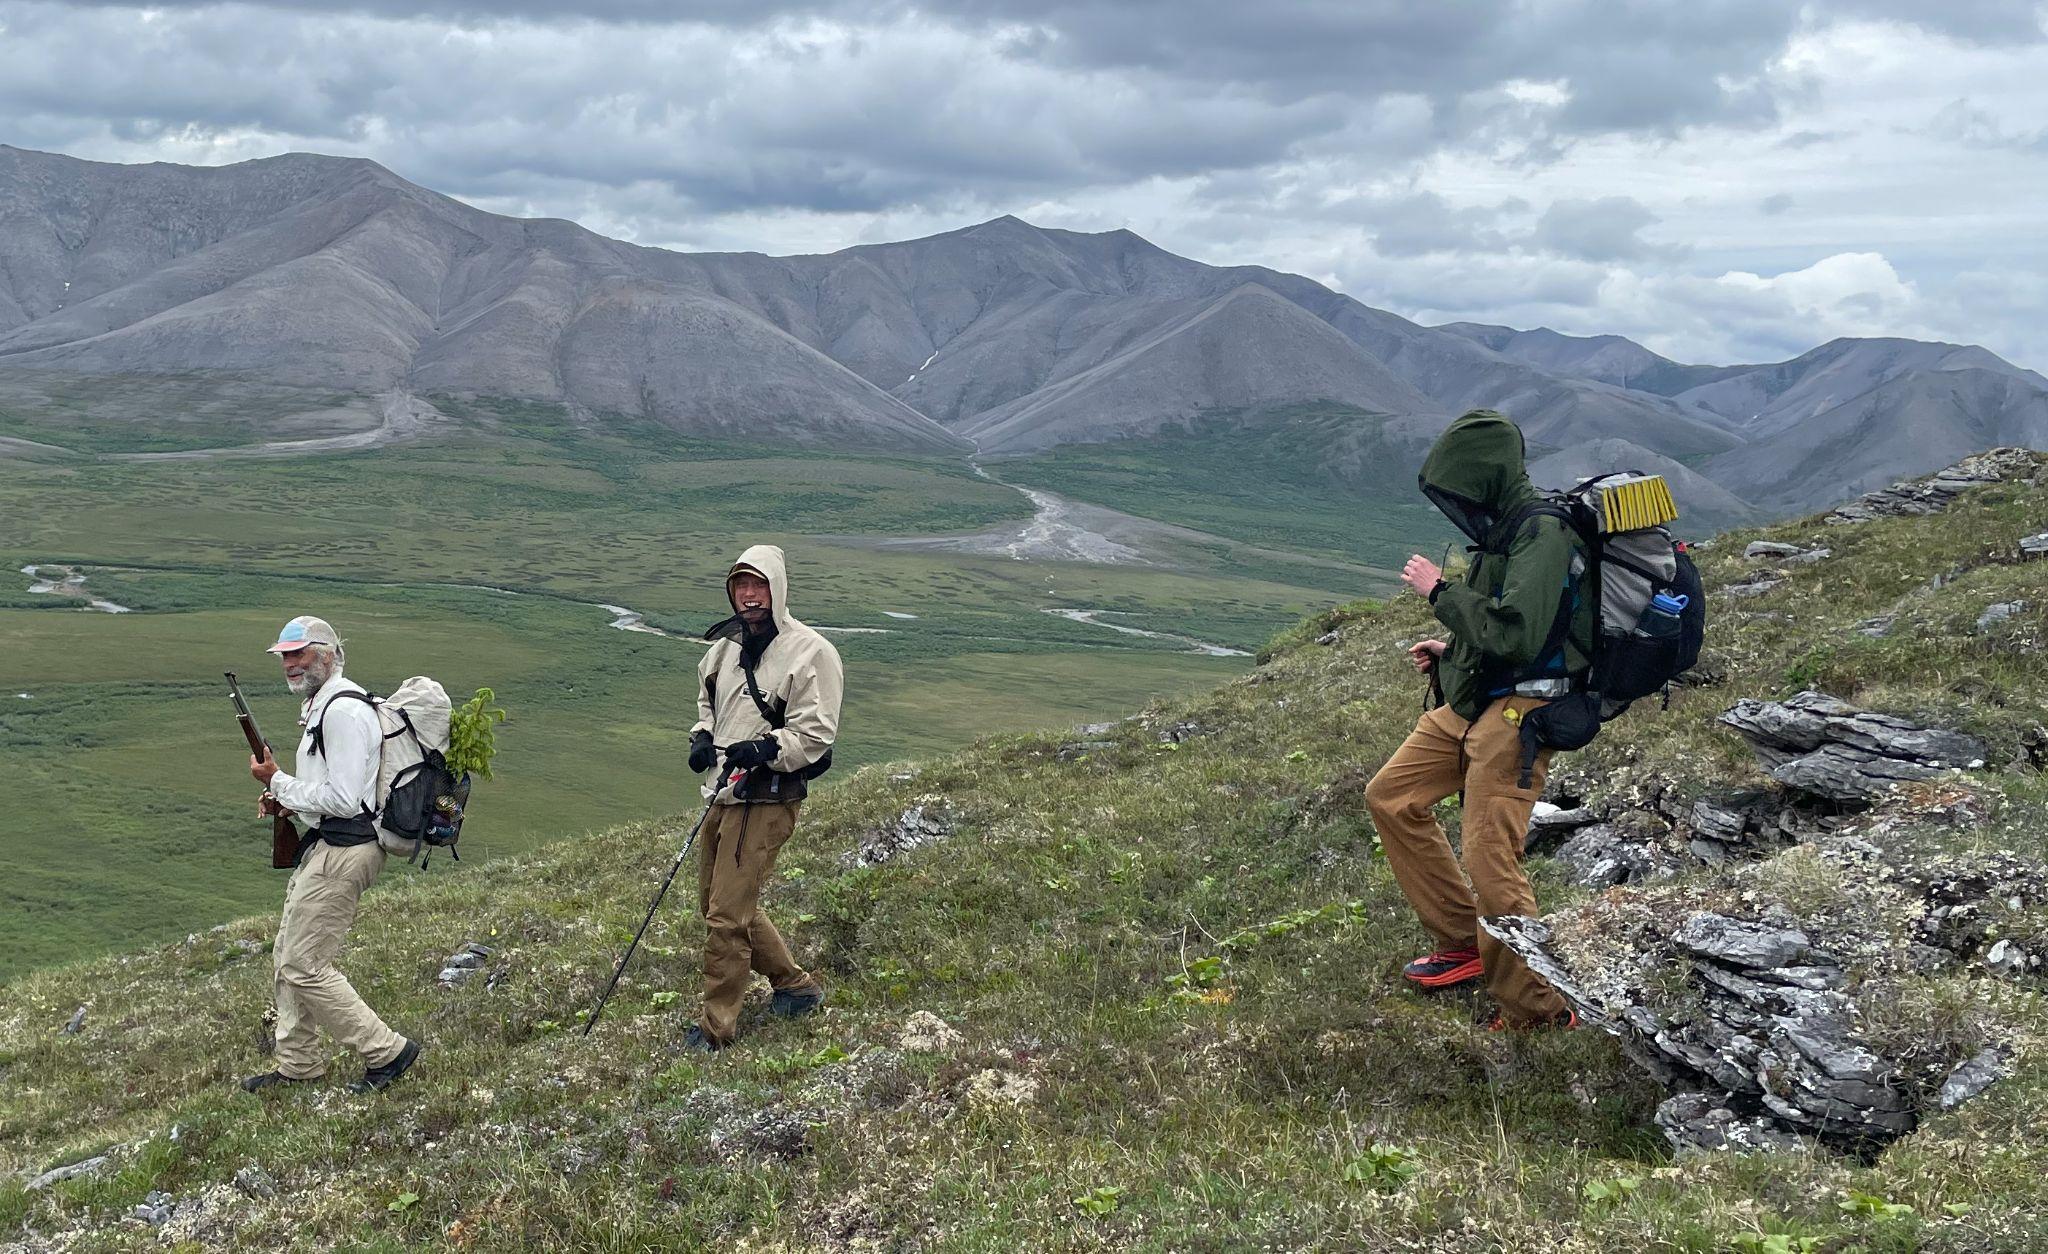
To better understand recent greening and browning in northern Alaska, Professor Roman Dial’s team from Alaska Pacific University (APU) has been collecting extensive ecological observations while trekking throughout Alaska’s Brooks Range. For nearly forty years, Dial has studied and traversed the Alaskan wilderness, including nearly 2,000 miles by foot and packraft throughout the Brooks Range during the last three field seasons. For 11 days last summer, Dial’s team was joined by Dr. Logan Berner and Patrick Burns who are research ecologists from Northern Arizona University (NAU) and members of NASA’s Arctic-Boreal Vulnerability Experiment (ABoVE). While Dial is an expert in field ecology and wilderness travel, Berner and Burns are experts in satellite remote sensing and ecological informatics. By combining their expertise, these researchers hope to shed light on the extent, nature, and causes of vegetation changes during recent decades in the Brooks Range.
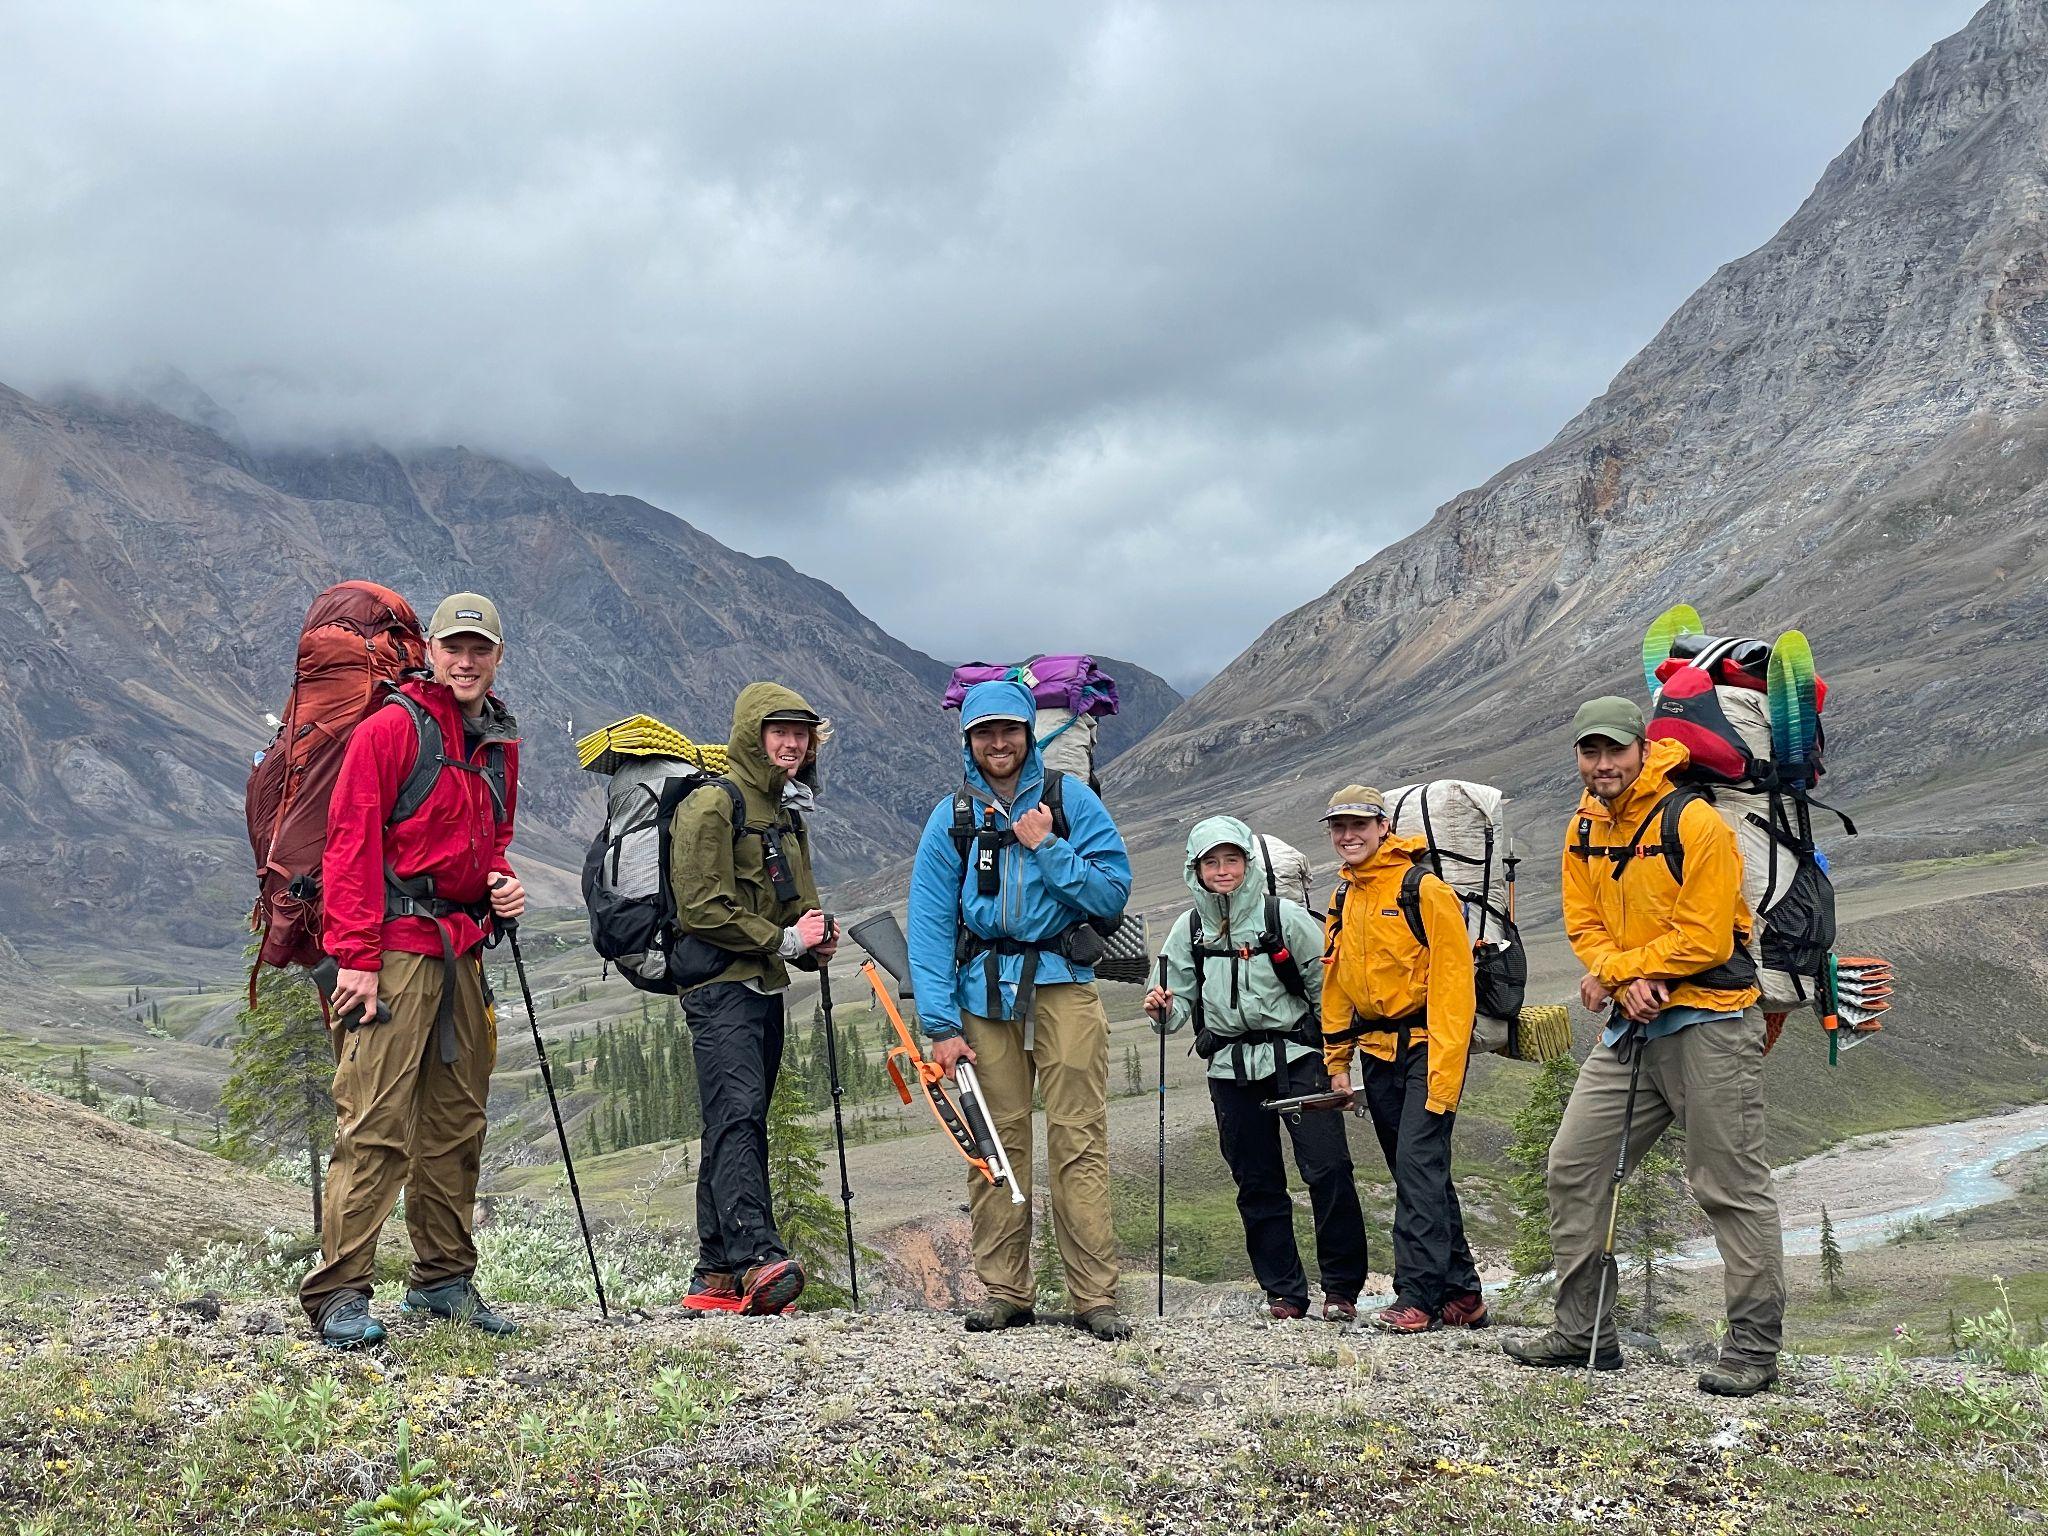
The Brooks Range forms a natural barrier that separates the boreal forest of Alaska’s interior from the arctic tundra of Alaska’s North Slope. This mountain range includes the largest complex of protected wilderness in the United States, including 21,000,000 acres among the Arctic National Wildlife Refuge, Noatak National Preserve, and Gates of the Arctic National Park. Berner and Burns joined Dial’s research team as they trekked from the northern edge of boreal forest into the Noatak Wilderness where trees give way to thickets of shrubs, wetlands, and barren rocky ridges. During the course of 11 rain-soaked days, the team followed caribou and brown bear trails through verdant valley bottoms and over cloud-choked mountain passes as they traversed about 80 miles from the Ambler River to the Cutler River. While trekking, the researchers collected ecological field data to be linked with measurements of vegetation greenness from NASA Earth-observing satellites.
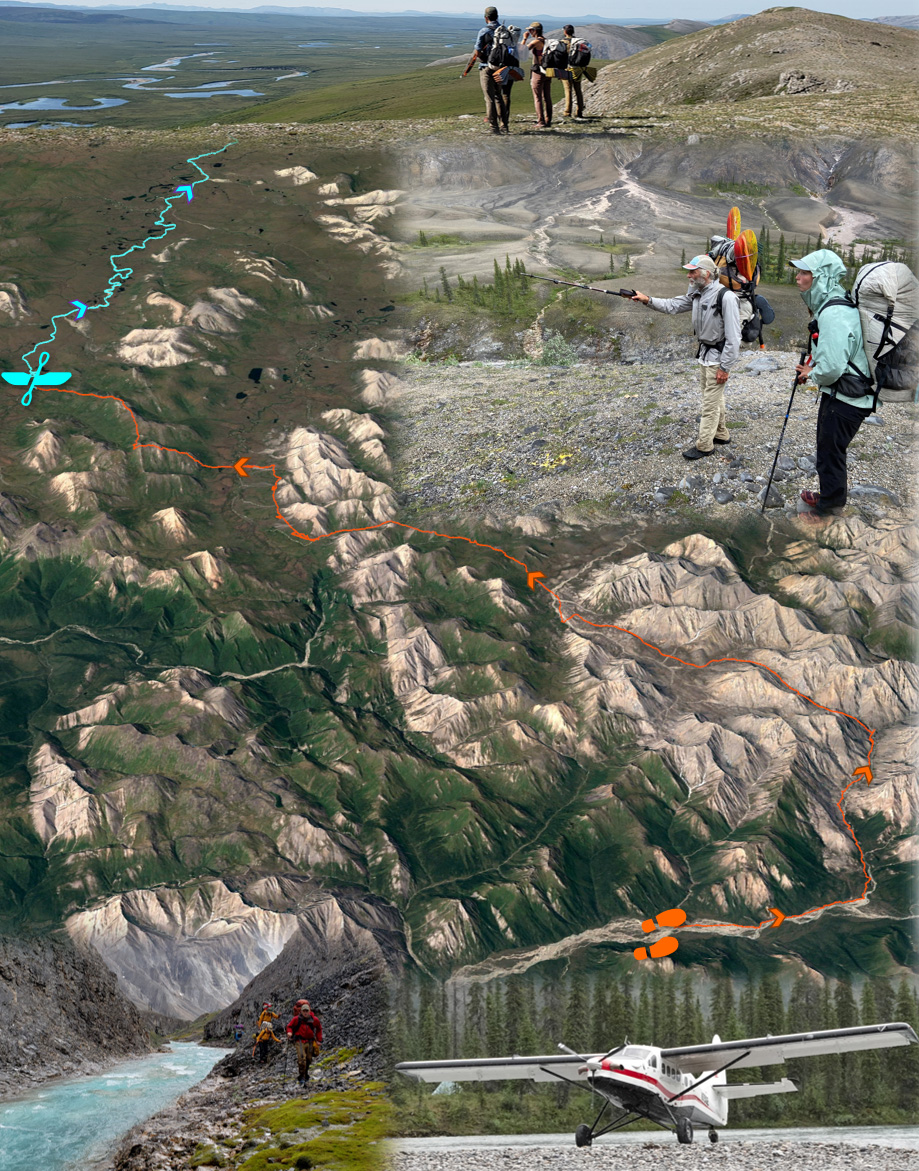
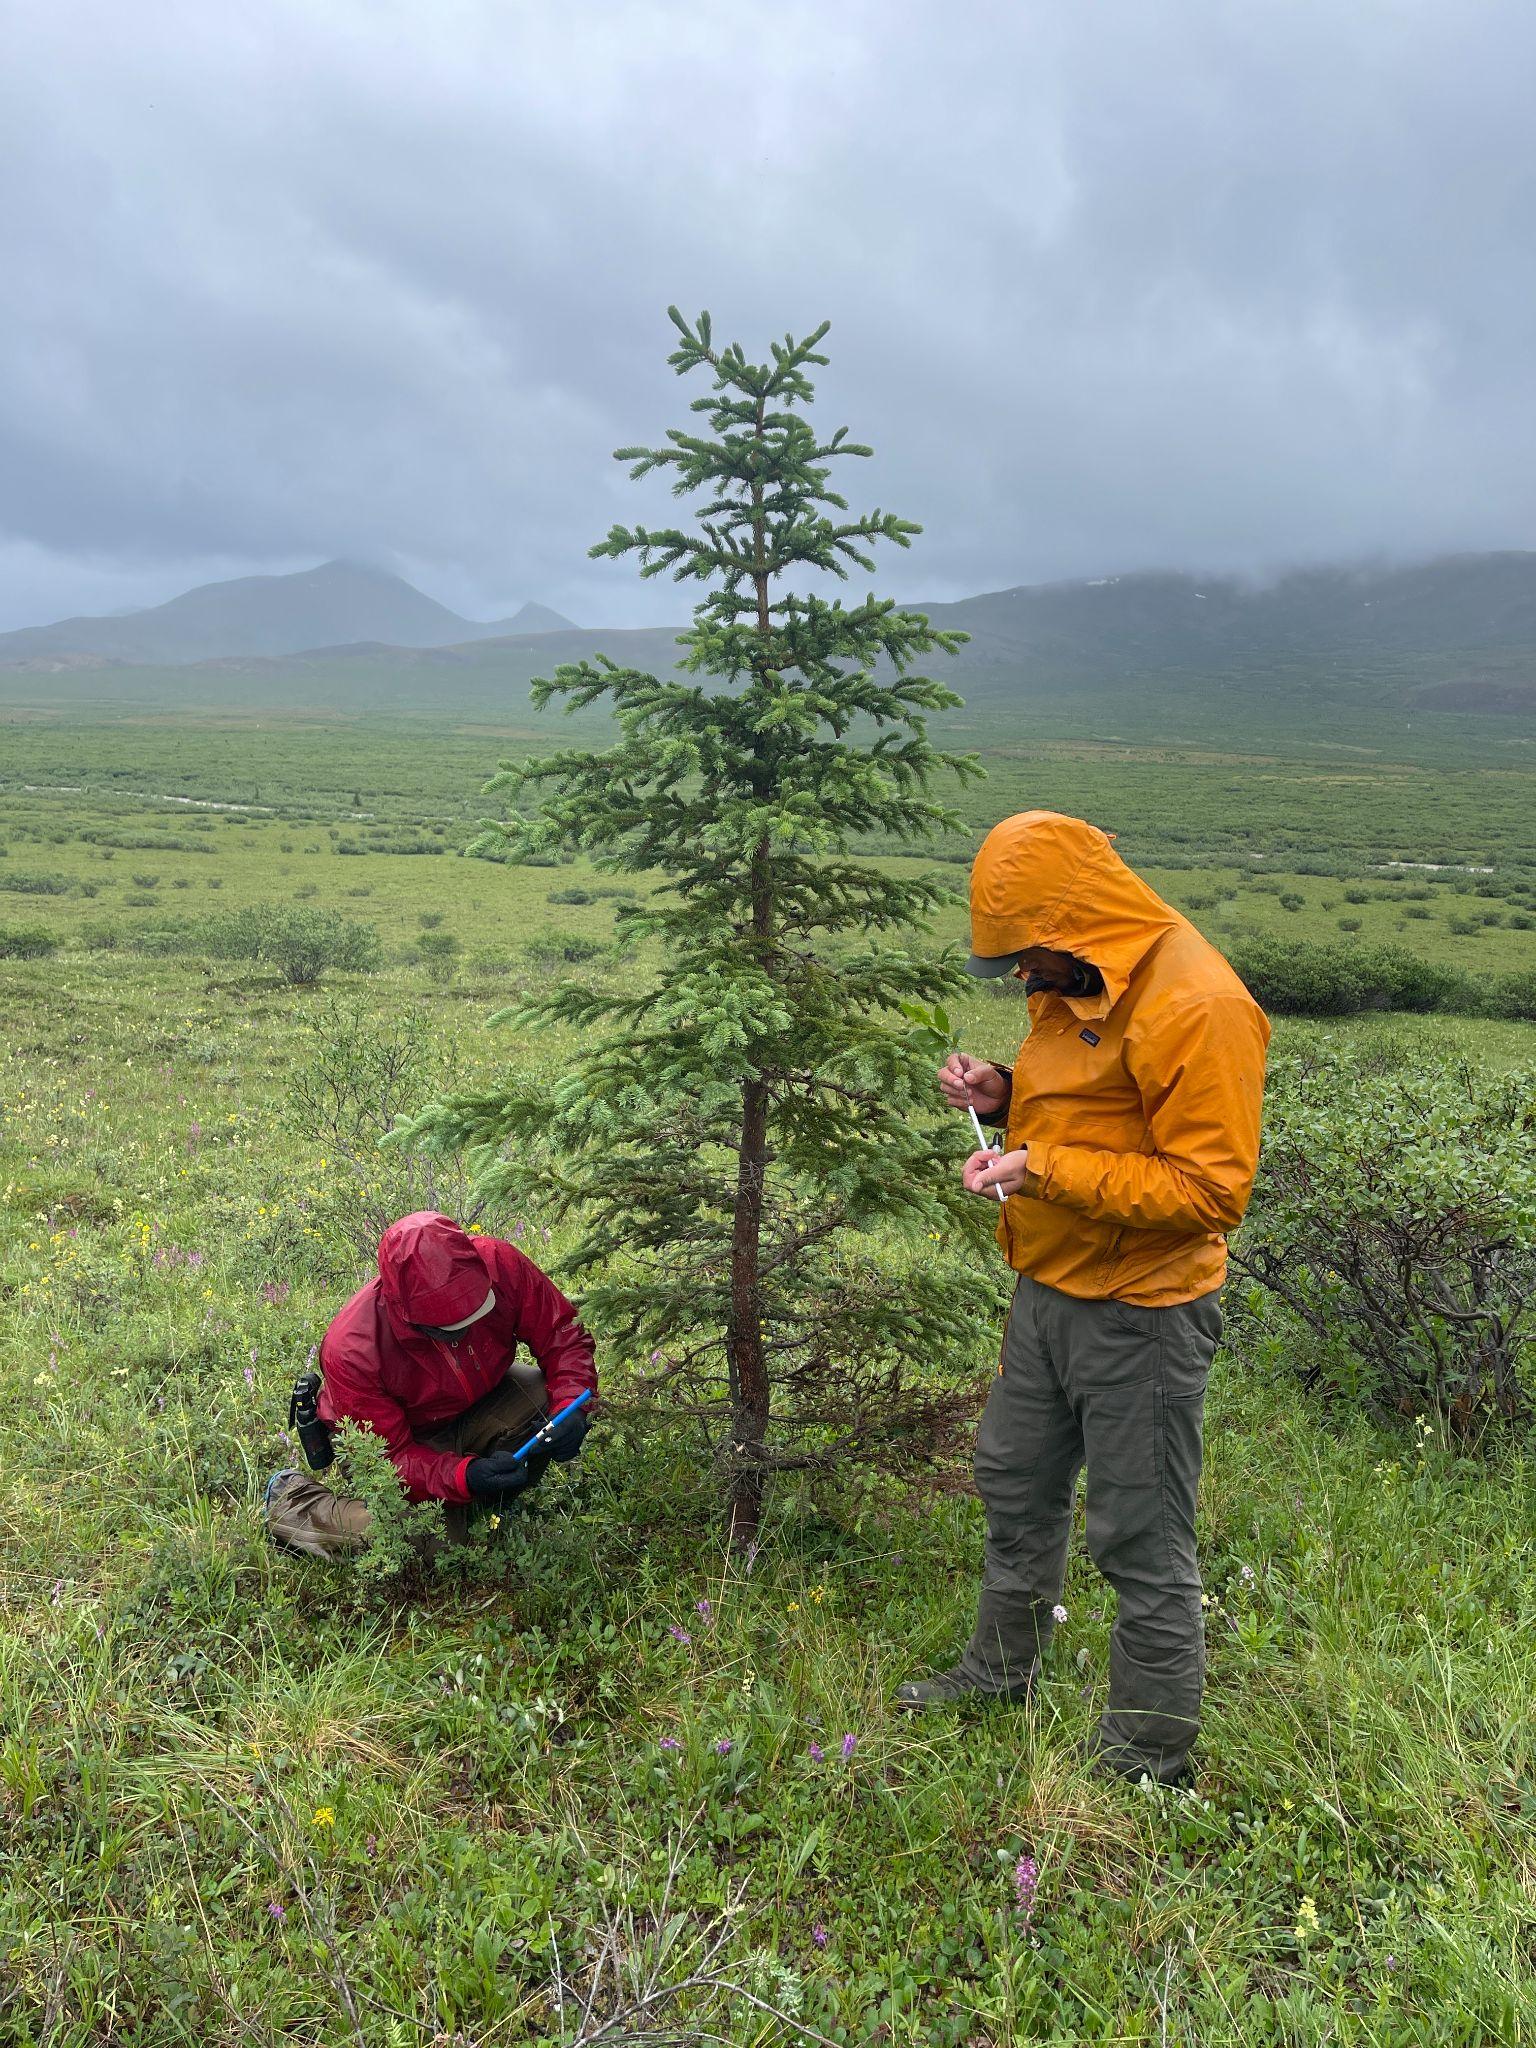
Ecological research often involves establishing field plots and then meticulously characterizing the composition and other attributes of the plant community in each field plot. Plot sampling provides valuable information, but the time consuming nature of the approach limits the spatial extent over which measurements can be made. Dial recognized that to better understand recent greening and browning, there is a need for more spatially extensive information on plant community composition than can be provided by field plots alone. He thus has pioneered an alternative approach that involves continuously documenting plant community composition and other attributes while trekking across the landscape. Termed “pixel-walking”, this approach harnesses the multifunctionality of smartphones to record and geolocate visual observations of vegetation composition and density for the overstory, midstory, and understory. While pixel-walking, researchers record a new observation every time they visually detect a change in vegetation composition or density at about a 30 meter spatial scale, corresponding to one pixel from the Landsat satellites. These spatially extensive field observations are thus collected with the explicit goal of being linked to decades of Landsat satellite observations.
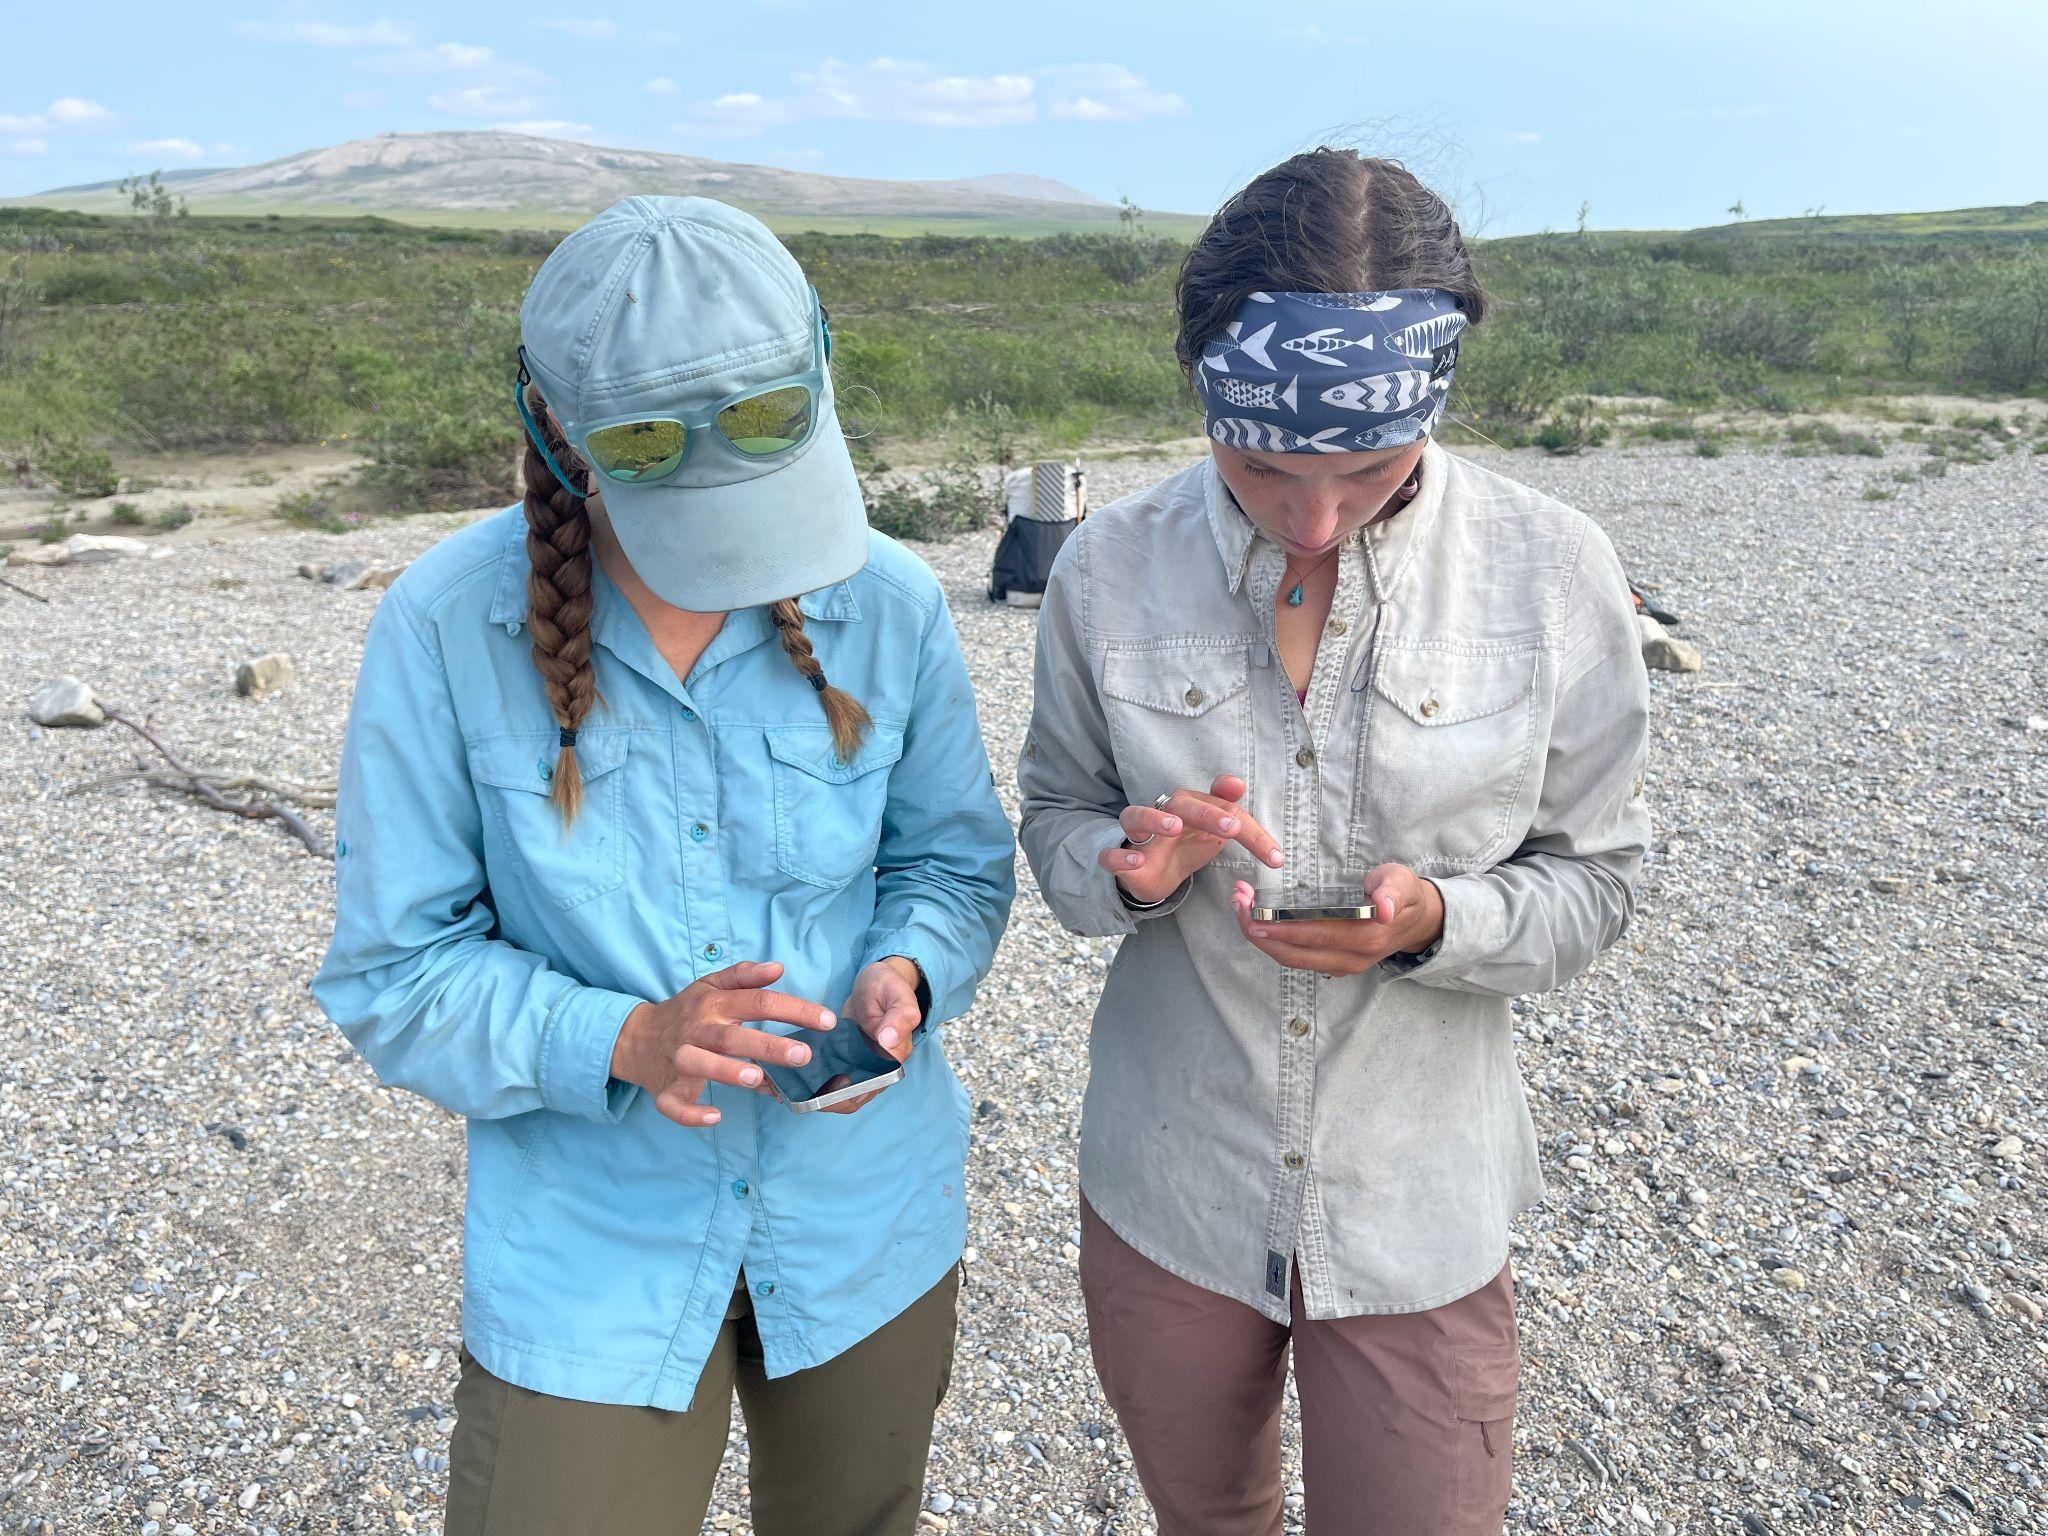
During summer 2021, Dial’s research team pixel-walked over 800 miles from east to west through the Brooks Range, collecting data on vegetation composition for about 100,000 Landsat pixels. Over the coming year, Dial’s team will work with Berner, Burns, and Professor Scott Goetz (ABoVE Science Team Lead) at NAU to link these extensive field data with several decades of Landsat satellite observations provided by NASA. This collaboration will help unravel the mysteries of Arctic greening and browning by shedding light on where, how, and why plant communities changed in recent decades. NASA’s Earth-observing satellites provide long-term observations that are crucial for monitoring and understanding ongoing environmental changes in the rapidly-warming Arctic, especially when complemented by field data collected across large regions.