
The CYGNSS constellation of 8 SmallSats was launched into low Earth orbit five years ago, on December 15, 2016. It began as a two year mission to study how well GPS signals reflected from the ocean surface can help us measure the winds in hurricanes and improve our ability to forecast them. Well, we’ve done that, but it turns out those reflected signals can tell us a lot more. One of the key reasons we’ve been able to learn about all the other applications is the extra time we’ve had on orbit, to make more measurements, study their sensitivity to other environmental parameters, construct new data products, and develop scientific uses for them. For that, I am sincerely grateful to the team of technicians, engineers and managers at the Southwest Research Institute and the Space Physics Research Lab who designed, built, tested and now operate the spacecraft, and to our partners at Surrey Satellite Technology Ltd. who designed and built the GPS receivers that take our science measurements. They were given a schedule, a budget and a two-year requirement for on-orbit operations. We got to orbit on time and under budget and here we are, five years later, still making high quality observations with each GPS receiver on every spacecraft at 100% duty cycle. I am also very grateful to NASA for the support they have provided and for their willingness to expand the scope of CYGNSS science as we discover new, exciting and impactful things we can do with our mission.
One of the great things about operating 8 spacecraft with a 100% duty cycle is the frequency with which you can sample tropical cyclones throughout their entire life cycle. This is illustrated in the following figure, which shows when and how well CYGNSS sampled every major storm (Cat 3 or greater) from 2018 to 2020.
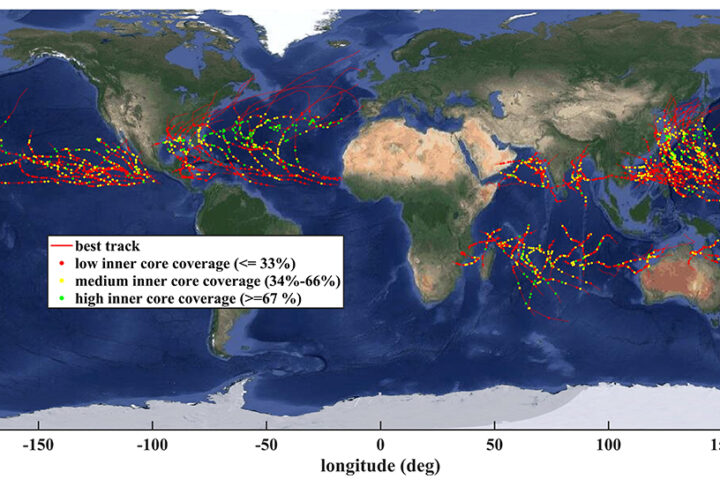
In the figure, the red lines are the track of each storm throughout its life cycle, the dots are when there was a CYGNSS overpass, and the color of the dot indicates how well we sampled the inner core of the storm. Every storm is sampled between one and three times a day, which helps monitor its development and capture sudden changes like rapid intensification. The impact our observations have on hurricane forecast skill is an active area of research by the CYGNSS science team. One recent example is work by researchers at the NOAA Hurricane Research Division that is highlighted in this figure.
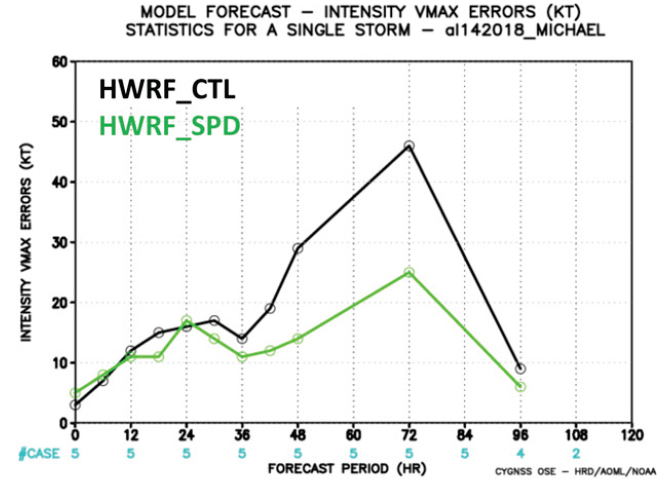
The figure shows the error in the operational forecast of maximum wind speed during Hurricane Michael’s rapid intensification, which occurred between 36 and 72 hours into the forecast (black line), and the reduced error that would have been present had CYGNSS observations been included (green line). The peak error is reduced from about 45 to 25 knots, or cut almost in half.
CYGNSS spends much less than 0.1% of its time over hurricanes but its radar receivers operate continuously. This enables many other uses of the data. Data products over ocean include near-surface wind speed and, from it, sea-to-air fluxes of latent and sensible heat. One new data product released in 2021 is the concentration of ocean microplastics, derived from the suppression of ocean surface roughness by surfactants acting as tracers of the microplastics. Time lapse microplastic concentration maps of Yangtze River outflow are shown in the following figure.
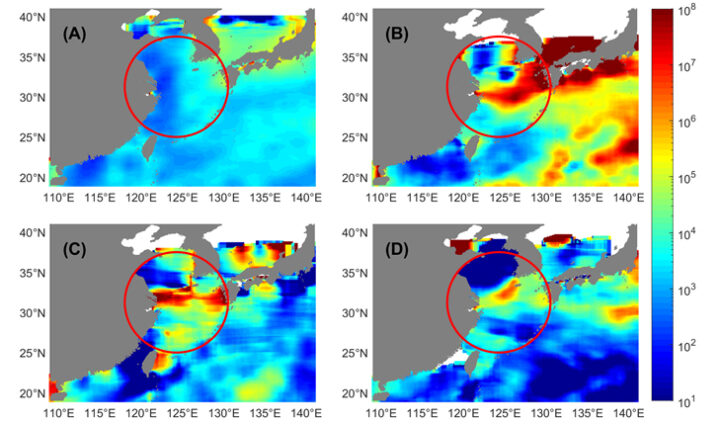
The upper left panel (A) in the figure shows the annual average microplastic concentration in the East China Sea near the mouth of the Yangtze. There is no obvious outflow signal. Panels (B)-(D) show the concentration averaged over individual weeks of the year in which there is a prominent outflow plume.
CYGNSS operates over both ocean and land, and the land reflections contain two important pieces of information. When standing water is not present in the measurement footprint to any significant degree, it is possible to retrieve near-surface soil moisture content. We can measure the global distribution of soil moisture several time per day and those data have been shown to significantly improve global land surface hydrology models <https://doi.org/10.1088/1748-9326/ac0ddf>. When inland water bodies are present in the footprint, reflections from them tend to dominate the measurements. CYGNSS is then able to effectively map the extent of the water. One application of this capability is shown in the following figure of flood inundation across the island of Hispaniola as imaged by CYGNSS after Hurricane Isaias landfall.
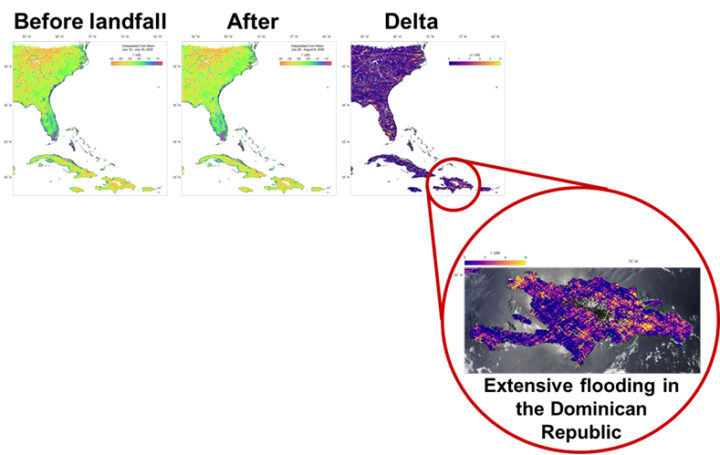
The “Delta” map shows the change in surface reflectivity from before to after landfall. The extensive flooding that occurred in the capital city of Santo Domingo is highlighted by bright yellow (high delta) areas.
Inland water body maps produced by CYGNSS have two distinct properties. One, which derives from the large number of satellites in the constellation, is their ability to be updated often. This allows them to capture sudden changes like flood events. The other, which derives from the use of GPS signals that can penetrate through clouds, rain and vegetation canopies, is their ability to map wetland extent in heavily vegetated regions. One exciting new application of this capability is improved prediction of methane emission from wetlands. The accuracy of a global wetland methane emission model was evaluated when initialized by three different water masks. The results are shown in the following figure.
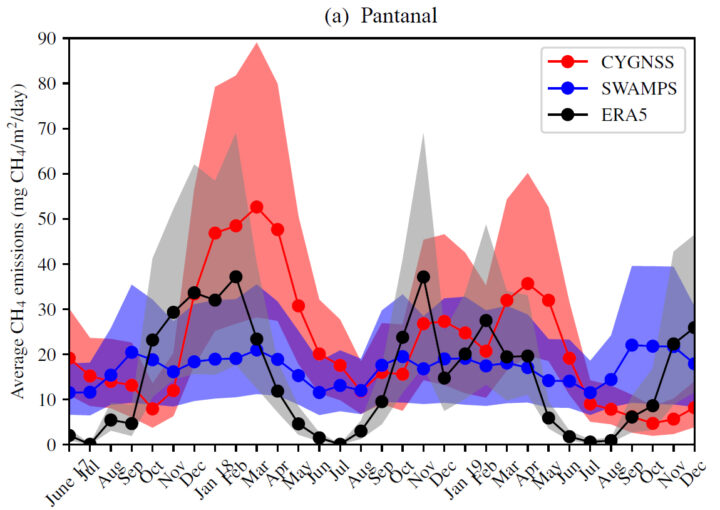
If a static water mask derived from Vis/IR imagers is used (SWAMPS blue curve in figure), seasonal variations in water extent are not represented and anomalous conditions associated with clouds and vegetation are misrepresented. If the model uses a dynamic rainfall map to better account for seasonal effects (ERA5 black curve), complications in the relationship between rainfall and wetland inundation are neglected. The best results are had using dynamic maps of wetland extent derived from CYGNSS observations (CYGNSS red curve) because they are based on direct, time varying measurements of the inundation that are insensitive to clouds and vegetation.
The first five years of on-orbit operation have produced valuable ocean wind observations for improved hurricane forecasting and have uncovered many new applications of the data away from hurricanes. We will continue to refine our measurements of winds, soil moisture and inland water bodies. And who knows what other new sensitivities we will uncover in the next five years?