Hi there!
Our team got out of the field a few days ago after a successful field campaign with a lot of great data to analyze! For the coming blog posts, we will be sharing with you the different kind of measurements we made during our stay at the ice camp and but also describe the wide range of instrumentation being used.
For this blog entry, I am going to talk about the surveys we did with a ground-penetrating radar (also known by its acronym: GPR) and the shallow ice cores we collected to help calibrating the radar data by identify the depths of subsurface features. The main of goal of this radar data is to quantify spatial changes in the weathering crust. This crust corresponds to a relatively thin layer (1-2 meters thick) of ice and water starting from the ice surface. It is strongly influenced and shaped by weather variations (sunny days vs. cloudy days, air temperature, melt intensity…)
But before going in those details, here is a photo of our camp in relation to the supra-glacial lake and river to get you situated.
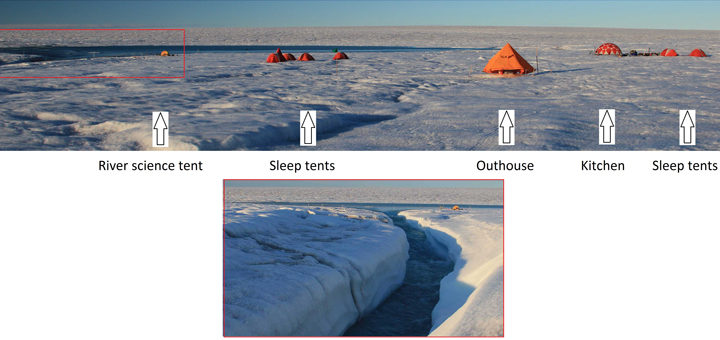
General view of our ice camp with a close up on Rio Behar at the bottom of the photo. Photo by Clem Miege.
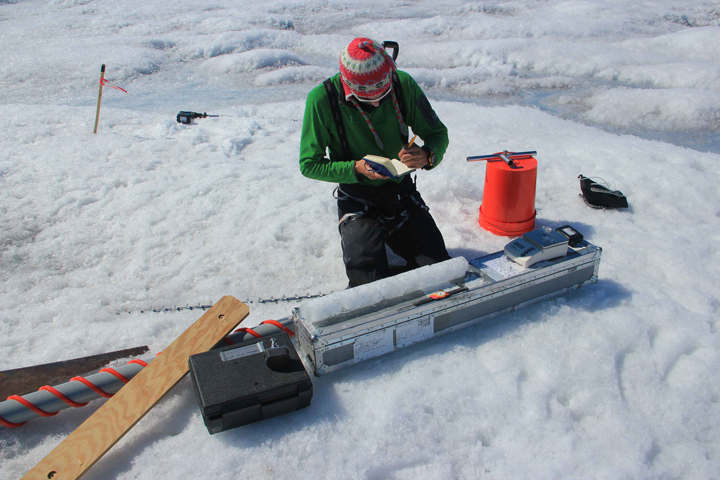
For the ground-penetrating radar measurements, we brought to the ice camp a radar designed by GSSI, a company specialized into geophysical measurements. The radar basically acts as our eyes to explore the features located in the ice, below the surface. With a 400 MHz antenna, we are limited to look at the first 50m of the ice thickness with a vertical resolution of about 10-20 cm. Any changes in the ice density, stratigraphy or changes in its dielectric properties create internal reflections. We then follow and trace those continuous reflections (also called internal layers) and look at their spatial distribution. In addition, the presence of water within the ice generates a sharp and bright radar reflection because of the significant dielectric contrast between the solid and the liquid phase of the water molecule.
The radar system is made of an antenna and a control unit. It is relatively light and portable, making it possible to use with only one person. To geolocate the radar scans in relation to the ice surface, we carry a precise GPS.
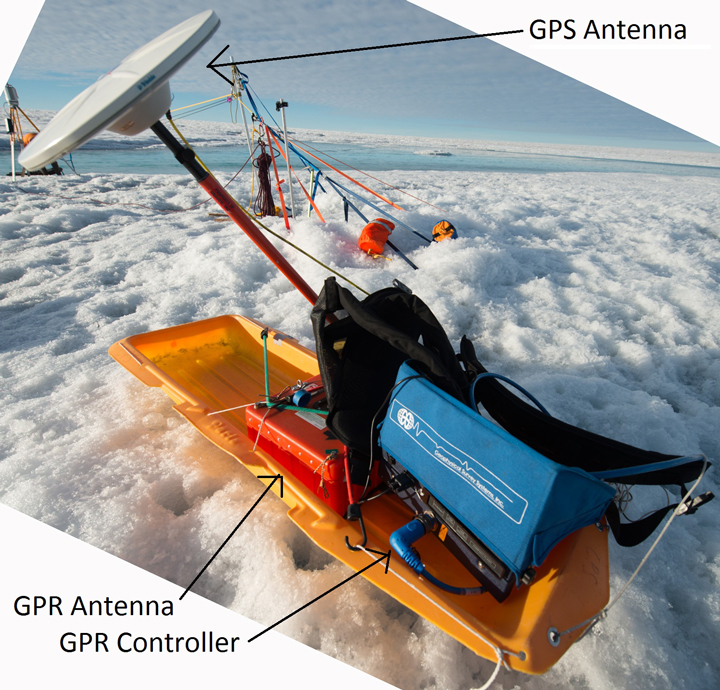
The radar setup with the GPS antenna. Photo by Charlie Kershner.
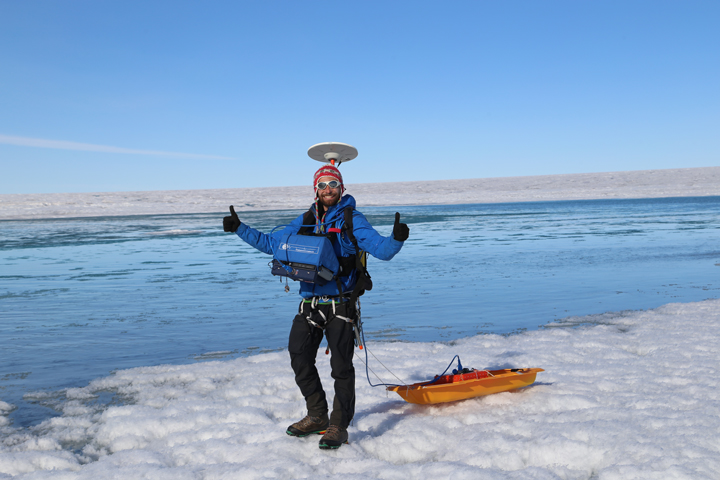
The radar in action. Photo by Lincoln Pitcher.
In addition to the GPR work, we have been drilling 10 boreholes from the ice surface. Big thanks to Bob Hawley at Dartmouth for letting us borrow his coring drill. We extracted 75-mm-width ice cores in the top part of the ice column (1 to 2 meters depth) which reveal the ice stratigraphy and densities below the surface. We also measured the height of the water in the borehole (if any) which will be helpful to establish an accurate depth profile for the radar data.
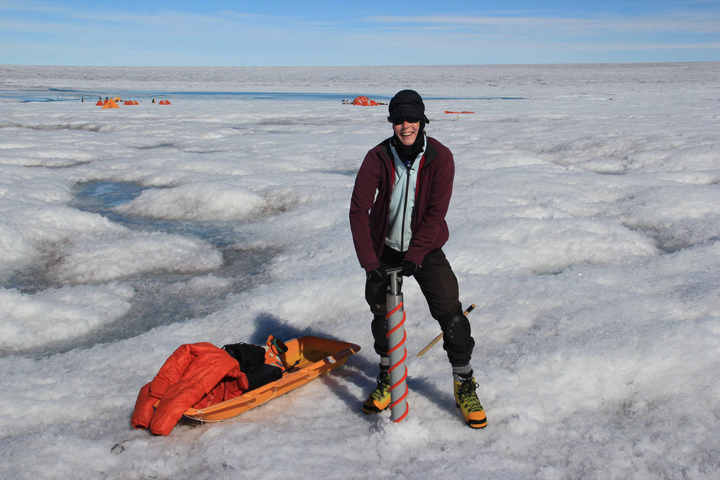
Asa is operating the coring drill from the surface to retrieve ice cores. Photo by Clem Miege.
Clem is processing the first meter of the ice cores, logging mainly stratigraphy and densities. Photo by Matt Cooper.
Back at the office, we will have quite a bit of work to process all the data collected and connect the ice-core data with the radar data. This dataset will become very helpful to understand the formation of the weathering crust as well as the water being stored in it.
That is it for this post! Thanks for following us and there will be more blog entries soon so you can learn about the other instruments deployed on the ice.
All the best,
Clem
In the last two weeks, we’ve wrapped up the test flights and major preparations for NASA’s ATom mission. ATom is an airborne science experiment aboard the DC-8 flying laboratory that will study the most remote parts of the Earth’s atmosphere. We want to learn how much pollution reaches areas most people would consider untouched by human influence, and to understand how pollutant chemicals in these distant regions affect things we care about.
I’m Steve Wofsy, an atmospheric scientist at Harvard University and ATom’s Principal Investigator. I couldn’t be more excited to get underway. ATom is the realization of an idea to sample cross-sections of the world’s atmosphere that I have dreamed about for more than 20 years. The idea for ATom started in the 1990’s, when I participated in a series of aircraft missions that characterized the chemistry of the Earth’s stratosphere, spanning from the Arctic to the Antarctic. Our images of global chemical changes were immensely powerful in helping us to understand depletion of stratospheric ozone. Together with my colleagues in those stratospheric missions, Paul Newman of NASA’s Goddard Space Flight Center and Michael Prather of University of California, we started to think about how we might undertake such a study in the troposphere, where we all live.
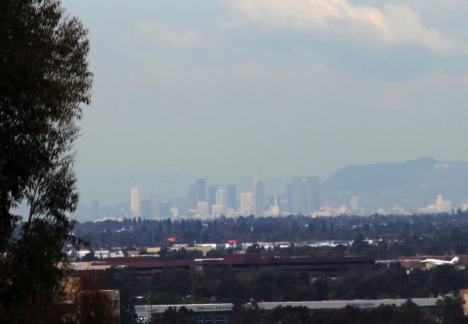
The Los Angeles skyline is hazy with smog generated from air pollutants emitted by cars. The air pollution doesn’t stay in the city, however, but will eventually travel to other parts of the world. Credit: Michael Prather
The chemistry of the atmosphere is very important for human beings and for all creatures on Earth. In the ATom study we want to understand air pollution and climate change. Air pollution has immediate and long-term consequences for human health, agriculture, and ecosystems. Climate change in the era of fossil fuel emissions and industry is being driven mostly by the gases we pump into the atmosphere.
To understand the chemistry of the atmosphere, we have to be able to measure many different chemicals in tiny amounts. The only way to do that is by going out in the atmosphere itself. We can’t make the measurements only at the ground, because the atmosphere extends far above the surface. Some measurements can be made using satellites that look down into the atmosphere, but many measurements must be made directly in the air, because the concentrations of many important gases are far too small, and the patterns we need to observe are too fine, to be measured from space.
Scientists have been using airplanes to sample the atmosphere since the 1940’s, when Britain’s Royal Air Force flew missions to understand the occurrence of contrails, which are simply water vapor that condenses behind an aircraft in certain atmospheric conditions. Today’s modern flying laboratories take sophisticated instrumentation throughout the atmosphere, in locations remote and nearby, polluted and nearly unpolluted. It is a very exacting, challenging endeavor, but one that pays off for both our understanding of the planet and for protecting it and the people on the ground.
Some of the most daring measurements of atmospheric chemistry were made in the stratospheric missions I mentioned before, between 1985 and 2000. We used the high-flying ER-2 aircraft carrying extremely sensitive instruments to measure very reactive “free radical” chemical species – in particular the chemicals responsible for the hole in stratospheric ozone that was forming each year over Antarctica. The measurements cannot be done by capturing air and taking it back to the lab – these chemicals are constantly generated by sunlight, and then they react and vanish in seconds, minutes, or hours.
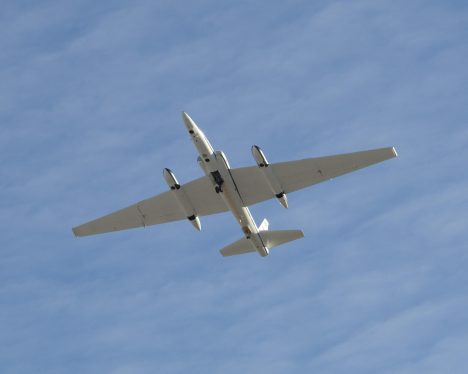
NASA’s ER-2 aircraft takes scientific measurements from 65,000 feet. It was instrumental in understanding the depletion of stratospheric ozone. Credit: NASA Armstrong Flight Research Center
The insights scientists were able to gain because of those data sets led to huge societal changes, including the Montreal Protocol, the international treaty banning a whole class of industrial chemicals that were harming Earth. The amazing global consensus to ban these chemicals could not have happened without the ER-2 aircraft measurements.
Those data did not come easily. Scientists had to develop a whole new class of instruments that had to operate autonomously, since only the pilot is on board the ER-2. The plane had to go to the limit of its capability to sample in very inhospitable locations. Pilots, engineers and scientists worked very closely together to ensure safe execution of these flights.
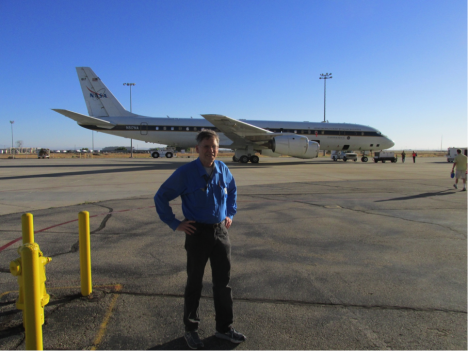
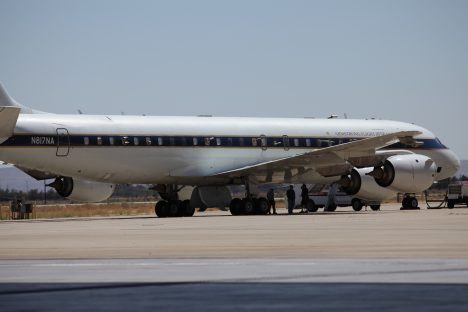
ATom’s Principal Investigator Steve Wofsy in front of NASA’s DC-8. Credit: Tom Ryerson
The equipment on board the DC-8 in ATom likewise has to be very carefully engineered to be both safe and exquisitely sensitive and accurate. Because the chemistry of the troposphere is much more complex than that of the stratosphere, the number of independent instruments has multiplied to 22. The crew has to manage this very complex payload, with many possible hazards. The plane will often be flying very low to the ocean surface, and it will cross some of the most remote and inhospitable areas on the planet. Many of the instruments in ATom have their heritage in those flights of the ER-2.
The preparation of the DC-8 and the science payload has been meticulous. The planning of flights and logistics around the globe for our ten stopovers was undertaken to meet multiple constraints of safety, cost, and science objectives. We don’t know yet what we’ll see, but it will be the most detailed slice of the atmosphere we’ve ever measured. We hope to find out how human beings are changing the global atmosphere, what are the effects on climate, and what these changes may mean for the health and welfare of human beings and global ecosystems. We are confident in our readiness, eager to head out on our adventure, and ready to report back.
I’m Christina Williamson, a postdoctoral scientist at CIRES CU-Boulder/NOAA-ESRL interested in Atmospheric Aerosols, the small particles in the air that cause haze, and on which clouds are formed.
I’m working with a few colleagues from NOAA to take a suite of instruments on NASA’s ATom mission that will measure the number and size of particles in the air as we fly around the world. We’re interested in this because aerosols in the atmosphere affect how much of the energy from the sun is absorbed and how much is reflected back to space by clouds and by the aerosols themselves.
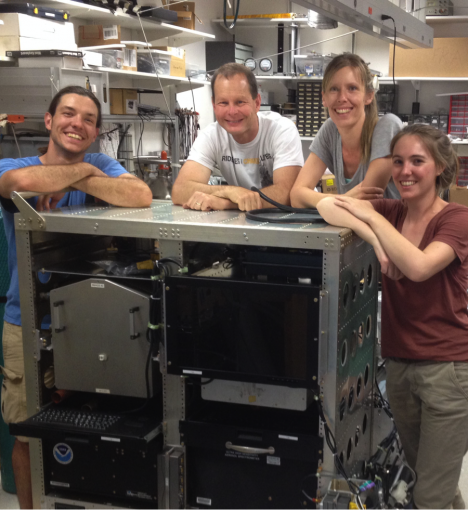
My research team in our lab at NOAA ESRL setting up our flight rack for ATom. From left to right, Frank Erdesz, engineer with CIRES/NOAA, Charles Brock, Principal Investigator from NOAA, Agneiszka Kupc, research scientist with NOAA/University of Vienna, and Christina Williamson, research scientist with CIRES/NOAA. (Credit: Nick Wagner)
Over the past few weeks we’ve brought our instruments down from NOAA’s Earth-Science Research Laboratory in Boulder, Colorado to NASA Armstrong in California, integrated them onto the plane and tested how they perform while the plane is flying. We’re running five instruments, measuring aerosols in different size ranges, which, after modifying to optimize performance for ATom conditions, and testing in the lab, we put together in a flight rack. Everything we fly is secured in the rack with aircraft grade hardware so that it cannot shake loose or be propelled out during flight, and the rack is then screwed to the seat tracks of the plane.
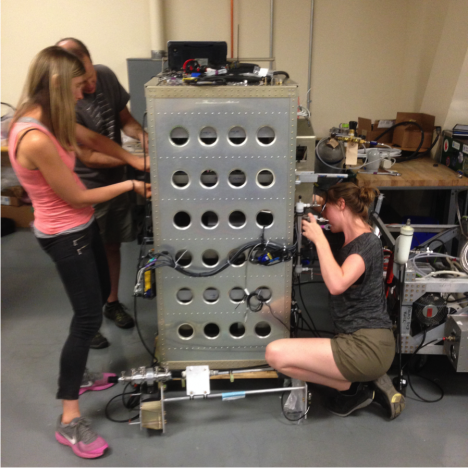
Assembling the instrument rack in the lab at NASA Armstrong. From left to right, Charles Brock, Principal Investigator from NOAA, Agneiszka Kupc, research scientist with NOAA/University of Vienna, and Christina Williamson, research scientist with CIRES/NOAA. (Credit: Maximilian Dollner)
We sample aerosols in flight by pulling air in through an inlet tube that is mounted on a plate where the window would normally be. We plumbed this to our instruments taking care to route the flow to minimize the number of aerosol particles that get lost by sticking to the walls of the tubing on their way from outside to the instruments.
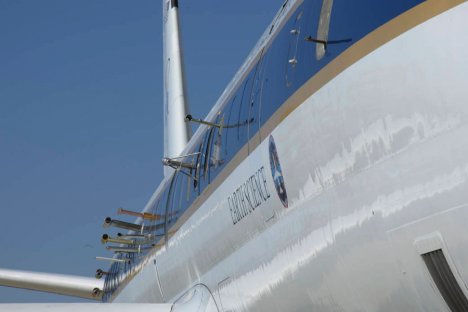
Instrument inlets (where air is pulled into the instruments inside for sampling) on the NASA DC-8. Ours is the curvy one third from the right. (Credit: NASA Armstrong)
On the plane we tested the instrument set-up while it was still in the hangar, checking for leaks and that particles were being transmitted well, as well as other things like electrical connections and communications. I ran some calibrations to check that nothing had shifted in the instrument performance in the move from the lab. We also spend a good deal of time neatly tying down all of the cabling and plumbing, securing it to the rack and the body of the plane and making sure everything in the rack will hold fast during even the most turbulent of flights.
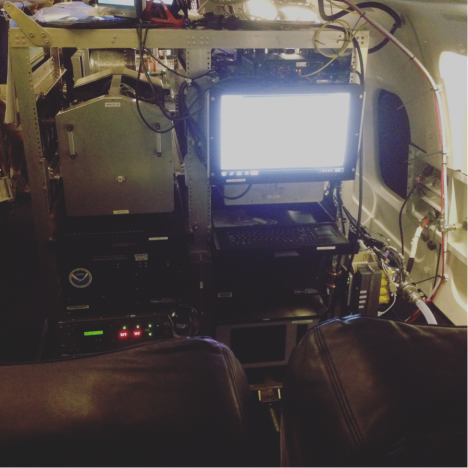
The AMP (aerosol microphysical processes) rack installed on the DC8. We run all five instruments from this monitor, and check the data as it comes in during the flights. (Credit: Christina Williamson)
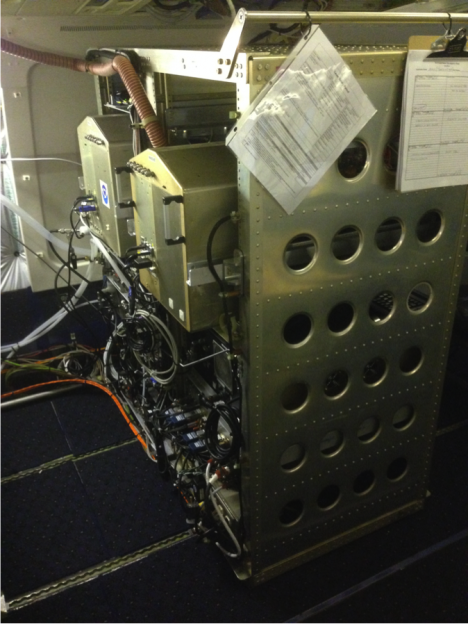
The AMP (aerosol microphysical processes) rack being integrated on the DC8. You can see there’s some work to be done neatening and tying down the cabling. The instruments on the top are two Nucleation Mode Aerosol Size Spectrometers (NMASSs), which measure aerosol size distributions between 3 and 60nm. Lower in the rack are two Ultra High Sensitivity Aerosol Spectrometers (UHSASs), which measure particles between 60 and 800nm, and a Laser Aerosol Spectrometer, getting the size distribution from 90nm up to 7.5μm. (Credit: Christina Williamson)
All this involved many days working on the plane in the hangar. Palmdale, where the Armstrong base is located, can get above 40C (104F) this time of year. The air-conditioning from the plane’s ground unit cannot quite compete with combination of heat from outside and from electrical scientific equipment operating inside (not to mention a lot of busy scientists and crew), so it gets pretty hot. We’re working often in the cramped spaces between two instruments, or a rack and the wall, or laying cabling and plumbing along the floor, so it’s hot, awkward and dirty work, but the excitement of working on the plane and seeing everything come together for the flights more than compensates for that.
The crew conducted a shakedown flight without scientists just to check that everything was integrated safely, and then we went up for out first test flight on July 12. This was my first time flying in a research plane. Some more experienced scientists delighted in telling me horror-stories of maneuvers and low-flying turbulence making people ill before we took off. I was nervous, mainly about how my instruments would perform, as there are controls for things like pressure and flow that I can’t test on the ground, and also because I didn’t want to embarrass myself by getting ill on the test flight.
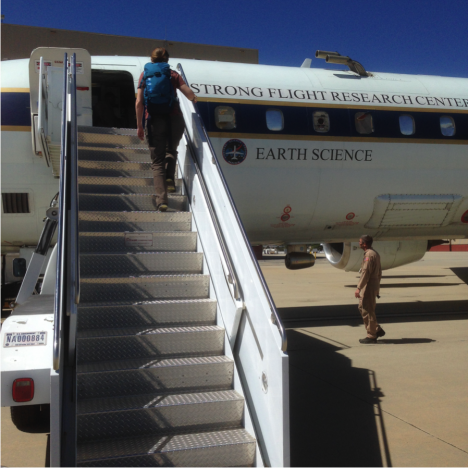
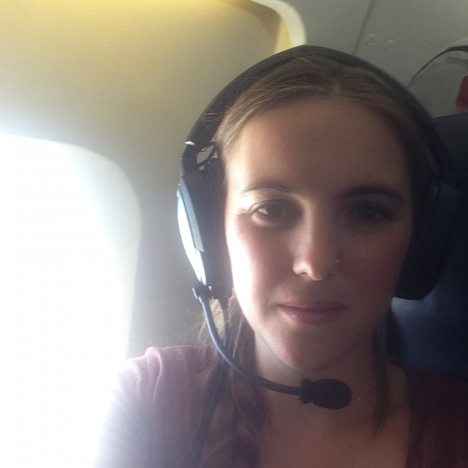
Christina Williamson (i.e. me), research scientist with CIRES/NOAA boarding the DC-8 for our first test flight at NASA Armstrong. (Credit: Agnieszka Kupc)
We flew from the base out over the Pacific, then back inland over the LA-Basin and back to base. The ATom mission flights will be constantly profiling between about 0.2 and 12km (650 feet to 7 miles) altitude, so we did a lot of ascending and descending to check that the instruments can cope with it and to look at the fuel performance of the plane with this payload. To really test every instrument, the pilots did some really fast ascents and descents (for example, flow into the inlets is affected by the incline). I had to be up out of my seat testing some things on the instrument during part of this: the crew really weren’t joking when they said to hang on.
Our instruments behaved well, needing just one or two quick software fixes that I was able to implement as we flew, and I started to relax and enjoy the flight. We can stream video from cameras in the cockpit and one looking directly down below the plane, which is great. We also have a window by my seat, so I can look out.
Once over the Pacific and out of the LA-area high air traffic we dropped seriously low — had there been a whale breaching below I would have easily seen it. We also did some very low flying over the Central Valley, which produced interesting data and interesting views (although also a reasonable amount of turbulence).
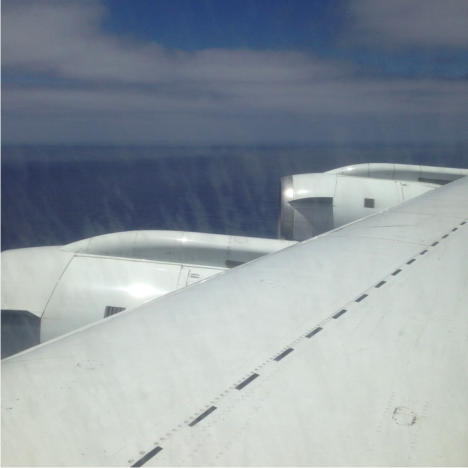
Photo from the DC-8 flying low over the Pacific Ocean on the first ATom test flight. (Credit: Christina Williamson)
During the flight we had to do some maneuvers. These are used to calibrate instruments measuring wind-speed. The crew advised us to sit down for these, and I’m glad I did, as some of them had my body weight almost out of the seat and pulling on the seatbelt. If you throw a small object in the air during one of the maneuvers you can watch it appear to hover as it falls under gravity but then you and the plane also move down away from it. It felt a bit like being in a roller coaster, and by the end of all the maneuvers I was glad to return to more normal flight. It can make you a little queasy, but just eating something or walking about the cabin afterwards really helps.
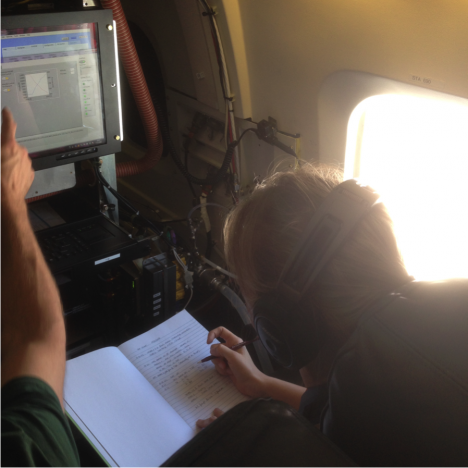
Agneiszka Kupc, research scientist with NOAA/University of Vienna, monitoring data during the first ATom test flight. (Credit: Christina Williamson)
The aircraft is noisy in flight, partly because there is less insulation on it than on a normal passenger plane, and partly because of all the pumps and fans etc. on our instruments. We therefore all wear headsets, which cancel background noise and enable us to communicate with other scientists and the crew. We get some bleed-over from the channel the pilots are on, which is quite fun.
Christina Williamson (yup, me again), research scientist with CIRES/NOAA on the DC-8 during the first ATom test flight. (Credit: Christina Williamson)
I was quite surprised when we arrived back already, four hours of flight goes by so quickly when you’re operating instruments and concentrating on the science behind what you’re seeing compared to a passenger flight. It was a good feeling to have a successful flight under the belt, to see that the instruments worked as expected and that my body coped fine with the flying conditions. We have one more test-flight just before we take off for the mission-proper. I’m looking forward to it!
Christina Williamson blogs regularly about the ATom Mission and other adventures in atmospheric science at christinajwilliamson.wordpress.com and tweets as @chasingcloudsCW.
Take 78 percent nitrogen, 21 percent oxygen, 0.9 percent argon, 0.03 percent carbon dioxide – that’s 99.93 percent of the atmosphere. But the trace gases and airborne particles that make up that last approximately 0.07 percent are what NASA’s Atmospheric Tomography (ATom) mission is interested in.
ATom is a chemistry mission to study the movement and chemical processes that affect the top three greenhouse agents after carbon dioxide – methane, tropospheric ozone, and black carbon. In addition, it’s the first time scientists are going to do a comprehensive survey of over 200 gases and aerosol particles all over the world. And to do that a team of university and NASA scientists are going on a 26-day journey from pole to pole and back again.
NASA’s DC-8 aircraft has intake valves on the window ports to suck in the air it’s flying through. Photo taken July 11 in Palmdale, California, before ATom’s first test flight. Credit: Michael Prather (UCI)
Over the next few weeks a handful of ATom scientists will be blogging about their around-the-world journey on NASA’s DC-8 flying laboratory – a plane the size of a midsize commercial airliner stuffed with 22 scientific instruments for sampling the air. They’ll collect data that not only shows where these hundreds of trace gases are hanging out and where they’re going, but also how they interact with each other – creating new compounds or destroying others, like methane, and effectively removing them from the atmosphere. Taken together, the data will give the science community a better understanding of how these gases, many of which are pollutants, affect global climate change.
The majority of the air sampled will be over the Pacific and Atlantic oceans. This summer’s trip will be the first of four deployments, one in each season over the next three years.
To learn more about ATom’s science goals and its ten-leg flight path, stay tuned.
We are ready for the big day! Tomorrow (Wednesday) we will start our put-in to the field. With a total of 5 helicopter flights all our gear, science equipment and the entire team will be flown to our field site, approx. 130 km northwest of Kulusuk. However, we have to take the weather in account; if it is foggy on the ice sheet the helicopter will not be able to land and the put-in will be postponed. So, fingers crossed!
View from the village of Kulusuk. Great weather!
During the past three days, the team arrived according to plan: Rick and Kip on Sunday morning and, last but not least, Nick on Monday morning. Having the entire team in Kulusuk made the organization of the equipment rather quick and smooth. To give you an idea of the preparations we have done: we checked and strengthened about 100 bamboo stakes, repaired tears in the tents, tested the generators, checked the gasoline on contamination with water, charged ~20 batteries, and every group sorted and tested their own science equipment. In the end, we had 132 packed and weighted items ready to be taken to the field.
This afternoon the BlueWest helicopter arrived from Reykjavik with our two pilots Johannes and Nicola. They crossed the ocean from Iceland to Greenland on the narrowest part as that is about the maximum distance the helo can fly. From there they followed the Greenland coast southward till Kulusuk. On the way, they saw seals and a group of 10 whales from the helicopter. That must have been an awesome sight!
Kip replacing the coupling on the borehole liners.
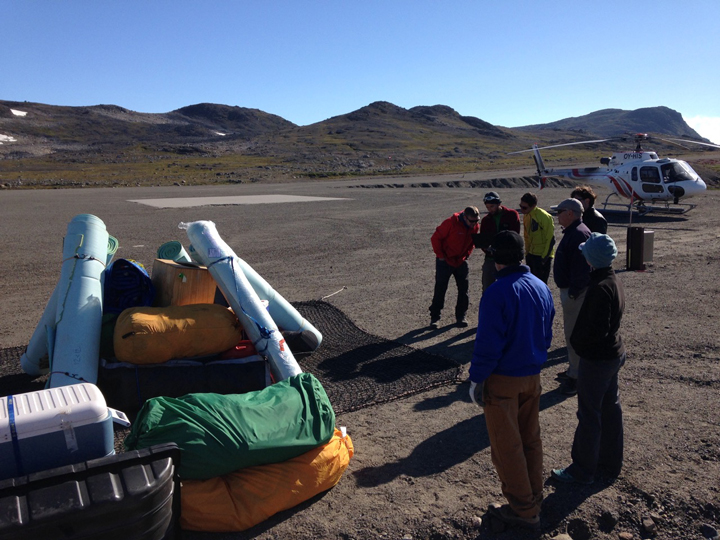
Packing the first sling load with the BlueWest helicopter on the right.
Today, we also had time to test and practice our drone-flying skills! This year, we brought a drone with us for both a serious and less serious goal. First the serious one, we will use it to scan the lowest section of our study area for crevasses. These cracks in the ice are very dangerous as they can be very deep, so it is not advisable to go close to them! However, as the ice sheet is very flat you sometimes cannot see them until you are dangerously close. With the drone we hope to spot them earlier and keep a safe distance. Next to this, the drone will be able to make a number of priceless pictures and videos of us doing science.
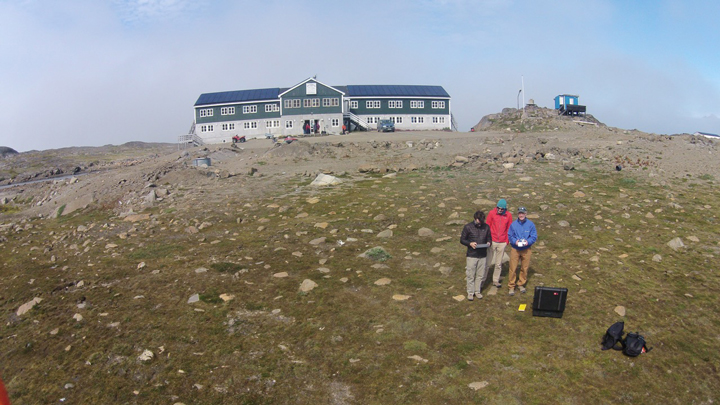
Photo from the drone: Nick, Stefan, and Rick in front of Hotel Kulusuk.
Now it is time to finish packing, take a last shower and go to sleep. Tomorrow, there are three flights scheduled: first our camping equipment will be flown in by sling, followed by a part of the team who will set up camp. The science equipment will be flown in next. The next day, the snow mobile and fuel are brought in followed by the last passenger flight. At least that is the plan, the weather can still change everything…!
Greetings from Kulusuk! Olivia, Nick, Clem, Rick, Kip, and Stefan.
