After just over a full week at sea, we have found the rhythm of our life and work routines. We collect water with the CTD rosette, deploy instruments over the side of the ship, work in the lab, eat, and sleep. That might sound like a lot of work and no play, but we do manage to have fun while we work (think lab dance party while filtering water samples). We’ve also taken time to observe the vast blue around us from the upper deck of the ship, where we recently watched a gorgeous sunset. No green flash sightings yet but I continue to hold out, hoping to see this optical phenomenon – a green flash of light that can sometimes be seen just before the sun disappears below the horizon.

Left: View of the sunset from the top deck. Right: Deck operations just after sunset, which includes deploying two instrument packages that measure a variety of optical parameters, and the CTD rosette, which collects water samples from different depths. Credit: Ali Chase
Several days ago we crossed into the Sargasso Sea, which is an area of very clear blue water due to low amounts of phytoplankton and dissolved matter which absorb light and make the water in some areas, such as coastal regions, a greener color. But here the water is an amazing deep blue color, which is the color of ocean water when there is not much there besides the water itself. One life form that is prevalent is a seaweed called Sargassum, which we frequently see floating by.

The very blue water of the Sargasso Sea, with a few floating pieces of Sargassum. Each piece is roughly the size of dinner plate, for scale. Credit: Ali Chase
Speaking of things that absorb light in the ocean, much of the work we do in the “wet lab” is related to the absorption and scattering of light by different particles in the ocean. This optical oceanography work allows us to measure the way light interacts with particles, in particular phytoplankton, which absorb and scatter light differently depending on the types and amounts of phytoplankton present. Throughout this cruise we are collecting water continuously using a system involving a boom that extends over the side of the ship with a hose hanging from it into the water. A pump on deck constantly brings water from approximately three meters depth through the hose and into the wet lab, where it then flows through several instruments and provides us with constant information about the optical properties of whatever is in the water.
But, the ocean is a massive place, something that we are very much reminded of while working at sea with no land to be seen in any direction. Even sampling the water continuously during this three-week trip will just give us a small snap shot of ocean conditions. This is where satellites come into play, as they can provide a much broader spatial view of the world’s oceans. However, work in the field is necessary to “ground-truth” what the satellites tell us, to be sure that such expansive information can be accurately related to what is present in the ocean. During this research cruise we will pass through several types of water, such as the warm/salty/fewer phytoplankton water like we see here in the Sargasso Sea, versus cooler/nutrient rich/lots of phytoplankton water in coastal areas such as the Gulf of Maine. Understanding the differences between these regions can be useful for interpreting satellite information about phytoplankton and their role in the earth’s carbon cycle.
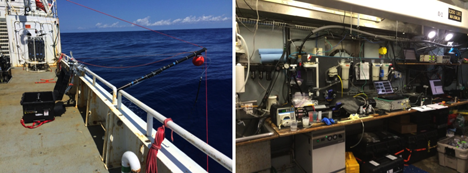
Left: The flow-through intake system; the hose hanging from the end of the black boom sucks up water continuously using the pump located in the black box on deck. Right: The wet lab in all its glory – the tubing with the water pumped from outside can be seen running up near the ceiling; it then flows through several instruments positioned both in the sink and on the bench top. Credit: Ali Chase
A couple of days ago a storm system passed over us, and the winds came up to about 30 knots. With winds that high, waves crash onto the deck and it is unsafe to deploy instruments over the side of the ship, so our work was put on hold for a day. I spent some time on the bridge (where the ship’s captain and crew navigate from) and watched the bow of Endeavor ride the waves like a roller coaster. Every now and then the bow came down against a big wave and an impressive spray of ocean water was sent flying, with water reaching as far as the windshield of the bridge where we were watching!
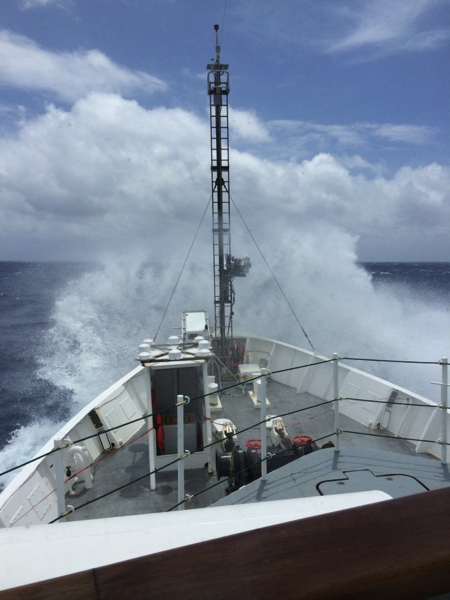
The ship crashes into a large wave during high seas. Credit: Ali Chase
To document our work and life on board we have been putting GoPro cameras on everything, including hard hats and instruments that are deployed over the side of the ship. Recently a GoPro went for a ride on the “Polarimeter”, an instrument that measures the polarization state of light, which Robert mentioned in the previous blog post. While the GoPro was underwater, a big group of dolphins came to say hi, and the GoPro caught it on camera – very cool! We also lowered Styrofoam cups down with the CTD to a depth of 1,000 meters, where the pressure compresses them, along with any writing or pictures that have been drawn on. We sent down a bunch of cups from a school group that had visited the University of Maine’s Darling Marine Center, and we added a few that we decorated ourselves for souvenirs to bring home.

Left: A selfie I took while wearing the GoPro on my hardhat. Credit: Ali Chase; Right: Dolphins near the Polarimeter deployed with a GoPro attached. Credit: Wayne Slade
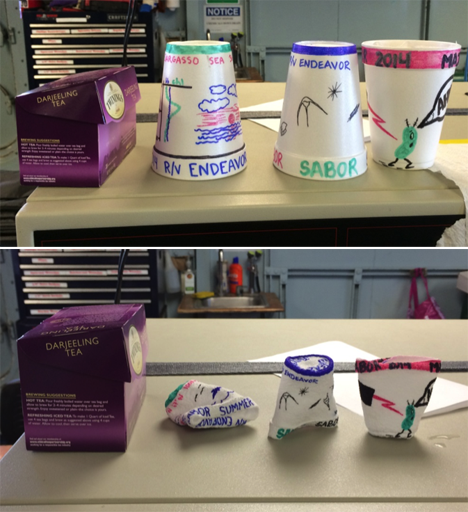
Styrofoam cups that were attached to the CTD and lowered to 1,000 meters, where the pressure compresses them (top = before, bottom = after; box of tea shown for scale). Credit: Ali Chase
I feel very fortunate to be included in this adventure at sea with such a great group of scientists and crew. I am constantly learning about the ocean and how we understand it as oceanographers, as well as all of the techniques and logistics that go into the collection of quality data. It is certainly humbling to be out on the ocean with nothing but blue all around, and I am reminded of why I am drawn to this field of study and how much of our planet is covered in this blue expanse. Thank you for taking the time to read our blog and I hope you’ve enjoyed this glimpse into our life and work at sea!
Ali Chase is a graduate student in oceanography at the University of Maine’s School of Marine Sciences.
As the ER-2 pilot got ready for his first flight out of Fairbanks, I wondered what it’s like piloting the aircraft, all by himself, 65,000 feet up.

Denis Steele sets up a video camera in the cockpit of the ER-2, 65,000 feet over Alaskan mountains and glaciers. (Credit: Denis Steele/NASA)
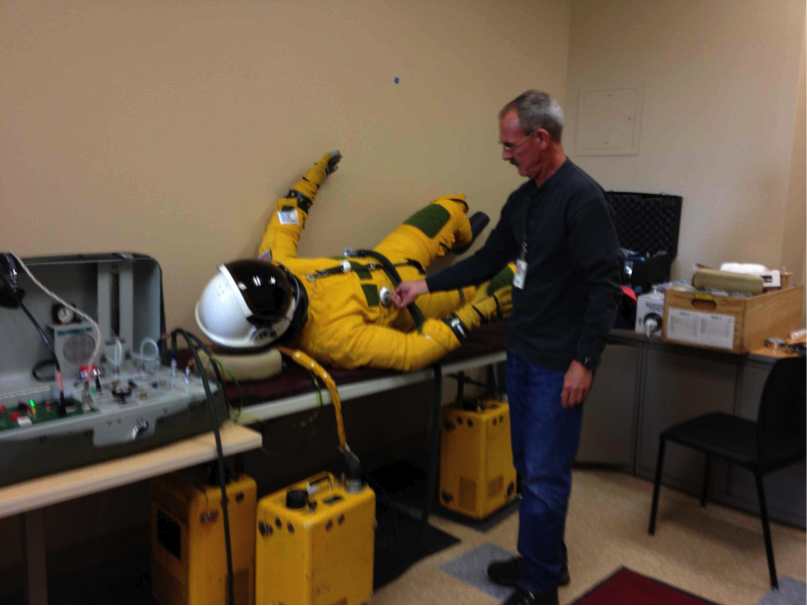
The NASA ER-2 pilots for this campaign, Tim Williams and Denis Steele, are flying the MABEL instrument to study the glaciers and ice sheets. Before they fly, they have to get suited up. It’s quite a process. Because the altitude is so high, they need to wear pressure suits. I talked with expert NASA engineer technicians Raul Cortes and Ryan Ragsdale, who are veterans in testing equipment and prepping pilots before a flight to ensure safety.
The involved process starts the day before a flight, when Cortes and Ragsdale prepare the pressure suit. They check the pressure and make sure there are no leaks in the gloves, body suit, and helmet. They put the whole system together and inflate it, like a giant balloon character, to test that the suit will properly pressurize.
Engineer Technician Ryan Ragsdale of NASA Dryden inflates the pressure suit the day before to make sure there are no leaks. (No, there is not a real person in there!). (Credit: Valerie Casasanto/NASA)
When a pilot puts on the suit, it’s bulky and stiff, so it’s difficult to work in. And it’s difficult to eat in. During the long flights, pilots eat and drink out of a straw.
The food is the consistency of pudding, and the straw feeds through a small hole in the helmet of their pressure suit. I asked what was on the menu for one flight. They have a choice that includes beef stroganoff, pears, caffeinated chocolate pudding (which happens to be Cortes’ and ER-2 crew member Luis Rios’ favorite). I was curious about this chocolate pudding, but given a free sample of the “pears” — which tasted like part baby food, part applesauce, with a pear afternote.
Pears in a tube. (Credit: Valerie Casasanto/NASA)
The caffeinated chocolate pudding used to be Williams’ favorite until he switched to the caffeinated apple pie. Mmmm, wonder if there are crusts in there too. When Steele first started flying, he ate the tube food. But sometimes it would get messy. One time a pilot was heating up a “sloppy joe” tube and it accidentally squirted out all over the cockpit. Now Steele just drinks water. You can easily dehydrate up there since you are breathing pure oxygen.
I thought it must be pretty confining in that suit with not much room to move, so talked with the Steele and Williams to see what the space is like for their 8-hour journey. The cockpit seemed to be about the size of half of a bob sled. Or, according to Steele, “if you throw a blanket over your head and body and lift your arms out a little, it’s that area between you and the blanket.” Just a little bit of room to move around, and a bit of leg room (unless a pilot is really tall). However, it doesn’t feel claustrophobic, Williams said, because they have good visibility.
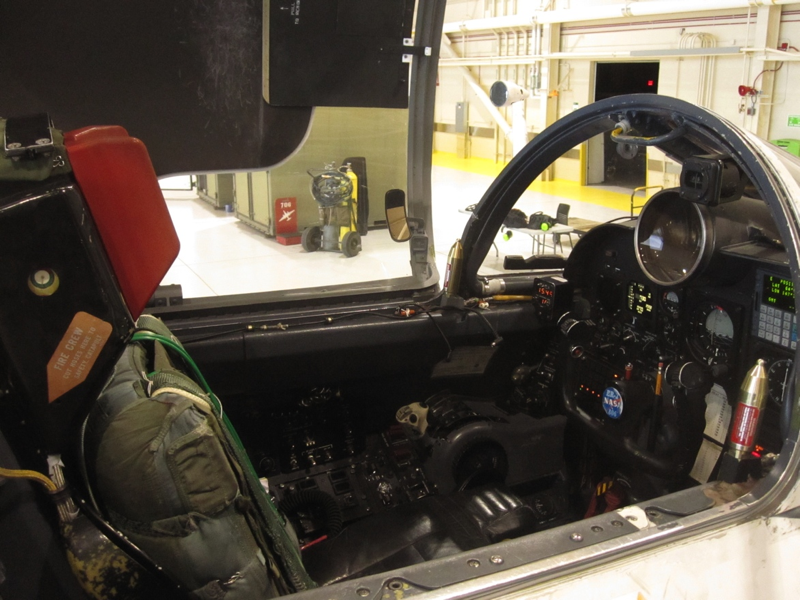
The ER-2’s cockpit, with little room for movement. Credit: Valerie Casasanto/NASA
When they’re up in the stratosphere, pilots keep a close watch on the plane’s instruments, Steele said. “You are always thinking – watching the instruments, doing science, mental math, calculations, thinking about what you would do in an emergency situation.”
They even do puzzles. On one flight last week Williams did Sudoku to keep entertained. You can also plug in to play music, although there are stories of colleagues playing tricks on the pilots, and programing in Disney music prior to flight.
Long flights at high altitudes do have effects, Steele said, and pilots need to be careful and not exercise too much after they land.
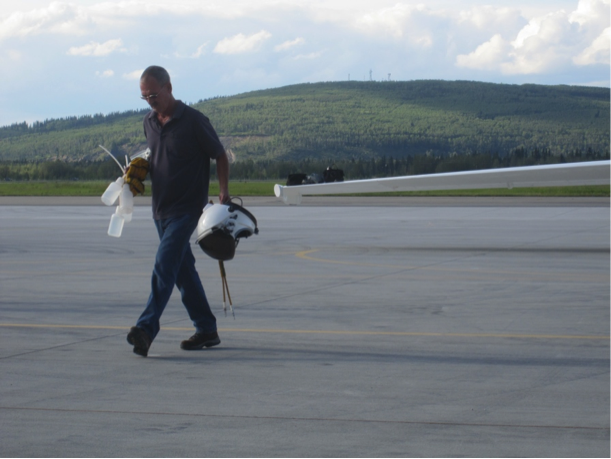
Ryan Ragsdale carries empty water bottles and pilot’s helmet back to hangar after a long day’s flight. (Credit: Valerie Casasanto/NASA)
“Being at 60,000 ft. does drain you, especially if you are working hard,” he said. “The time you are working hardest is when you take off and land. The pilot does a lot of movements to keep the plane stable at low altitudes. It wears you out. But you get used to it, it’s like driving a car!”
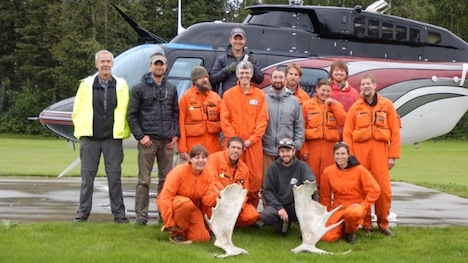
The USFS Forest Inventory & Analysis (FIA) crew before departing Delta Junction by helicopter to sample a remote field plot. Front Row: Katie Rigby, Misha Yatskov, Dan Irvine, Ashley Lehman; 2nd Row: Ken Winterberger, Chad Oukrop, Eric Straley, Seth Ayotte, Brendt Mueller, Michelle Hansen, Warren Childe, Ray Koleser; and 3rd Row: Pilot Josh Toal, Matt O’Driscoll, Warren Childe.
The Alaska G-LiHT Campaign is a partnership between scientists and NASA and the U.S. Forest Service (USFS). The design for the research is to link field measurements of forest structure, vegetation composition, and soils with airborne remote sensing data from G-LiHT. At this stage of the mission, the flight planning looks a little like a technicolor version of Pac-Man. Pink lines on the flight GPS units intersect points showing the location of ground measurements. In flight, the goal is to gobble as many of these dots as possible. Sometimes you wonder if the familiar “wocka wocka” noise of the old video game can be heard above the noise of the engine.
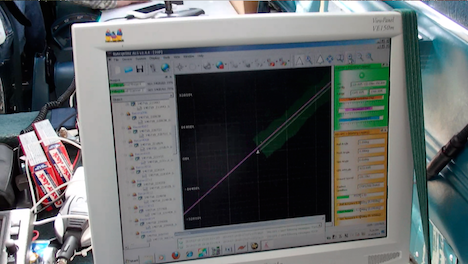
G-LiHT flight computer during data acquisition. The swath of lidar data appears green, the flight line pink, and real-time information on ranging distance and laser returns.
NASA and USFS partners have also worked hard to connect G-LiHT flights to other research activities in the valley. Within NASA, overlapping G-LiHT and MABEL flights are planned to characterize ice cover high in the Alaska Range west of Denali and across the Nebesna Glacier in Wrangell-St. Elias. Overlapping coverage is also planned with two hyperspectral missions from USGS (PI Ray Kokaly) and the U.S. Army Corps of Engineers (PI Steve Newman), offering the chance to compare different hyperspectral imaging systems and share ground calibration data.
G-LiHT flights will also cover a range of existing forest inventory plots collected by collaborators at the Department of Defense lands (Dan Rees), National Park Service (Carl Roland, Colin Malone), and the Alaska Department of Natural Resources (Chris Maisch, Doug Hanson). A dense network of flight lines is planned in and around the Bonanza Creek Experimental Forest and the Caribou Poker Creek Research Watershed to cover research plots established by scientists at the University of Alaska Fairbanks (Jaime Hollingsworth, Glenn Juday, and David McGuire, among others).
Further afield, still more dots on the flight plan represent long-term studies of forest recovery from fire. More than 40 percent of the watershed has burned since 1950, and G-LiHT will sample about 80 percent of large wildfires that have burned over the past 60 years. Record rainfall this summer has kept fire activity in check, but G-LiHT data from 2014 will also provide a benchmark for assessing changes from fires in coming years. Each of these intersecting lines and points represents a new opportunity for collaboration with the Alaska G-LiHT Campaign in 2014.
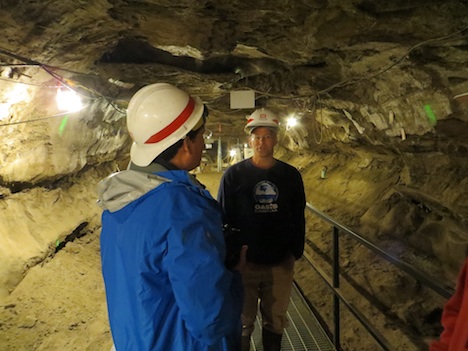
G-LiHT PI Bruce Cook talks with Tom Douglas (US Army Corps of Engineers) during a tour of the Permafrost Tunnel Research Facility before a joint field visit to the Cold Regions Research and Engineering Laboratory (CRREL) field sites outside Fairbanks, Alaska.
Text by Robert Foster
City College of New York – CUNY
Here we are ending the 4th full day aboard the R/V Endeavor, and I can hardly believe it! Time really does fly when you’re having fun! Amid the rush of running cables, installing sensors, learning new and exciting science and making new friends, I couldn’t be happier. I am a 3rd year Ph.D student in the Electrical Engineering department of The City College of New York, and through extremely fortunate circumstance I found myself working in the Optical Remote Sensing Lab of NOAA-CREST.
Life aboard the R/V Endeavor is both exhilarating and exhausting! During our safety briefing I jumped into an immersion “Gumby” suit for the first time, giving my colleagues a good laugh as I tried to close the face flap with my lobster claw gloves.
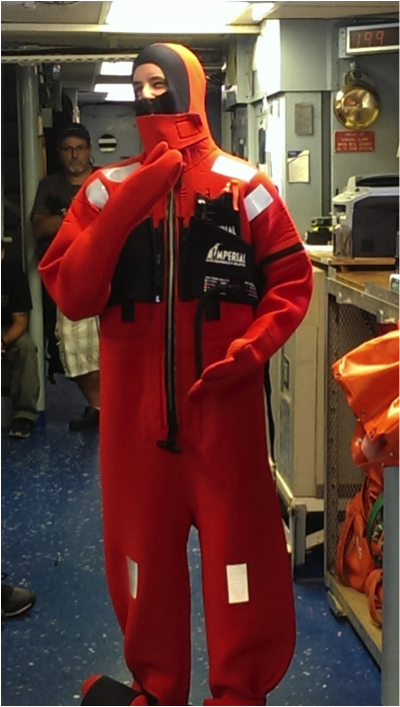
I’m trying on the immersion suit for the first time and posing “mannequin-style” for the safety briefing Friday morning. Photo courtesy of Ivona Cetinic, University of Maine
Although we’re currently 18 miles off the shore of New Hampshire, we’ve already had several visitors!
On Saturday morning we spotted a pod of whales in the distance. They were too far away to photograph, but we could clearly make out their sprays and tailfins when they dove.
And the dolphins! This was the best part. Just a couple hours after leaving port on Friday the entire science team was on deck learning how to deploy the CTD when a pod of dolphins started leaping out of the water not 20 feet from the ship! It was almost as if they wanted to see us off on our journey! We managed to snap some really fantastic photos.
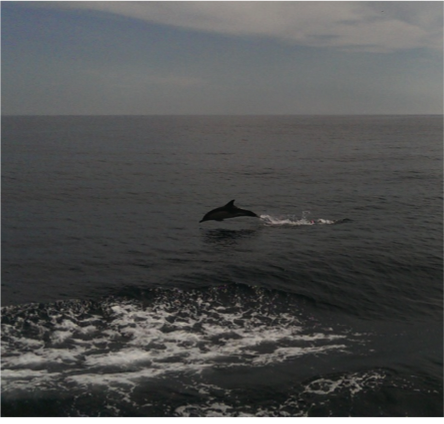
Dolphins jumping out of the water to see us off! Photo courtesy of Ivona Cetinic, University of Maine
Slightly more numerous than dolphins are the tiny phytoplankton which provide us with so much of the oxygen we breathe. Inside Endeavor’s main lab is an amazing instrument that can actually take pictures of these microscopic creatures and count them! Since one of SABOR’s primary science goals is to quantify how much carbon is being converted into oxygen by marine life, it is vital that we know exactly what species are present and in what concentrations.
Of course it’s impossible for the R/V Endeavor to be everywhere at once, so we must rely heavily on satellite observations. Current sensors such as MODIS (Moderate-Resolution Imaging Spectroradiometer) aboard the Aqua satellite and VIIRS (Visible-Infrared Imaging Radiometer Suite) aboard the Suomi NPP platform are designed to observe the ocean and atmosphere. Although they do it quite well in a general sense, there is still too much uncertainty to make absolute assessments of climate change and carbon cycling.
When we as humans look at an object, what is it that we’re actually seeing? (No, it’s not a philosophical question!) We see color and brightness. Seems sufficient, doesn’t it? But it turns out that there is actually another hidden property of light that we can’t see with our eyes, and it’s called polarization.
So if we can’t see the polarization of light, why do we care about it? Why is it a major focus of SABOR? The answer is because it’s becoming more and more difficult to increase the accuracy of satellite measurements using color and brightness alone. By incorporating polarization into our measurements, we are opening up a whole new dimension of information that was previously inaccessible. Our laboratory at the City College of New York is studying the way light becomes polarized in various conditions both above and below the surface of the ocean.
The first of the two instruments that we designed at City College is called HyperSAS-Pol. It is designed to automatically look at a fixed angle relative to the sun, regardless of the direction the ship is facing. HyperSAS-Pol measures both the polarization of sky light, and also light coming from the ocean.
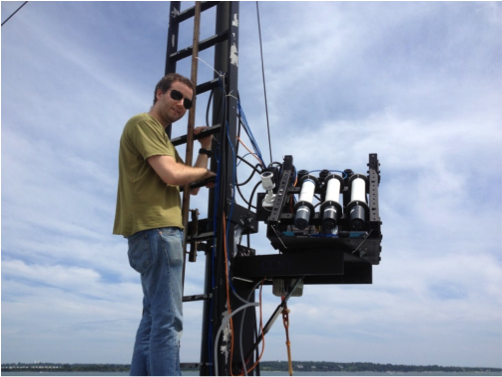
I’m setting up HyperSAS-Pol on the bow tower of the R/V Endeavor. Photo courtesy of Alex Gilerson, City College of New York
Our second instrument floats on the surface of the ocean and measures the polarization of light underwater. We can rotate the instrument by using propellers that are attached to its arms. The sensors themselves are attached to a stepper motor which can look up or down in the water. With these two motions we can measure polarized light in any direction. By the way, this instrument doesn’t have an awesome code name like HyperSAS. We just call it the polarimeter… pretty boring name, I know. Maybe you can think of a better one? Post a comment!
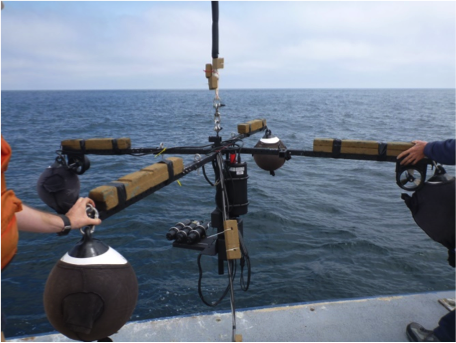
Our floating polarimeter. Photo courtesy of Alex Gilerson, City College of New York
While we are taking measurements on the R/V Endeavor, a plane will be crossing our path several times with a sensor capable of measuring polarization, as well as a LIDAR. During their test flight on Sunday afternoon we were able to watch the plane corkscrew down from the clouds to circle the ship! Too cool. They even took a picture of us!
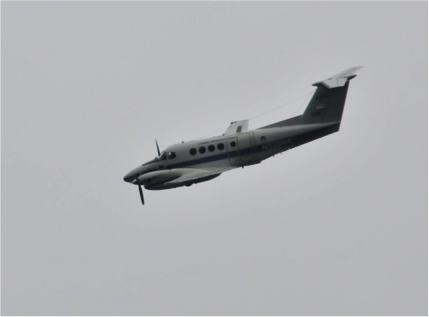
The NASA Langley plane circling the R/V Endeavor on Sunday afternoon. Photo courtesy of Wayne Slade, Sequoia Scientific
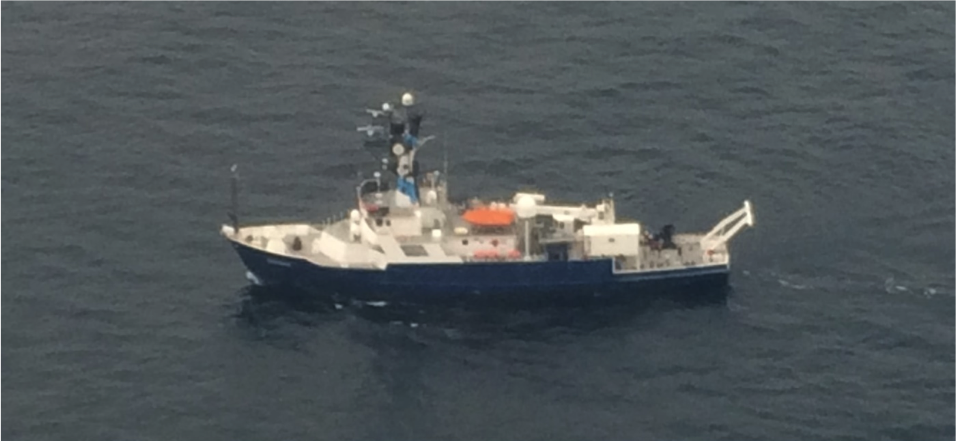
The R/V Endeavor as seen from the sky! Photo courtesy of David Harper, NASA Langley Research Center
Between the combined efforts of everyone onboard the R/V Endeavor and in the sky, we will be able to trace the complete path of polarized light coming from the sun, down through the atmosphere, into the water, interacting with all the little sea critters and finally emerging back into space to be captured by one of NASA’s Earth Observing satellites. If successful, our work here will be instrumental in the design of next generation satellites, such as the PACE mission.
We have one final visitor who is here in spirit, and his scientific value is without doubt. He makes sure that no light gets reflected off the white buoys and contaminates our underwater sensors. He is a childhood friend of mine, but I’m sure that you’ve met him before too!

Our very special colleague. Photo courtesy of Chris Armanetti, R/V Endeavor
Text by Doug Morton
NASA’s Goddard Space Flight Center
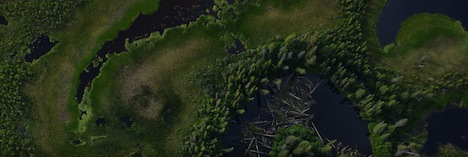
G-LiHT DSLR image of forests and open water near the Tetlin National Wildlife Refuge east of Tok, Alaska. Credit: NASA
I have always enjoyed looking out the window of a plane. From the typical cruising altitude of a commercial jetliner, the view of lakes and fields and mountains is familiar (but still fascinating) to a NASA scientist used to looking at Earth from space. Vegetation and land use follow the topography in predictable ways — agricultural fields on the flattest lands and dense forest cover on the warm, south-facing slopes.
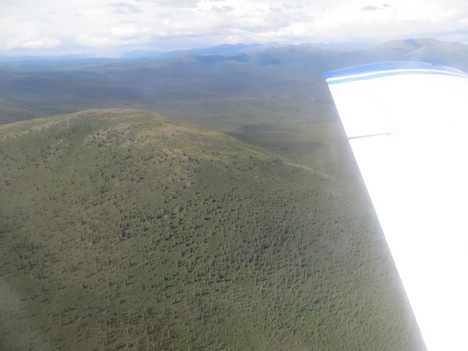
Spruce forest in the Yukon-Charley Rivers National Preserve north of Delta Junction, Alaska. Credit: Ross Nelson/NASA’s Goddard Space Flight Center
In Alaska, the G-LiHT campaign is flying low and slow to provide a very detailed look at forest structure, topography, wetlands, and forest health. At 1,100 feet above ground level, the view from above is stunning. Looking down, you see individual trees, small polygons formed by permafrost, and subtle changes in topography that allow vegetation to flourish on dry ground or wallow in the wetlands of the Tanana flats. Small black spruce trees, barely head high and the width of a dinner plate, are packed together in stands too thick to walk through. Looking out, you can see the vast expanse of the Tanana Valley, a lush green carpet of forest. The braided channels of the river flash in the sunlight as the milky white water heads out of the mountains. Ahead, the steep rise of the Alaska Range signals the end of another flight line.
Seeing the landscape from the same perspective as the G-LiHT sensors provides essential context for the project. The G-LiHT operators on the plane can switch between the real-time view of the incoming data stream and the landscape below. G-LiHT PI Bruce Cook noted, “it’s a little dizzying to watch the imagery fly by on the screen, but matching the bird’s eye view to the data gives an idea of what is possible with the analysis and interpretation of the G-LiHT data.”
Update: As of July 19, the piper had flown more than 70 hours for data collection (9,300 miles), and with more than half of the planned flight lines in the Tanana region completed.
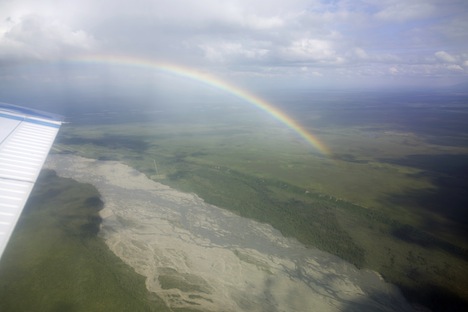
Rainbow over the Tanana River. Credit: Bruce Cook/NASA’s Goddard Space Flight Center
