By Eric Lindstrom
“The techniques I developed for studying turbulence, like weather, also apply to the stock market.”
Benoit Mandelbrot
If Mandelbrot’s statement is true, maybe oceanographers studying ocean microstructure (caused by turbulence), besides writing journal articles about mixing in the ocean also work on padding their retirement accounts with stunning stock market acumen?
Jokes apart, how does ocean microstructure work? The microstructure component of SPURS features measurements of very small-scale (inch or smaller) variations of temperature, salinity, and velocity, used to infer mixing rates due to turbulence and convection in the upper ocean.

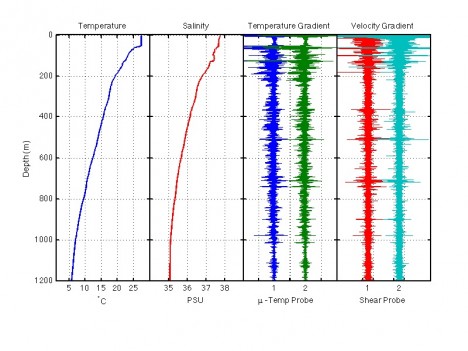
Profiles of Temperature, Salinity, two channels of small-scale temperature gradient and two channels of small-scale shear from a dive of the Vertical Microstructure Profiler (VMP). The depth intervals with the strongest variations in temperature gradient and vertical shear are the places where the ocean is mixing the strongest. These raw data are carefully processed to tell us how much of the salinity change that we see is due to the vertical mixing rates. They can also tell us which processes are causing the mixing, such as shear instability or salt fingers.
Lou St. Laurent, together with Woods Hole Oceanographic Institution colleagues Carol Anne Clayson and Ray Schmitt, are the scientists principally focused on these issues. Their work is supported by the National Science Foundation and is another good example of the inter-agency cooperation spanning SPURS.
Ken Decoteau, a WHOI engineer, leads the microstructure group’s sea-going effort. Together with James Reilly, a research technician from UMass-Dartmouth/SMAST, Oliver Sun, a WHOI postdoctoral investigator, and Alec Bogdanoff, a graduate student in the MIT/WHOI Joint Program for Physical Oceanography, they run 24-hr operations of two instrument systems, a vertical microstructure profiler (VMP) and turbulence-sensing gliders (T-gliders).
The first, a vertical profiler (Rockland Scientific VMP5500), is lowered into the water and released. In its pressure housing, it carries batteries and electronics. The data collected by the external sensors is recorded to a disk drive inside the instrument. The steel ballast weights it carries cause it to sink to a pre-set depth. Upon reaching this depth, a trigger mechanism is fired, causing the weights to be released, and the instrument to float back to the surface. The instrument is then recovered, the data downloaded, and preparation for the next deployment begins. Although the instrument is capable of profiling to a depth of 18,000 feet (about 5,500m), most of the profiles on this expedition are being done to a depth of 4,000 feet (1,200m). These deployments take about one hour from the time we release the instrument until it re-surfaces.
A second kind of measurement (of longer duration) is conducted using two Teledyne-Webb Slocum Gliders (T-gliders), each carrying a Rockland Scientific MicroRider. The MicroRider is similar to the VMP, but is much smaller in size since it is not designed to go as deep, and does not carry its own batteries and CTD; it draws battery power from the glider. The T-glider does not utilize direct propulsion (as in a motor), instead changing its buoyancy to move up and down in the water column and using wings to translate this motion from vertical to horizontal (a.k.a. gliding). This low power design means microstructure data can be collected continuously over a time period covering weeks, even months, with minimal intervention.
During SPURS, one T-glider is covering the upper 230 feet (70m) of the water column while stationed in a small area close to the highly-instrumented WHOI mooring, while the other T-glider is covering the upper 660 feet (200m) of the water column while doing continuous transits between the WHOI mooring and PMEL-N mooring.
So far, more than 30 VMP microstructure profiles have been taken by two twelve-hour shifts working 24/7. With the minimal additional amount of effort required to deploy and to periodically checkup on the two gliders, we have collected over 700 additional profiles of the upper ocean from the gliders. Utilizing these two different platforms simultaneously has a dramatic positive effect on our sampling efficiency, and illustrates why autonomous sampling techniques have become much more common in recent years.
The measurements of microstructure variations in temperature, salinity, and velocity are crucial to SPURS estimating the salinity balance. We need to know how the less saline waters to the south and south are mixed with the saltier waters near the salinity maximum in the North Atlantic.
Maybe, after all, it is like the stock market! The “value” (measurement) of our “commodity” (salinity) depends on a complex global “marketplace” (a salinity balance equation) forced by wind, evaporation and precipitation and “trading” in complex oceanic processes (circulation and eddies) acting in the end through “derivatives” (turbulent mixing) to determine the values we see. Maybe these oceanographers are in fact sitting on a gold mine!
Truth be told, their mathematical wizardry is focused on understanding the ocean and the water cycle, not the stock market and the business cycle. However, old Benoit Mandelbrot was entirely correct! A few brilliant men like him can live in both worlds and we all profit.
Tags: NASA, oceanography, salinity, SPURS, SPURS1


