In the Southern Hemisphere summer of 2002, scientists monitoring daily satellite images of the Antarctic Peninsula watched in amazement as almost the entire Larsen B Ice Shelf splintered and collapsed in just over one month. They had never witnessed such a large area—3,250 square kilometers, or 1,250 square miles—disintegrate so rapidly.
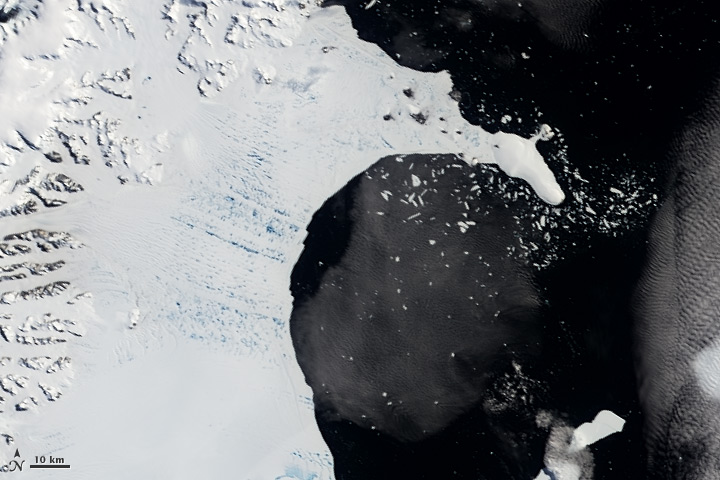
The collapse of the Larsen B Ice Shelf was captured in this series of images from the Moderate Resolution Imaging Spectroradiometer (MODIS) on NASA’s Terra satellite between January 31 and April 13, 2002. At the start of the series, the ice shelf (left) is tattooed with parallel lines of blue dots. The dots are pools of meltwater, and they are arranged in lines because the water drained into existing crevasses. Beneath a thin layer of clouds, a smattering of icebergs appears in the dark, open waters of the bay (right).
By February 17, the leading edge of the C-shaped shelf had retreated about 10 kilometers (6 miles) as the shelf began to splinter. The next good view of the area came on February 23; several more long and narrow ice bergs had fractured from the shelf in the south. By March 7, the shelf had disintegrated into a blue-tinged mixture (mélange) of slush and ice bergs. Many of the bergs were too tall and narrow to float upright. They toppled over and spread out across the bay like a neat row of books that had been knocked off a shelf.
When the bergs tipped over, the very pure ice on the bottom side of the ice shelf was exposed. The pale blue color is largely due to the reflection from this ice. Pure, thick ice absorbs a small amount of red light. Photo-like satellite images are made by combining the satellite’s observations of red, green, and blue wavelengths of light reflected from the Earth’s surface. When all these visible wavelengths are strongly reflected, the surface looks white; when the reddest light is absorbed, the reflection takes on a cyan tinge.
The last images in the series were captured as austral autumn arrived. The bright blue color of the ice debris field faded as the remnants of the shelf were covered by the first snows of the season. Seasonal sea ice began to form and locked most of the ice debris in place for the winter, although the April 13 image shows that a few of the largest icebergs from the southern portion of the shelf had already drifted out of the area.
The collapse of the Larsen appears to have been due to a series of warm summers on the Antarctic Peninsula, which culminated with an exceptionally warm summer in 2002. Significant surface melting due to warm air temperatures created melt ponds that acted like wedges; they deepened the crevasses and eventually caused the shelf to splinter.
Other factors might have contributed to the unusually rapid and near-total disintegration of the shelf. Warm ocean temperatures in the Weddell Sea that occurred during the same period might have caused thinning and melting on the underside of the ice shelf. As the surface melt ponds began to fracture the shelf, strong winds or waves might have flexed the shelf, helping to trigger a runaway break up.
The ice debris field did not become a permanent fixture in Larsen Bay. As seasonal sea ice melted the following summer, the mélange began to drift away with the currents, and in many summers since the collapse, the bay has been completely ice free. Although sea ice occasionally occupies the bay during cold winters, it is no substitute for the ice shelf in terms of its influence on the glaciers that once fed the Larsen B. The grounded portion of the shelf used to push back against the glaciers, slowing them down. Without this pushback, the glaciers that fed the ice sheet have accelerated and thinned.
While the collapse of the Larsen B was unprecedented in terms of scale, it was not the first ice shelf on the Antarctic Peninsula to experience an abrupt break up. The northernmost section of the Larsen Ice Shelf Complex, called Larsen A, lost about 1,500 square kilometers of ice in an abrupt event in January 1995. Following the even more spectacular collapse in 2002, the Larsen A and B glaciers experienced an abrupt acceleration, about 300% on average, and their mass loss went from 2–4 gigatonnes per year in 1996 and 2000 (a gigatonne is one billion metric tonnes), to between 22 and 40 gigatonnes per year in 2006.
Nor was the Larsen B the last Antarctic ice shelf to disappear. Farther down the peninsula to the southwest, the Wilkins Ice Shelf disintegrated in a series of break up events that began in February 2008 (late summer) and continued throughout Southern Hemisphere winter. The last remnant of the northern part of the Wilkins Ice Shelf collapsed in early April 2009. It was the tenth major ice shelf to collapse in recent times.

