Beaches are dynamic, living landscapes. Spend a day on the beach and you see the micro scale — in the grains of sand blown by winds, tumbled by the surf, or carried out in your shoes. Spend a week, and you see sandbars and wading pools arise and disappear. Spend a year, and you see dunes grow, shrink, and migrate. When you look across decades and centuries, you see the landscape evolving on a wider scale, but still one that humans can experience.
The prime example of beach evolution is the coastal barrier. These strips of land are usually long and narrow and run parallel to the mainland. Sometimes they are islands and other times they are connected to land at one end, a feature dubbed a “spit.” Scientists estimate that there are more than 2,100 barrier islands in the world fronting nearly 10 percent of continental shorelines. In the United States, barrier spits and beaches line up along nearly a quarter of the coast, mostly facing the Atlantic Ocean and Gulf of Mexico. Some of the best-known barrier systems include Padre Island in Texas, the Outer Banks of North Carolina and Virginia, the south shore of Long Island, New York, and the Sea Islands of South Carolina and Georgia.
These beaches are not only attractive to human settlers and tourists; they promote the development of critical marsh and wetland habitats. Barrier beaches also protect the mainland from the full force of ocean wind and wave energy. This is particularly important on shorelines prone to hurricanes, typhoons, and nor’easters.
Barrier beaches and spits are constantly raised up, shifted, and torn down by the natural ebb and flow of waves, currents, winds, and tides. Storms can reshape them abruptly and dramatically. Hooks form, inlets open and close, and beaches slowly march across their back bays and lagoons toward the mainland, as if seeking shelter from the full force of the ocean. This process allows them to naturally march upwards as sea levels rise.
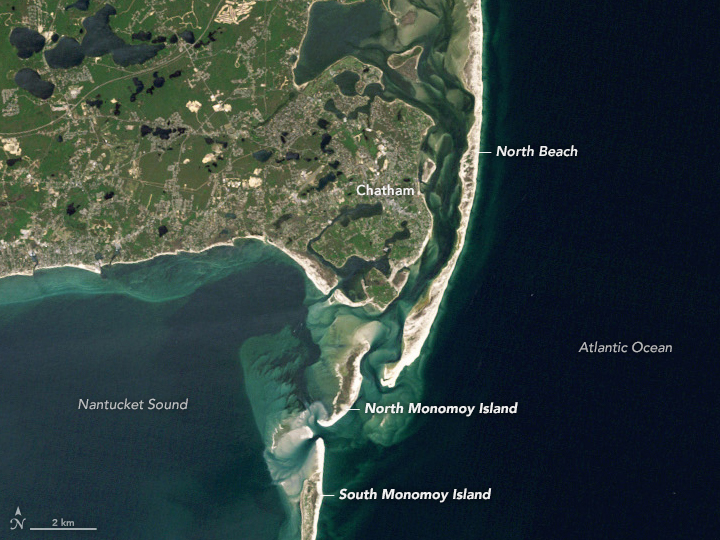
On the southeastern elbow of Cape Cod, where the New England coast reaches out into the cold and choppy North Atlantic, this natural progression has been taking place in full view of satellites for more than 30 years. The images above were collected by three generations of Landsat instruments: the Thematic Mapper on Landsat 5, the Enhanced Thematic Mapper Plus on Landsat 7, and the Operational Land Imager on Landsat 8. Each scene shows the shape of the coast off of Chatham, Massachusetts, from June 1984 through August 2020. (Click on the dots to scroll through the images, or hit the play arrow for a slideshow.)
The changes to the Nauset-Monomoy barrier system are sometimes subtle and sometimes dramatic. In 1984, when the image series begins, an unbroken barrier spit shields the Atlantic-facing coast of Chatham and its harbor. South of the mainland, North and South Monomoy Islands stand apart from each other and from the coast. Over the span of 35 years and 22 images, several major breaches open in the system and the barrier islands connect to the coastline and to each other at various times. All the while, sandbars and shoals—which appear as light tan waters just offshore—hint at the underwater movement of sand up and down the coast. (Note that some of the change in individual images may be due to different tidal stages at the time of satellite overpass.)
The first major change appears in September 1987. A nor’easter in January 1987 cut a new inlet through North Beach, forming what the locals called South Beach Island. In the 1990 image, the north end of South Beach Island nearly connects to the mainland; by 1993, the connection is complete and the south end of the spit starts to grow longer and wider. For most of the 1990s and early 2000s, South Beach keeps reaching southward toward South Monomoy. Meanwhile, the waters around North Monomoy grow shallower as sandbars and shoals rise up toward the water line.
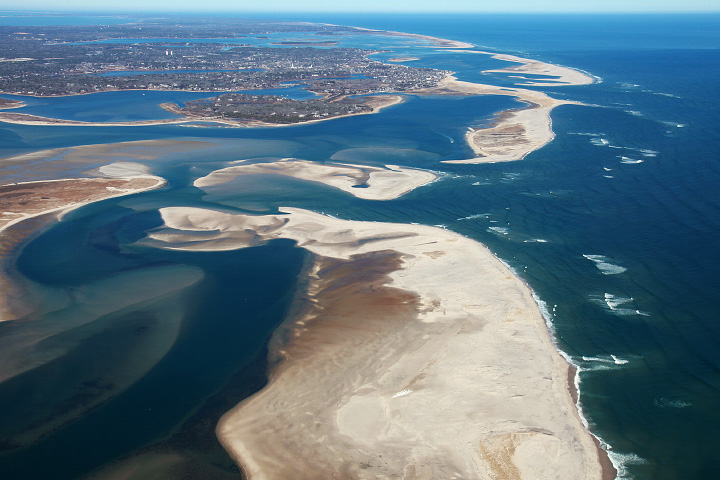
A February 2013 nor-easter cut a new inlet across South Beach, severing the connection to South Monomoy. (©2014 Spencer Kennard, Kelsey-Kennard Photo-Gallery.)
The slow evolution gives way to abrupt change in 2007. A great nor’easter in April — the Patriot’s Day storm — cut a new inlet through North Beach and wiped out several beach houses. “North Beach Island” is born. Down the coast, South Beach finally connects to South Monomoy, making the first land bridge from the mainland to the island in many decades.
Between 2007 and 2012, the shape and direction of the inlet above North Beach Island changes, while the south end of the island hooks and migrates toward the town. By 2013, the Valentine’s Day storm had cut open yet another new inlet through South Beach. From 2014 to 2020, the contours of North Beach, South Beach, and Monomoy all fluctuate in reaction to nor’easters and the changing flow of water through the new inlets.
According to Graham Giese, the patterns of barrier and inlet evolution shown in this time series have been going on for at least the past three hundred years, and perhaps longer. As a coastal geologist at the Provincetown Center for Coastal Studies, Giese has worked with colleagues over the past three decades to reconstruct the shape of the Nauset-Monomoy system from old maps and navigation charts, satellite images, beach surveys, and aerial photographs. (A map from 1891 is shown below.) Researchers have identified a local cycle of beach development and migration that repeats roughly every 150 years, though the pattern was likely set up several thousand years ago.
The landmass called Cape Cod was laid down at the end of the last Ice Age. As the Laurentide ice sheet retreated and rivers and streams surged, they dropped sediment and carved the landscape. As sea level rose over the past 10,000 years, the ocean ate at the glacial deposits that lay as far as four miles offshore of the present coast. Sea cliffs — some towering over 100 feet high — were created by wave action, while strong winds produced great dunes. These features are protected today in the Cape Cod National Seashore.
In the years since European settlers began making coastline maps, the cyclical pattern of erosion and barrier beach movement has been pretty consistent. “The Nauset-Monomoy system is more in its natural state than most other barrier systems,” Giese noted, because there are very few jetties and other structures interrupting the natural flow.
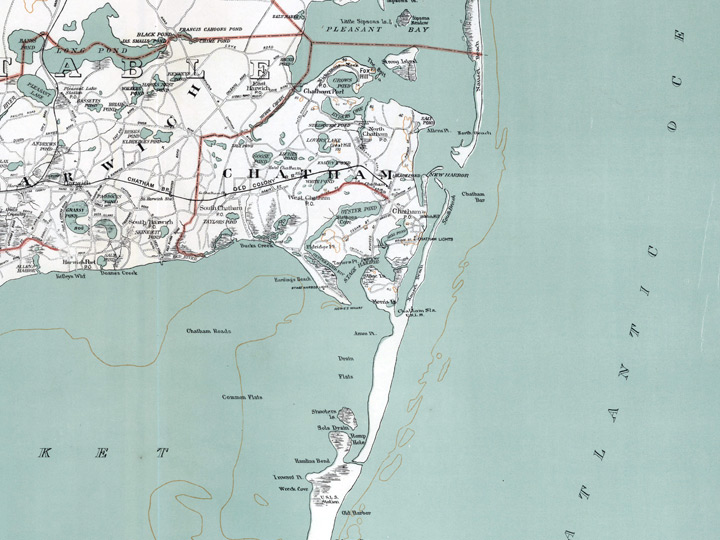
Massachusetts Atlas Plate No. 9, from 1891, shows some familiar and some different patterns along the Chatham shoreline. (Archived by the David Rumsey Map Collection.)
The cycle typically consists of a breach in North (Nauset) Beach; the southwest migration of the new barrier island (that detached in the breach) toward Monomoy; the re-growth and slow elongation of North Beach; and a new breach. Another sub-pattern to the south involves the extension of the North Beach barrier to a point where it overlaps North Monomoy and cuts off the sediment supply. This breaks the Monomoy into smaller shoals until a sediment supply from the north can nourish the island again.
Depending on your location along the coast and your timing, the movement of sand around you may be driven by ocean waves or by tides. Waves usually dominate, promoting longshore transport. High-energy open-ocean waves from the Atlantic crash into the Nauset-Monomoy barrier system at various angles, scouring the sandy glacial leftovers and creating currents that run parallel to the shore.
“Sand grains carried by the rush and backwash of the waves are moved along the beach in a sawtooth fashion,” wrote coastal geologist Robert Oldale of the U.S. Geological Survey. “Longshore currents and longshore drift are generally considered to be constructive processes and not significant in coastal erosion. They are the continuing processes that nourish the beach and carry sand along the shore so that the spit grows in length.”
When the channels behind the barrier islands and spits grow long enough, tides can take over and create differences in water levels between the ocean and the bay, changing the flow of currents and replenishing sand. And storms play a role in determining when and where the barriers will split open, pounding the weakest parts of the system and changing the point of exchange between the bays and the open ocean.
Erosion along the Nauset-Monomoy barrier system can move the beach anywhere from 1 to 6 meters a year (3 to 20 feet). Sea level rise — a least one foot in the past century — is also slowly taking away the beachfront. Between the two, the sea could reclaim Cape Cod in five or six thousand years.
“Many people view coastal erosion as a problem that needs to be addressed and, if possible, prevented,” wrote Oldale. “However, storm and wave erosion along the shore of Cape Cod has been going on for thousands of years and will likely continue for thousands of years more. It is a natural process that allows the Cape to adjust to rising sea level. Erosion is only a peril to property. If we build on the shore, we must accept the fact that sooner or later coastal erosion will take the property away.”
Editor’s Note: Special thanks to Graham Giese, Provincetown Center for Coastal Studies, for image interpretation, text review, and background on the Nauset-Monomoy barrier system. Thanks to Steve Mague and Ilya Buynevich for reviewing the text.
