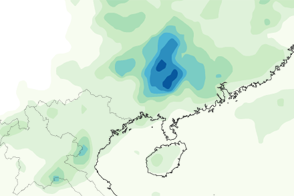
This color-coded map shows rainfall amounts in and around southern China May 10–16, 2012.
Published May 17, 2012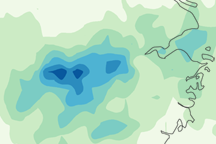
This color-coded image shows precipitation amounts in the vicinity of Shanghai, Taiwan, and the East China Sea from May 19 to 25, 2010. Heaviest rain is blue and lightest rain is pale green.
Published May 28, 2010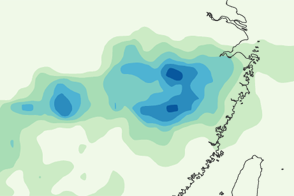
This color-coded image shows rainfall amounts over southern China from June 3 to 9, 2011, when heavy rain inundated multiple provinces.
Published Jun 13, 2011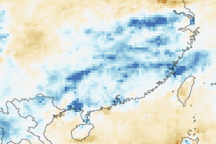
A broad swath of usually intense rainfall covers flooded regions in southern China and northern Vietnam in this rainfall anomaly image.
Published Jul 6, 2009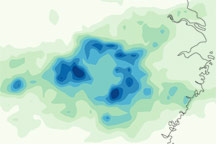
This color-coded image shows rainfall amounts around the city of Shanghai from July 6 to 12, 2010.
Published Jul 14, 2010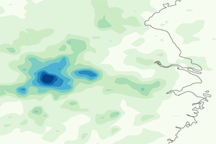
Heavy rain around Shanghai from July 15 to 21, 2010, exacerbated ongoing flooding and landslides.
Published Jul 22, 2010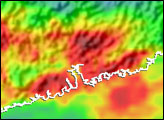
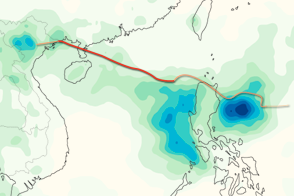
This color-coded image shows rainfall totals and the storm track for Typhoon Kai-tak in August 2012.
Published Aug 20, 2012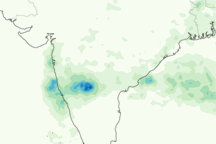
This analysis shows rainfall totals across southern India from September 29 to October 5, 2009. The heaviest rainfall appears in blue and the lightest rainfall appears in pale green. Rain extends from the Arabian Sea to the Bay of Bengal.
Published Oct 6, 2009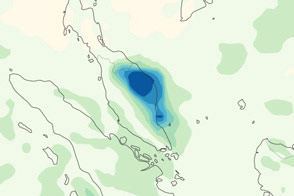
This color-coded map shows rainfall amounts in Malaysia and Indonesia from December 24, 2012, to January 6, 2013.
Published Jan 8, 2013alert message
