

Last year I wrote a blog detailing the University of Washington team’s Surface Salinity Profiler so I will not repeat myself here. The primary function of this instrument (towed outboard of the ship’s wake) is to gather detailed information on the temperature, salinity, and turbulence structure in the upper meter of the ocean. This is notoriously (for oceanographers) difficult to do directly from the ship because the ship mixes up the water immediately around it.
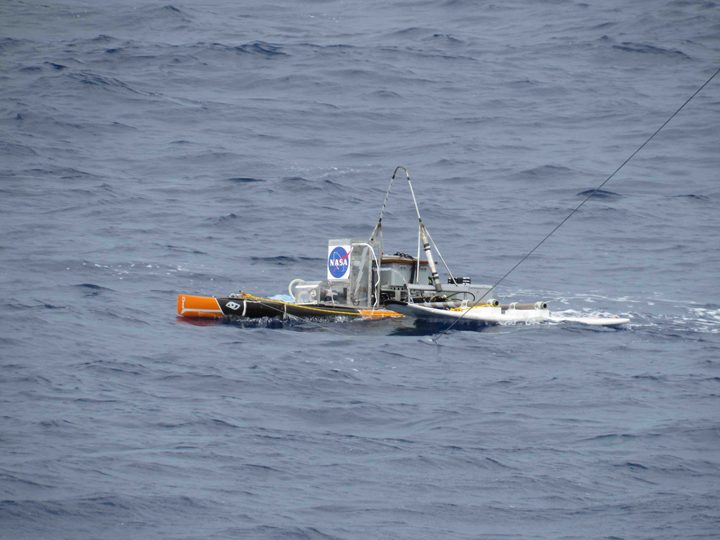
The Surface Salinity Profiler is towed outboard of ship wake using a special bridle.
The SSP is basically a re-purposed paddle board with an outrigger (surfboard) and a keel bristling with instruments. It looks a bit like a Frankenstein monster from a beach town surplus yard, but in actuality is a engineering marvel perfect for gathering data in the upper meter of the ocean.
In the year since we last deployed the SSP, more instruments have been added to improve its capability. It now has its own current profiler and improved turbulence (microstructure measurement) capability.
The SSP caused some heartache for a few days because of water leaking into the box containing the onboard computer. It is amazing to see the talent of many hands solving the problem. The box was completely disassembled, waterproofed, and reassembled (better than before) in less than 24 hours. Problem solved. It was a stroke of luck that the computer survived the moisture insult. However, the wifi capability from the SSP to the ship was lost, but that is not essential for successful data collection.
So, what is so important about gathering data in the upper meter of the ocean? This is where we find find buoyant freshwater from rainfall before it mixes down into the water column. Large areas of the tropical ocean have significant freshwater input. When seen from space these areas look very fresh – and no one suspected salinities so low because almost all other methods of profiling salinity in the tropics miss the upper few meters of the ocean. So, with SPURS-2 and SSP we get to resolve the apparent differences between what we see from space and what oceanographers “thought they saw” for decades. Both observations are correct – traditional oceanography had just missed the fresh layer close to the ocean surface! That puzzle is now solved and as science always does, it is now a matter of digging into the details! How does the freshwater from rain mix into the ocean. Does rain itself increase mixing or decrease mixing (oceanographers are hotly debating that question!)?
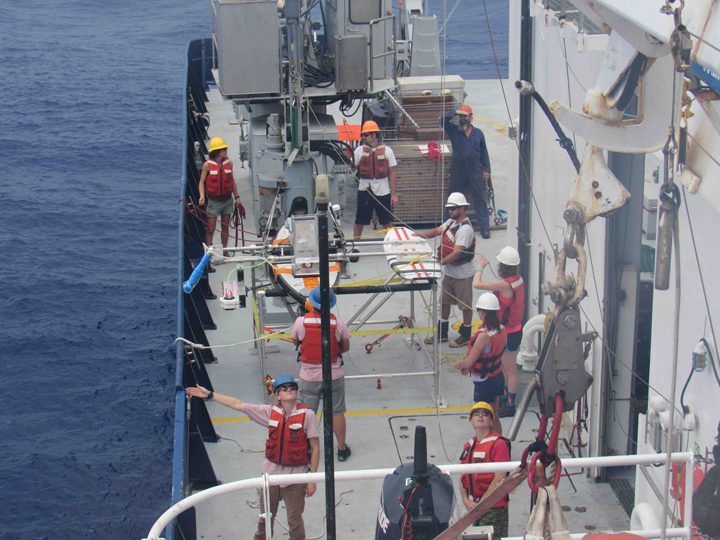
The SSP team preparing to launch the Sea Surface Profiler.
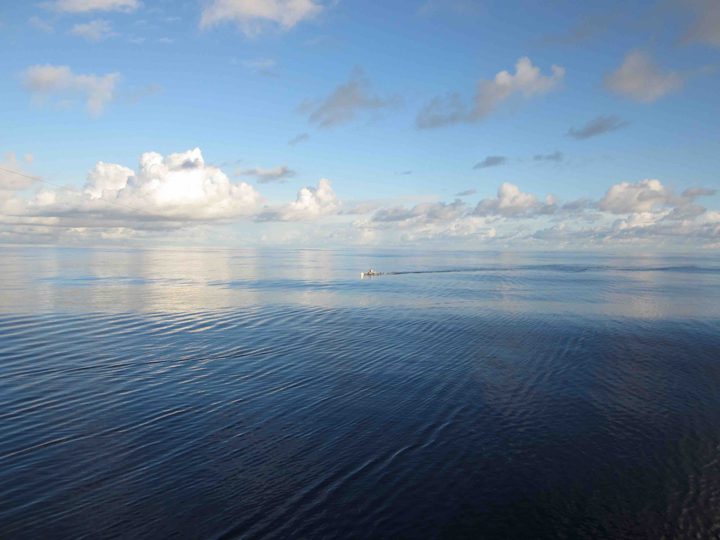
The SSP in calm sea – far from ship during full deployment.
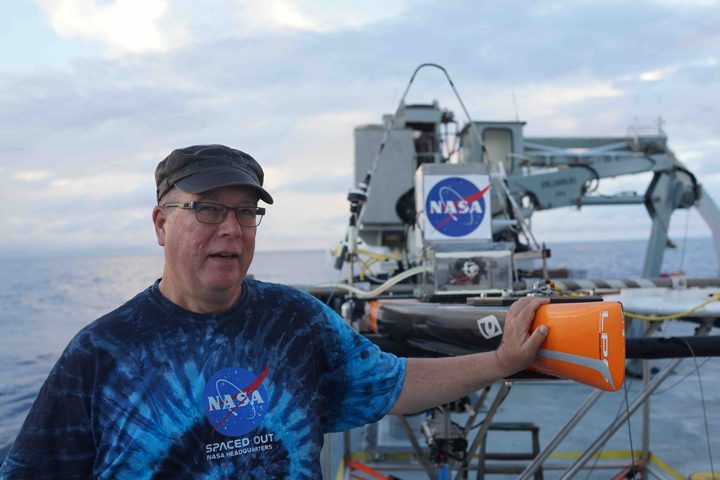
Eric Lindstrom with the Surface Salinity Profiler. Photo by David Ho.
Along with SSP, we profile salinity in the upper 500 m of the ocean about every 30 minutes using an Underway Conductivity, Temperature, and Depth (UCTD) profiler that can be deployed from the moving ship (and is) whether SSP is deployed or not. That instrument gives us the “traditional” large-scale view of the temperature and salinity field (salinity is derived by a formula from the conductivity and temperature of the water).
The are also a couple of thermosalinograph (TSG) systems built into the bow of the Revelle. They provide continuous data on temperature and salinity from water intakes at 2, 3, and 5 m depths.
Overall, there is much “integration” of various data sets required to assemble the full picture of salinity in the upper 5 meters of the ocean – using SSP, the salinity snake, thermosalinographs, UCTD, and detailed rainfall maps (future blog!). SSP plays the central role in untangling the physics of rain, ocean mixing, and salinity stratification.
Meanwhile, the egret pair appears to have adapted to life on Revelle.
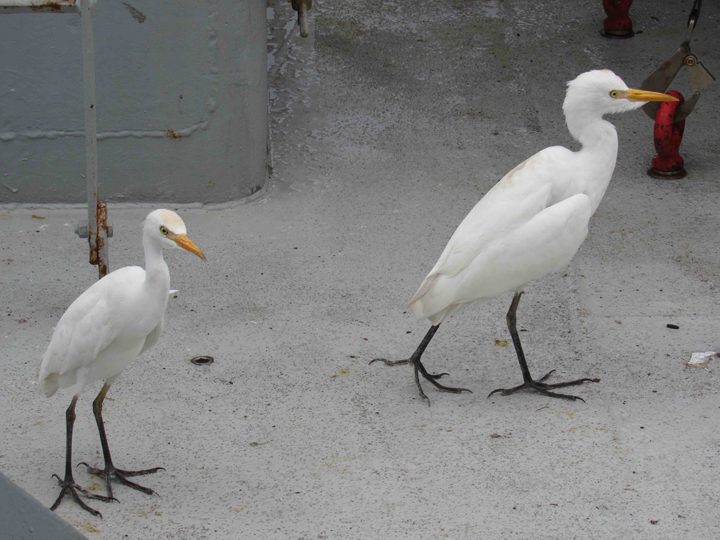
The egret pair has adapted to life on Revelle.
There is something about being at sea, totally surrounded by blue sea and blue sky that demands blogging about blue. I’ve done it before (see: The Moods of Sea and Sky; Shades of Blue) and from the looks of today’s blog, I’ve doing it again. Darn it.
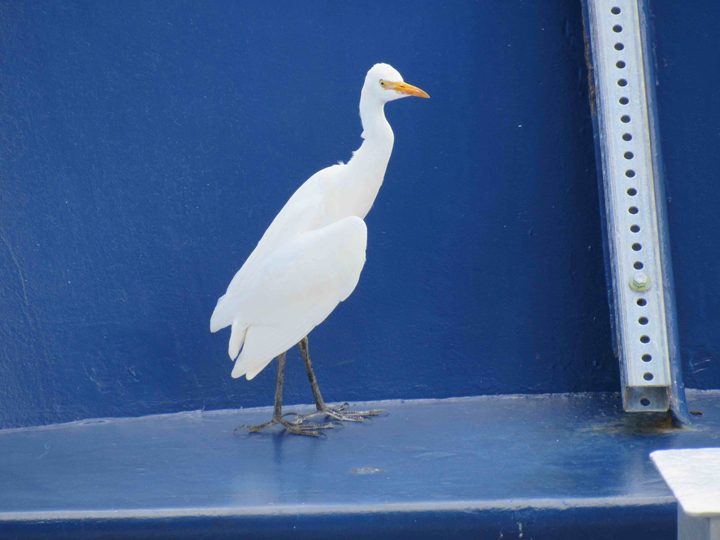
A Great Egret on the R/V Revelle at 10N, 125W.
It started this time with me thinking about blue birds – not literally a blue bird, but birds feeling lost and blue. Yes, that is probably stupid anthropomorphism, but it is the kind of conversation that gets going after weeks at sea. We have not one, but two, Great Egrets on the ship right now. I am sure they are very blue, even though they are perfectly white in color. Their usual home is possibly some cushy Florida suburban swamp stalking frogs and small fish. The summer is ending so they decide to head off to the other summer home in the Amazon, where you can snack on frogs and small fish. Then, bam! Some big wind comes along and all you can see day after blue day is blue sky and blue water. And this is likely some kind of Alice in Wonderland experience for a lost freshwater fowl – the fish are flying and the frogs look like sharks, and all of a sudden the water is 2 miles deep instead of 2 inches deep! Those long slim legs for wading are way too short now.
Now we have a tally of two “lost” species this voyage. The other, the Peruvian Booby, has “Boobied Up” and joined some sexy Blue-Footed Boobies for some hybrid action out over the horizon. Hey, that is a real thing, look it up!
I’m afraid there nothing we can do on Revelle for the Great Egret blues. I suppose they might tough out the steel decks and weird humans until San Diego and find some cousins at the Sea World ponds? Kinda depressing!
Really readers, blue is the color of oceanography! Well, at least when it is sunny. At night it is just black. If it is totally cloudy we might call the ocean “steely blue.” The sky then is, well, totally cloudy, and you guessed it, shades of gray. Isolated clouds are white, of course. How all the white clouds together become gray is a mystery (not really, but we are talking blue here today).
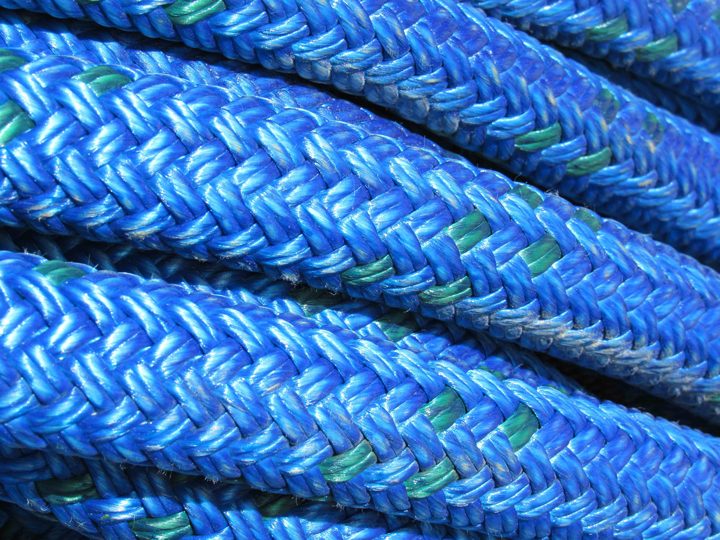
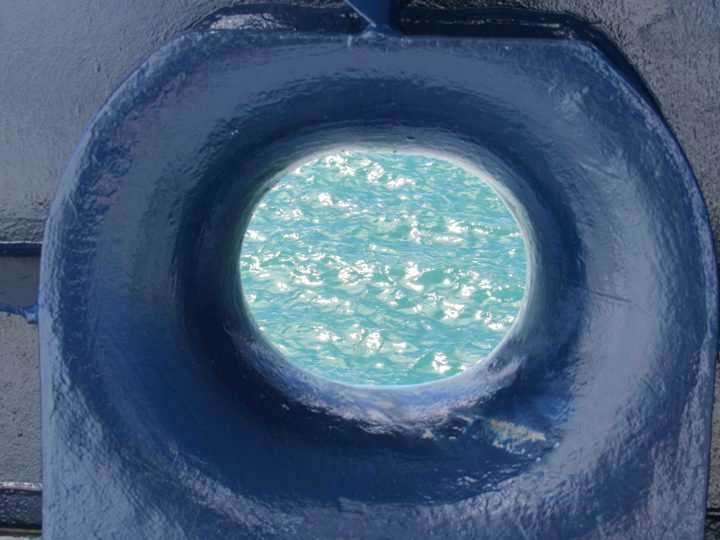
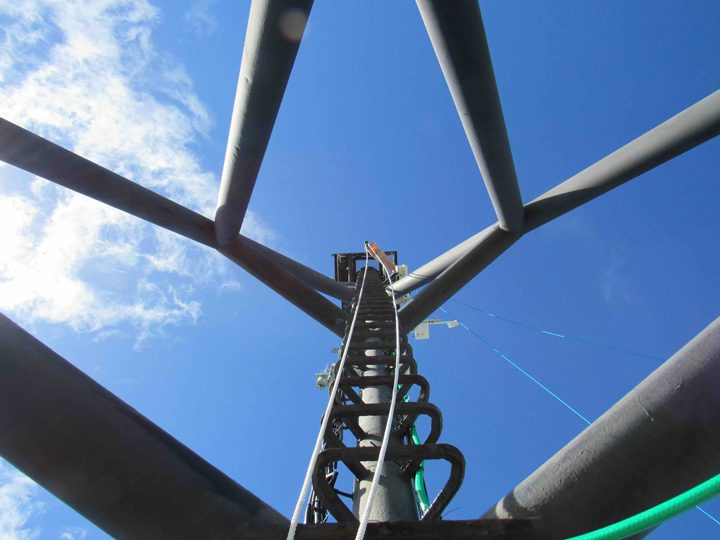
Rather than bore you with pictures of blue sea and blue sky today, I am sharing some more artsy photos in the blue theme. Its not hard to find such photos on a ship that is painted blue. I swear, a contrasting color would have been easier on the eyes! Take note UCSD. Could you go for a nice shade of puce?
Happy blues to all!
Technology is a wonderful thing until its dark side is appreciated. I have written about plastic in prior blogs. I’ll probably have to write about plastic and the ocean for the rest of my life so more people are aware of the terrible toll that plastic has on marine life and the entire marine ecosystem.
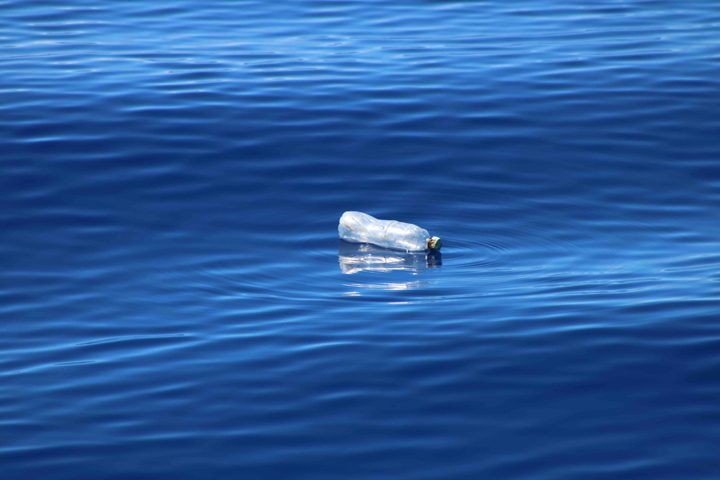
A plastic bottle floating in the open ocean is not a rare scene.
Over the SPURS expeditions (Atlantic and Pacific Oceans) from 2012 to today we have seen much visible plastic in the open ocean. This month on Revelle, people have remarked on how little plastic we have seen. Likely that is just luck, because we know its out there.
As a relatively modern material technology, we humans see plastic, for the most part, as a critical and necessary element of our lives. It’s hard to imagine life without plastic, nor should we.
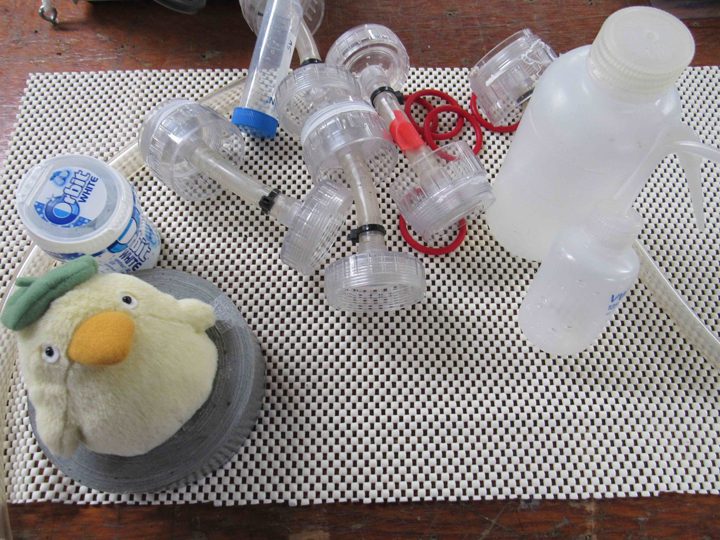
We have lots of plastic items on the Revelle.
We just need to pay more attention to the fate of all our plastic goods. Plastic is ubiquitous and its dark side is that it is a very long-lived substance. For plastic there is no corrosion, dissolving, or biodegrading (thankfully, perhaps, biodegradable plastic is now being invented!). The problem for the ocean is that about 8 million metric tons of plastic are estimated to enter the ocean each year. It is thrown away, washed away, blown away, and generally forgotten as it disappears into the ocean. It is illegal to dump non-biodegradable materials at sea and modern ships follow these international guidelines. The primary source of plastic in the ocean is not dumping at sea but plastic escaping from the land. We have the ways and means to control our plastic destiny if only we could control its disposal at the source!
Recent calculations project that by 2050 there be more plastic in the ocean than fish. Wherever you look, the facts about plastic in the ocean are alarming. The emerging science continues to raise new concerns. Are plastics changing the microbial ecosystem of the ocean? Is there any life form in the ocean that will not be impacted by plastic?
Much of the news one hears about plastic in the ocean relates to “garbage patches” near the center of all the ocean subtropical gyres. This is where surface circulation converges and floating material can accumulate. We can easily imagine what makes up these patches – it is the same material that washes up on islands and coasts worldwide – plastic bags, water bottles, fishing gear, styrofoam, and the detritus of modern life. One imagines the worst – growing islands of plastic debris – for example the well-known “Pacific Garbage Patch” between California and Hawaii. Sadly, there also “waves” of additional debris from tsunamis. Events in the Indian Ocean in 2004 and Japan in 2011 injected enormous amounts of coastal civilization into the ocean.
In reality some visible accumulations of large debris do occur, but they are difficult to find in the vast expanses of the ocean. It may be critical that we focus less on the cosmetic problem of visible garbage and focus more attention on the hidden problem of plastics. By hidden problem I mean this; if one tows a fine mesh net, you will find plastic almost everywhere in the ocean, today! In the ocean plastic is gradually broken into smaller and smaller pieces – eventually becoming what is known as microplastic (less than 5 mm in size). Microplastic becomes fully mixed with the microscopic plants (phytoplankton) and animals (zooplankton) that are the primary food source for ocean life-forms as diverse as sponges, anemones, small fish, and baleen whales. Life and death in the sea is becoming inextricably linked to plastics. Finding microplastics in sea life is the new normal.
The NASA Physical Oceanography Program assists in the study of plastic pollution of the ocean in a number of ways. With present satellite technology it is nearly, if not impossible, to detect from space plastic in the ocean. If dry and if large enough, plastic would have a sufficiently unique spectroscopic signature that remote sensing might be possible. However, most plastic and debris in the ocean is neither large nor dry, precluding direct detection. NASA Earth observation assets are mainly used to track the surface currents and wind responsible for the movement of marine debris. This data, along with sophisticated models of ocean circulation and debris characteristics, do account for the primary features of plastic and marine debris accumulation and distribution. Oceanography, in general, can predict where one might look for open ocean garbage patches (convergences), what accounts for significant differences in types of debris found on different coastlines (windage), and how fast debris disperses from a single source (general circulation dispersion statistics).
What science cannot explain (yet), among many things, is the mechanical and chemical degradation of plastic to microplastics, the fate of plastics and debris in the marine ecosystem, or fully identify the sources for all the plastics found in the ocean. Much research is yet to be done to understand the new ocean habitat known as the plastisphere.
As individuals we must raise awareness of plastic recycling and re-use. Proper disposal of plastics is critical for the health of the ocean.
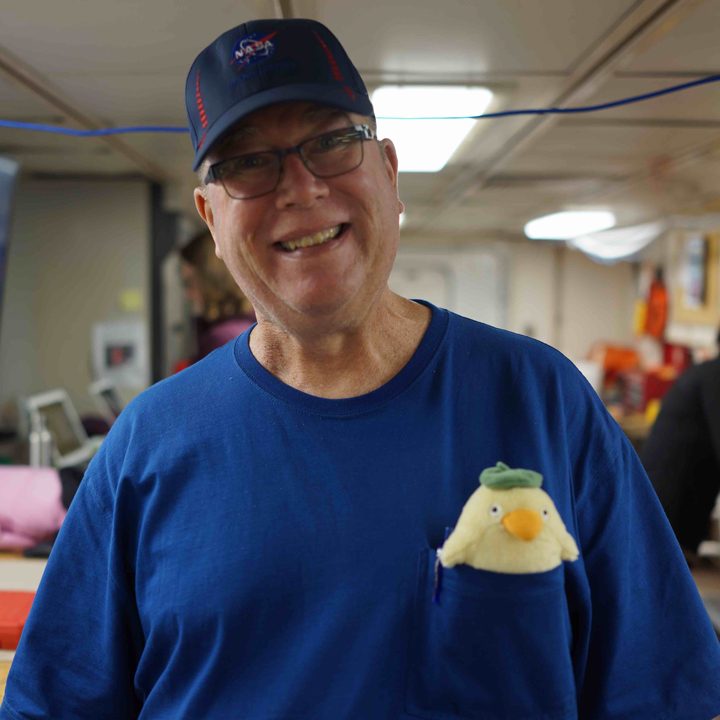
Your blogger, Eric Lindstrom, with Ootori-sama.
One of the key pieces of the puzzle we seek to solve in SPURS relates to turbulence. We really need a deeper knowledge of how turbulence near the ocean surface mixes the surface waters (See prior blog: What is ocean microstructure and why study it?). Rainfall here freshens the ocean, but mixing from saltier waters below and from north and south make the ocean saltier. So, some of the key observations in SPURS are measures of turbulence. Microstructure measurements on the Surface Salinity Profiler (SSP) provide a direct measure of turbulent mixing in the upper meter of the ocean (See prior blog: Chasing the Elusive Surface Salinity Profile).
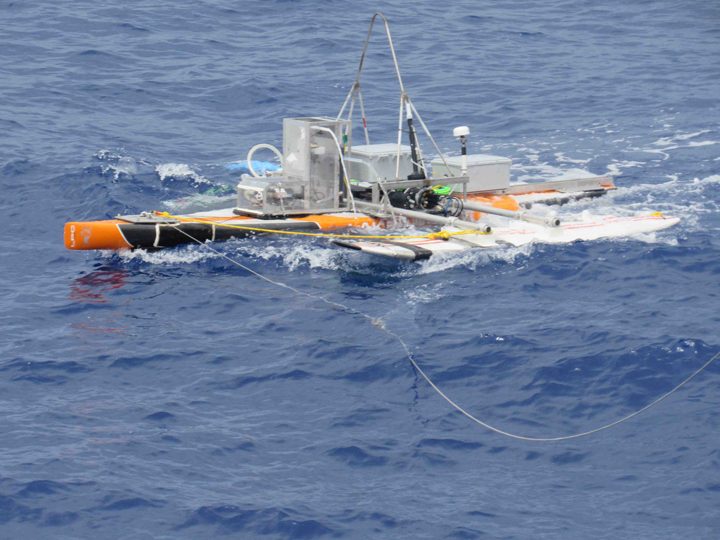
Surface Salinity Profiler.
Cunningly, the APL team is using another indirect measure of turbulence to simultaneously support and enhance interpretation of the SSP measurements. The Controlled Flux Technique (CFT) is simple in concept and provides a good qualitative measure of the increases and decreases of mixing at the ocean surface as we tow the SSP.
The CFT concept is to shoot a high power laser pulse at the ocean surface, heating the surface instantly by about 3C. An infrared camera (sensitive to temperature variations) photographs the spot where the laser hit the surface and using 25 snapshots per second tracks the cooling of the patch back to normal over the course of about one second. The speed at which the temperature returns to normal is a very good estimate of the amount of turbulent mixing at the surface. More turbulence means a fast decay to ambient temperature. Just the qualitative knowledge of the ups and downs of turbulence provided by CFT method is an enormous help in interpreting the SSP turbulence data.
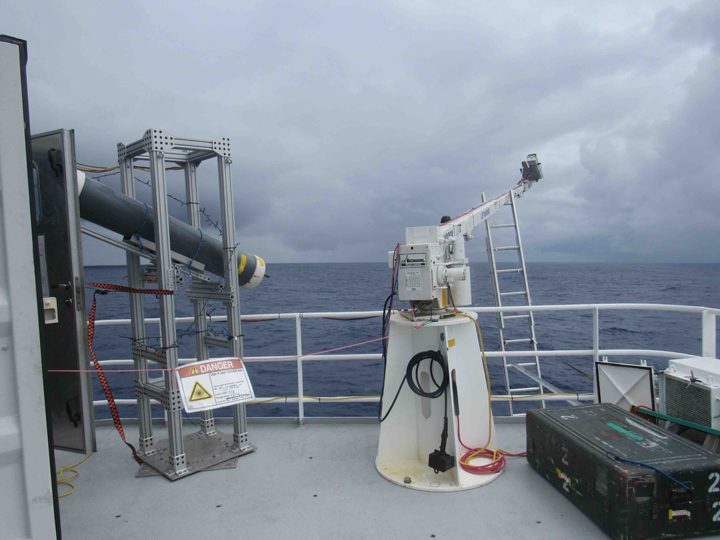
Laser (left) and infrared imager.
The laser in use is big and powerful, a 125Watt CO2 laser that shoots 100 millisecond pulses of 10.6 micron (wavelength) light at the surface. The laser light cannot penetrate water or flesh but its purpose is to quickly raise the temperature of the surface of the ocean which means that it can also burn a person or ignite a sheet of paper. Scientists can locate the beam by waving a two by four in the air. When the laser beam hits the wood there is a puff of smoke and a burst of flame. Ah!! There is the beam! We are all safe on the ship because the laser is pointed out away from the ship. The infrared laser beam is almost totally absorbed by the seawater so there is no danger of reflection.
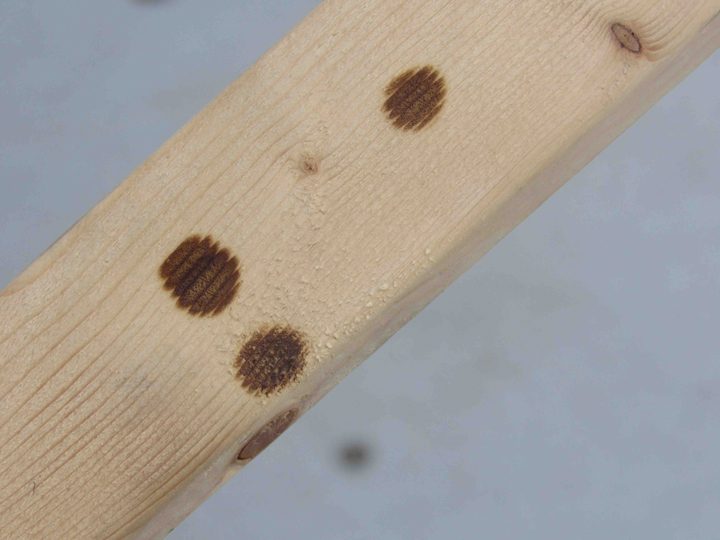
Three scars of laser pulses on a two-by-four.
The camera imaging the sea surface generates large volumes of data – about 1 Gigabyte per minute of use and we are sometimes making 10 hour runs every day! Bill Asher from UW Applied Physics Lab is running the CFT experiment and has brought petabytes of data storage. Interpretation back home will keep his desktop computer grinding for months!
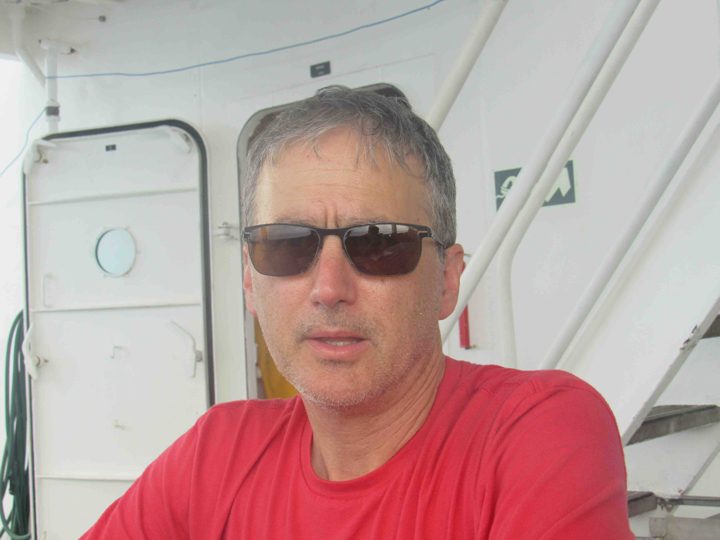
Bill Asher explains the Controlled Flux Technique.
Lucky for us we have a data processing mascot aboard the trip to assist Bill and other SPURS-2 scientists. Ootori-sama is a kind spirit duck whose “water karma” will assure good luck in all water-related data processing. Its is fun for us to inject some humor and superstition into shipboard life (See prior blog: Hello, Knorr? It’s The International Space Station Calling) especially around Halloween!
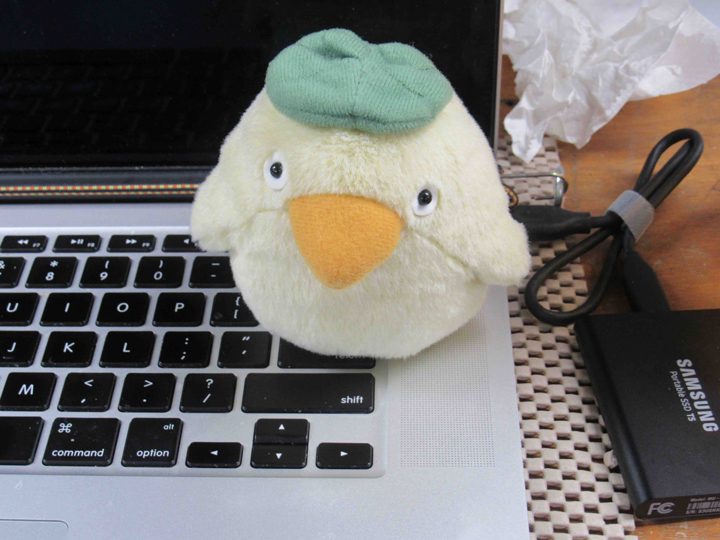
Ootori-sama working on CFT data processing.
The science to come out of the CFT analysis and the SSP in SPURS-2 is pretty simple. Conventional wisdom holds that rain INCREASES turbulence at the ocean surface. Last year’s work with CFT and SSP hints at the contrary idea – that rainfall may reduce wave micro-breaking at the ocean surface an REDUCE turbulent mixing. Fresh water tends to stabilize the ocean surface because the fresh water is more buoyant than salt water – but it also seems to have additional ways and means to reduce turbulence. Knowing these facts is key to modeling upper ocean salinity and interpreting the salinity measurements from space. How fresh water mixes into the ocean via rainfall is essential information for understanding the water cycle on the planet.
Aboard Revelle we prepare for Halloween. Pumpkins were distributed for a carving competition. Pumpkin slashing, drilling, and maiming is in full swing. Halloween decorations are appearing and costumes are being considered.

We arrived at the site of the NOAA mooring at 11N, 125W and recovered the entire string of equipment. As with most moorings in mid-ocean, it had acted as a Fish Aggregation Device (FAD) and some tuna and mahi-mahi were caught for our dinner. We recovered two Wave Gliders, visited the central SPURS mooring at 10N, 125W (see video in last blog post), and rendezvoused with a SailDrone for cross-calibration of instruments with Revelle.
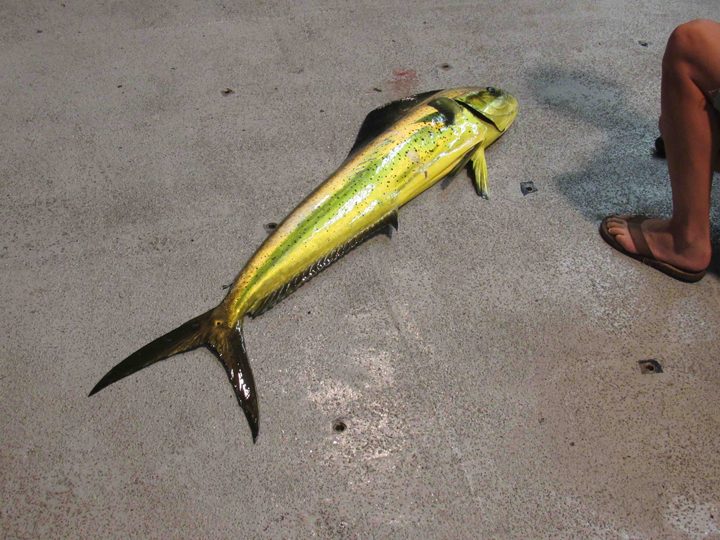
Mahi-mahi caught near the NOAA mooring.
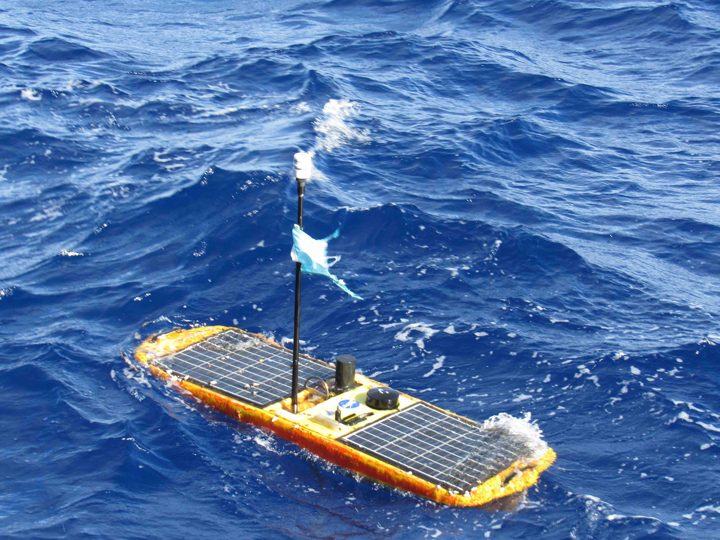
The Wave Glider after 14 months at sea.
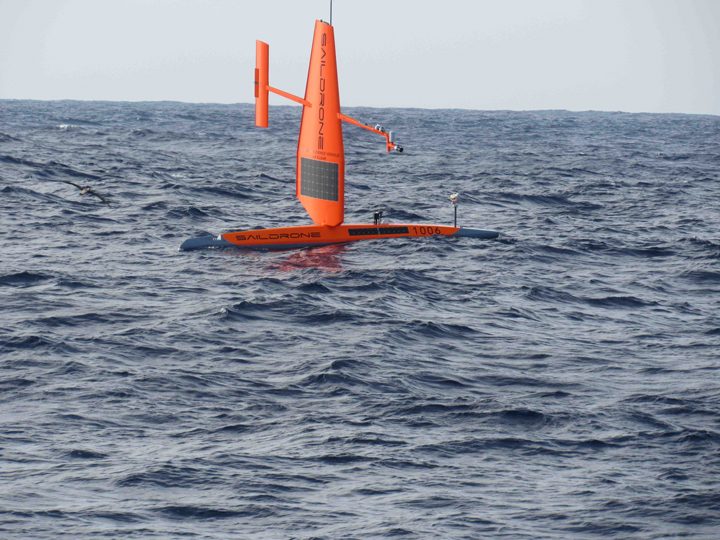
Rendezvous with the SailDrone.
Because it is a issue for all those aboard the ship, I thought I would try to explain our communication “challenges” for you as my “topic of the day.” Although communication between those at home and those on a ship has improved over the decades, being in mid-ocean still has quite a few communication challenges.
Clear voice communications via satellite phone is possible but the price (~$10/min) is prohibitive except for emergencies and critical needs. Some institutions send their staff to sea with their own personal satellite phones (not NASA). There are also Voice over Internet Protocol (VOIP) calls (those calls are limited to about 10 minutes) but the quality is poor enough that it is recommended only for those with patience for monosyllabic interpretation.
The preferred method of communication is email. It too is transmitted via a shared (with the oceanographic fleet) satellite link. We have strict rules as to size of email attachments (2Mb).
For research and business we can access the internet as well, but need to be aware that there are daily limits on our use of the shared satellite resources – 150Mb of download per day per person. This is easily used up by certain kinds of downloads and email programs, so everyone has to tighten up there computer habits while aboard ship. It reminds one of using the old slow “dial-up” connections that were common before cable and wifi.
For me, doing the blog, I face the challenges daily. I can send text just fine, but I have to downsize all photos before transmission in order to meet the 2 Mb limit in email attachments. NASA has asked me to provide short movies (15 sec clips) as well. These have to be transmitted by yet another method to a public FTP site at Scripps in San Diego so NASA can collect them there.
Critical science data files are transmitted to and from the ship like the movie clips, by dropping them in special folders that process the data transmission via satellite more efficiently than email programs. It is very helpful to us on the ship to have satellite and model data processed by our “dry team” at the NASA Jet Propulsion Laboratory in Pasadena, CA. They transmit files to us daily in what is called the “tarball.” (See previous blogs: The Sticky Mess in the Tarball; Modeling And The Dry Side of SPURS).
Fred Bingham is on the ship as our SPURS data manager and he acts as the clearing house for information requests from the dry team. Ultimately, he assembles SPURS data sets into a well-documented package that can be archived by NASA and analyzed by the scientific community in years to come as a single complex but comprehensive data set. (See previous blog: Managing SPURS Data)
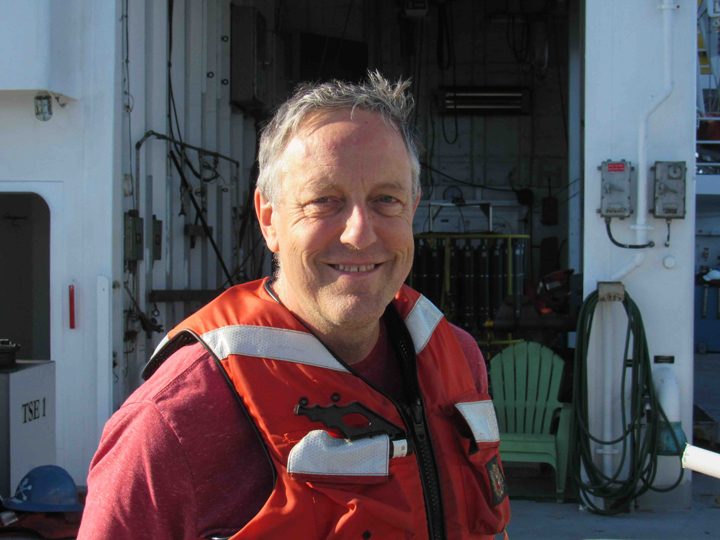
Fred Bingham, SPURS data manager.
Oceanographic data is collected and preserved in a number of ways. Some of our instruments and moorings transmit data home in real time independently. However, some data is internally recorded in an instrument sitting in the ocean depths and can only be saved for posterity when we recover the instrument (that is one objective of this SPURS-2 expedition – gather up all the instruments with their valuable data).
As you can see, being at sea separates us into our own quiet place, linked to the world with “dial-up” speeds and strict limits on the volume of communication. The isolation is embraced by most seagoing scientists as a rare gift in our hyper-connected world.