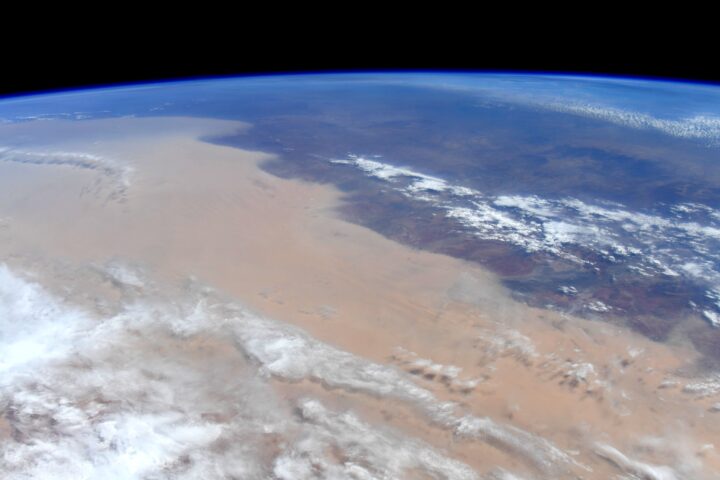
Baked by heat and drought, deluged by rain and floods, scorched by wildfire, and blanketed by dust, Australia has faced several months of extreme weather.
Some of the latest jaw-dropping images come from NASA astronaut Christina Koch. “Australia. Our hearts and thoughts are with you,” she tweeted, along with images of a massive dust storm making its way across the continent and smoke streaming from bushfires in southeastern Australia.
Meanwhile, Jean-Paul Vernier, a senior scientist at the National Institute of Aerospace at NASA Langley Research Center and the lead of a NASA disasters team responding to the fires, has been using data from the CALIPSO satellite to measure something impossible to discern from an aerial photograph, even one taken from space—the height of the smoke. As we reported earlier, the fires are so intense that they have lifted smoke all the way to the stratosphere, something wildfires do only occasionally. (Usually, volcanoes lift plumes to such heights.)
On January 6, 2020, the smoke had reached 19 kilometers (12 miles). Interestingly, it kept rising. By January 13, it was up to 21 kilometers.
“The radiative heating from the soot particles within the smoke makes wildfire plumes particularly buoyant, meaning they will reach higher altitudes in the stratosphere and stay there longer than material from a volcanic eruption that reaches the same initial altitude,” Vernier explained.
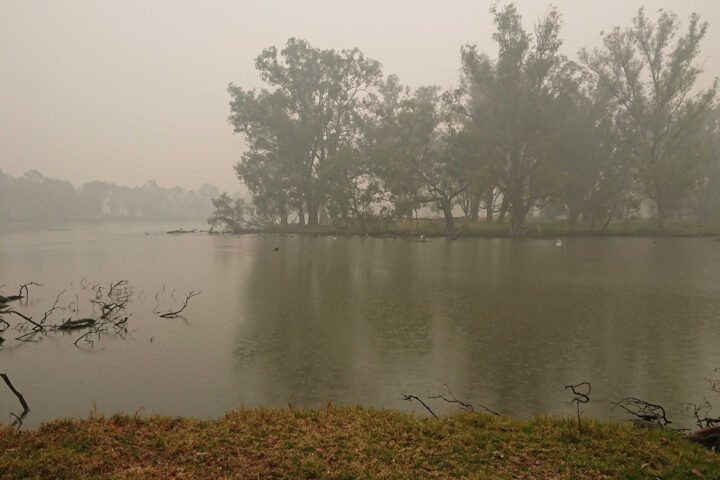
As satellites track Australian wildfire smoke from above, GLOBE Observer citizen scientists have been keeping tabs on hazy skies from the ground.
The photograph above shows smoke blanketing Horseshoe Lagoon in New South Wales on January 6, 2020, a day when clouds limited what sensors on Terra, Aqua, and Suomi NPP could observe as they passed over.
The video below, based on photographs taken by GLOBE citizen scientist Glenn Evans, juxtaposes satellite images and photographs taken of the sky at roughly the same place and time. The contrasting perspectives underscore how easy it can be to miss the forest for the trees — or, rather, the smoke plume for the clouds — if you aren’t careful. Kristen Weaver, the deputy coordinator for GLOBE Observer, compiled the photos and matched them with the corresponding MODIS satellite images.
Victoria and New South Wales are in the midst of one of the most severe fire seasons either state has seen in decades. After months of unusually hot, dry weather, hundreds of fires have charred an area larger than West Virginia, destroying thousands of homes and resulting in dozens of deaths.
GLOBE Observer is a citizen science project that is part of the Global Learning and Observations to Benefit the Environment (GLOBE) Program. Through a free app for their mobile device, anyone in participating countries can make environmental observations of clouds, trees, land cover, and mosquito habitats that complement NASA satellite observations.
Every month on Earth Matters, we offer a puzzling satellite image. The January 2020 puzzler is above. Your challenge is to use the comments section to tell us what we are looking at, where it is, and why it is interesting.
How to answer. You can use a few words or several paragraphs. You might simply tell us the location. Or you can dig deeper and explain what satellite and instrument produced the image, what spectral bands were used to create it, or what is compelling about some obscure feature in the image. If you think something is interesting or noteworthy, tell us about it.
The prize. We can’t offer prize money or a trip to Mars, but we can promise you credit and glory. Well, maybe just credit. Roughly one week after a puzzler image appears on this blog, we will post an annotated and captioned version as our Image of the Day. After we post the answer, we will acknowledge the first person to correctly identify the image at the bottom of this blog post. We also may recognize readers who offer the most interesting tidbits of information about the geological, meteorological, or human processes that have shaped the landscape. Please include your preferred name or alias with your comment. If you work for or attend an institution that you would like to recognize, please mention that as well.
Recent winners. If you’ve won the puzzler in the past few months or if you work in geospatial imaging, please hold your answer for at least a day to give less experienced readers a chance.
Releasing Comments. Savvy readers have solved some puzzlers after a few minutes. To give more people a chance, we may wait 24 to 48 hours before posting comments.
Good luck!
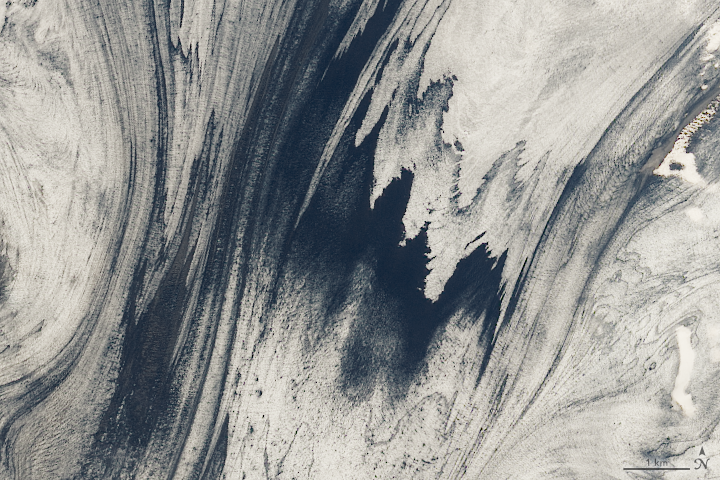
See our “Iceland’s Volcanic Glacier” Image of the Day for the answer. Congratulations to Holger Wille for being the first reader to identify the location and offer a detailed explanation for what makes the area interesting.
Every month on Earth Matters, we offer a puzzling satellite image. The December 2019 puzzler is above. Your challenge is to use the comments section to tell us what we are looking at, where it is, and why it is interesting.
How to answer. You can use a few words or several paragraphs. You might simply tell us the location. Or you can dig deeper and explain what satellite and instrument produced the image, what spectral bands were used to create it, or what is compelling about some obscure feature in the image. If you think something is interesting or noteworthy, tell us about it.
The prize. We can’t offer prize money or a trip to Mars, but we can promise you credit and glory. Well, maybe just credit. Roughly one week after a puzzler image appears on this blog, we will post an annotated and captioned version as our Image of the Day. After we post the answer, we will acknowledge the first person to correctly identify the image at the bottom of this blog post. We also may recognize readers who offer the most interesting tidbits of information about the geological, meteorological, or human processes that have shaped the landscape. Please include your preferred name or alias with your comment. If you work for or attend an institution that you would like to recognize, please mention that as well.
Recent winners. If you’ve won the puzzler in the past few months or if you work in geospatial imaging, please hold your answer for at least a day to give less experienced readers a chance.
Releasing Comments. Savvy readers have solved some puzzlers after a few minutes. To give more people a chance, we may wait 24 to 48 hours before posting comments.
Good luck!
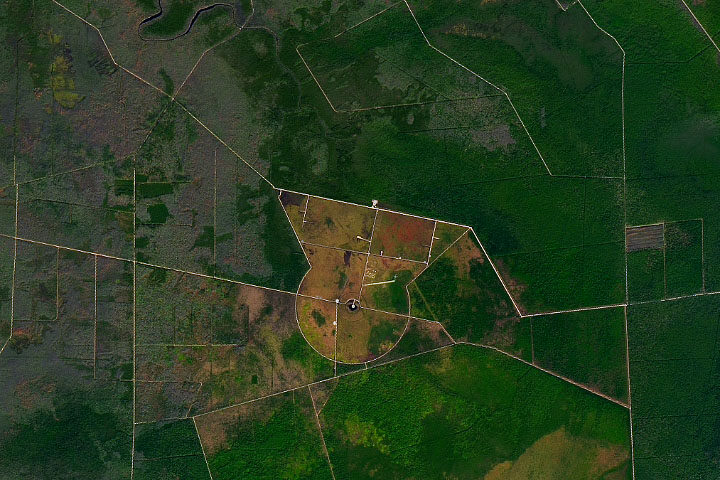
See our “Peninsula of Pocosin” Image of the Day for the answer. Congratulations to Suryakant Verma and Sander Clement for being the first readers to identify the location and offer a detailed explanation for what makes the area interesting.
More than 20 years ago, NASA scientist Ralph Kahn authored a column for the Los Angeles Times anticipating the launch of a new satellite — and ultimately a whole fleet of satellites — that would study Earth.
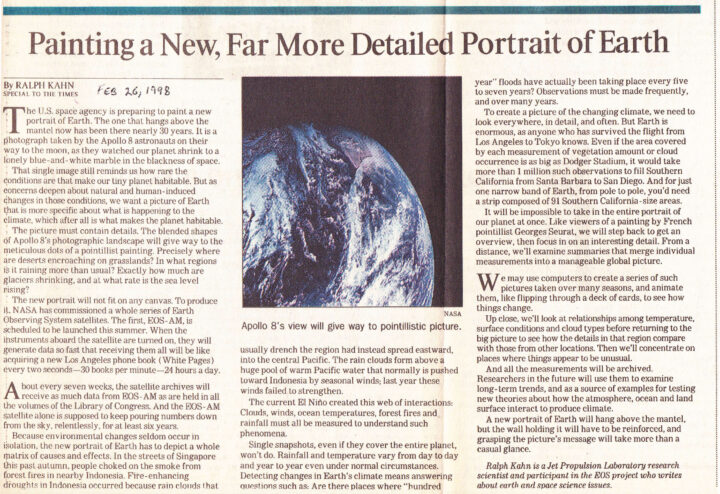
“We want a picture of Earth that is more specific about what is happening to the climate, which after all is what makes the planet habitable,” he wrote. And that picture needed to be rich with detail. “Precisely where are deserts encroaching on grasslands? In what regions is it raining more than usual? Exactly how much are glaciers shrinking, and at what rate is the sea level rising?” he asked.
The first satellite, Terra (originally named EOS-AM), roared into space on December 18, 1999, began collecting data in February and March 2000, and collected its first complete day of MODIS data on April 19, 2000.
“About every seven weeks, the satellite archives will receive as much data from EOS-AM as are held in all the volumes of the Library of Congress. And the EOS-AM satellite alone is supposed to keep pouring numbers down from the sky, relentlessly, for at least six years,” Kahn wrote.
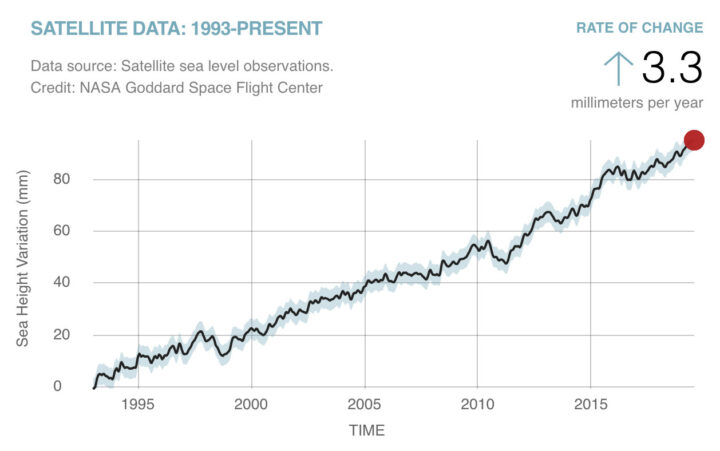
Amazingly, all those numbers from Terra continue to pour down 20 years later. Over time, the flood of data from Terra and several other satellites has turned into scientific discoveries. Bit by bit, the questions Kahn initially posed in his column have been answered.
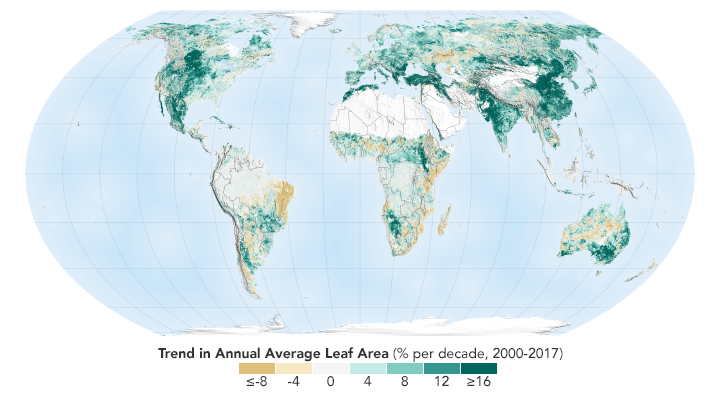
We can say now that sea level is rising at 3.3 millimeters (.13 inches) per year. We can show you a map of where exactly green vegetation has become more common and where it has faded. We can point you to a long-term dataset that will show you precisely where rain has fallen over the past two decades. And we can give you a tour of the world’s glaciers that shows you where they are and many examples of where they are shrinking.
The question to grapple with now: what do we with all this information?
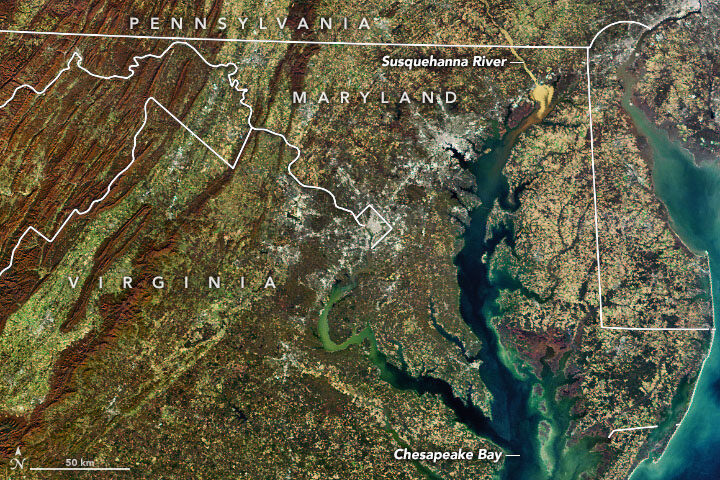
In November 2019, we highlighted this Landsat 8 image showing a glut of sediment flowing down the Susquehanna River into Chesapeake Bay. It was a striking, timely image, but one of the realities of publishing new content every day is that sometimes good information comes in after a deadline has passed.
In this case, Mark Trice, a water quality expert with the Maryland Department of Natural Resources, pointed out a few things about Susquehanna sediment after our story was out that seem worth passing on.
Among them: a link to a recent report that synthesizes and summarizes what scientists have learned about the ecological effects of high sediment flows on the Susquehanna River and the role of the Conowingo Dam. While the dam trapped most sediment and associated nutrient pollution (nitrogen and phosphorus) when it was first built, enough material has piled up behind the dam now that significant amounts of sediment and nutrients now flow past it during storms. A University of Maryland press release summarized the findings this way:
Most sediment and particulate nutrient impacts to the Bay occur during high-flow events, such as during major storms, which occur less than 10 percent of the time. Loads delivered to the upper Chesapeake Bay during low flows have decreased since the late 1970s, while loads during large storm events have increased. Most of these materials are retained within the upper Bay but some can be transported to the mid-Bay during major storm events, where their nutrients could become bioavailable.
The potential impact of reservoir sediments to Bay water quality are limited due to the low reactivity of scoured material, which decreases the impact of total nutrient loading even in extreme storms. Most of this material would deposit in the low salinity waters of the upper Bay, where rates of nitrogen and phosphorus release from sediments into the water are low.
“While storm events can have major short-term impacts, the Bay is actually really resilient, which is remarkable,” said the study’s lead author Cindy Palinkas, associate professor at the University of Maryland Center for Environmental Science. “If we are doing all of the right things, it can handle the occasional big input of sediment.”
Trice’s colleagues at the Maryland Department of Natural Resources (DNR) underscored the Bay’s resiliency to sediment as well when I asked about the recent event. “Although these high flow events routinely occur, the Bay is resilient and continues to show improvement due to the commitment by the Bay watershed partners to have all pollution reduction strategies implemented by 2025 to have a healthy Chesapeake Bay,” said Bruce Michael of Maryland DNR.
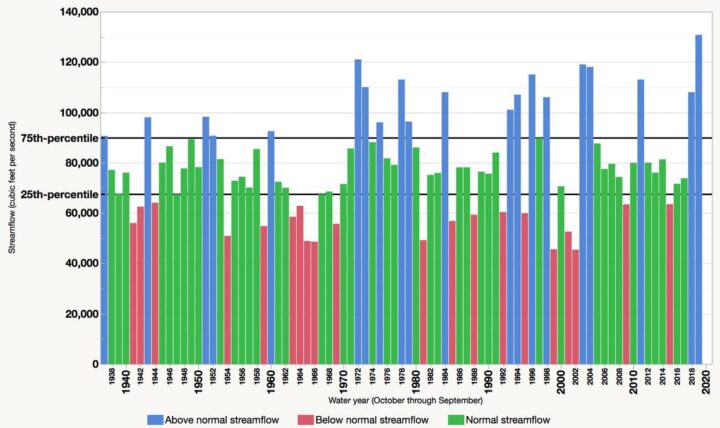
Also worth mentioning: the 2019 water year (October 1, 2018, to September 30, 2019) brought a record-breaking flow of freshwater into the Bay, Trice noted. “The annual average freshwater flow into the Chesapeake Bay during water year 2019 was 130,750 cubic feet per second, which is the highest annual amount since 1937, the first year for which data are available,” the U.S Geological Survey said.
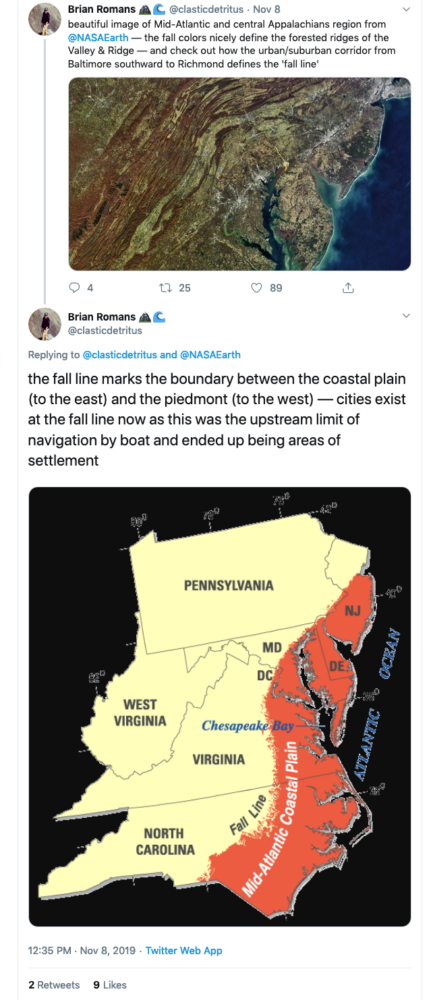
Finally, thank you to Virginia Tech geology professor Brian Romans (@clasticdetritus) for pointing out something about the image that is unrelated to sediment but fascinating: the line of cities and suburbs running from Baltimore, Md., to Richmond, Va., marks the boundary between two key geologic zones: the flat Coastal Plain to the east and the more rugged Piedmont to the west. Interestingly, many cities are located along this “fall line” because rapids prevented boats from traveling any farther upstream when they were first settled.
In a recent article, we described a study of how road networks in the Congo Basin have changed over the past 15 years and how they have affected deforestation rates. Those networks have grown significantly, but not all roads lead to long-term forest destruction. By closing roads when they are no longer needed, people can help avoid permanent damage to the forest.
Though the researchers conducted much of their research via remote sensing and computer work, they also made several trips into the Congo Basin. Their photos shed more light on some of the economic activities in the rainforest.
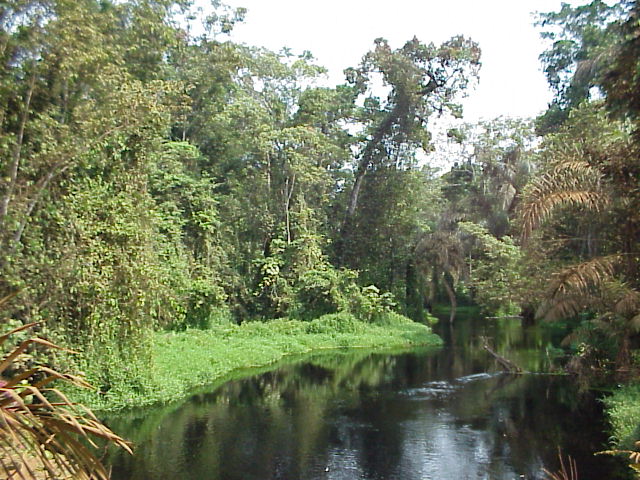
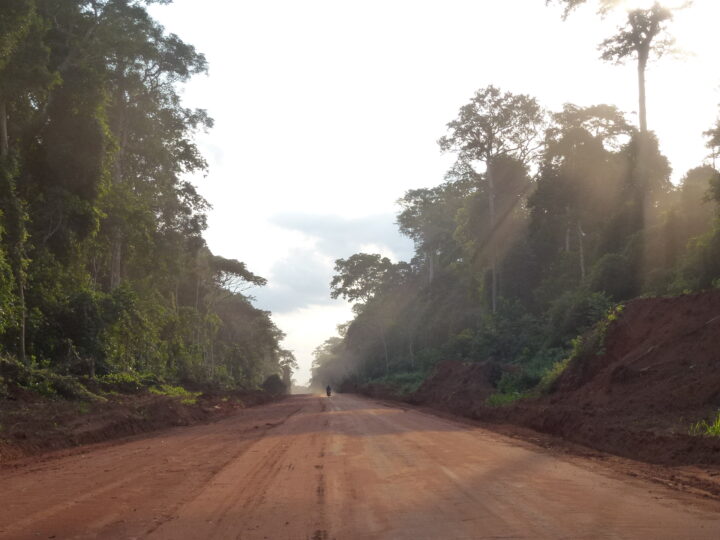
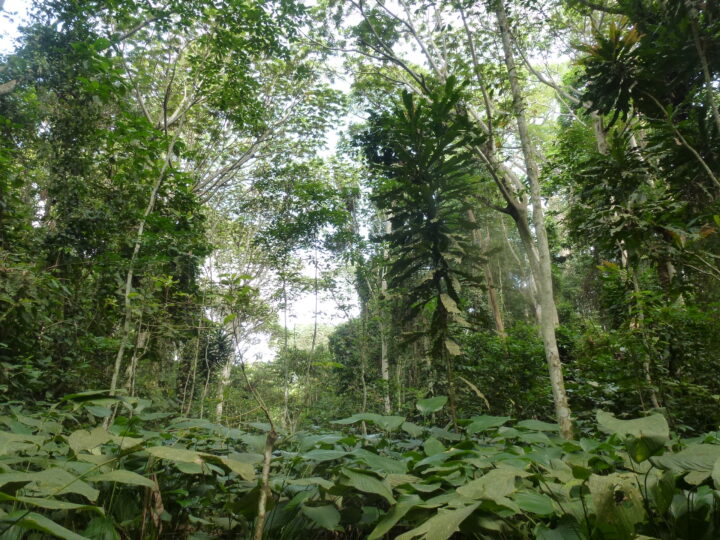
The Congo Basin is covered by tropical rainforests and swamps and is famous for its rich biodiversity. At two million square kilometers (1.2 million square miles), the Congo rainforest is the second largest in the world and about the size of Mexico. The image above shows a forested area near a stream in the Republic of Congo.
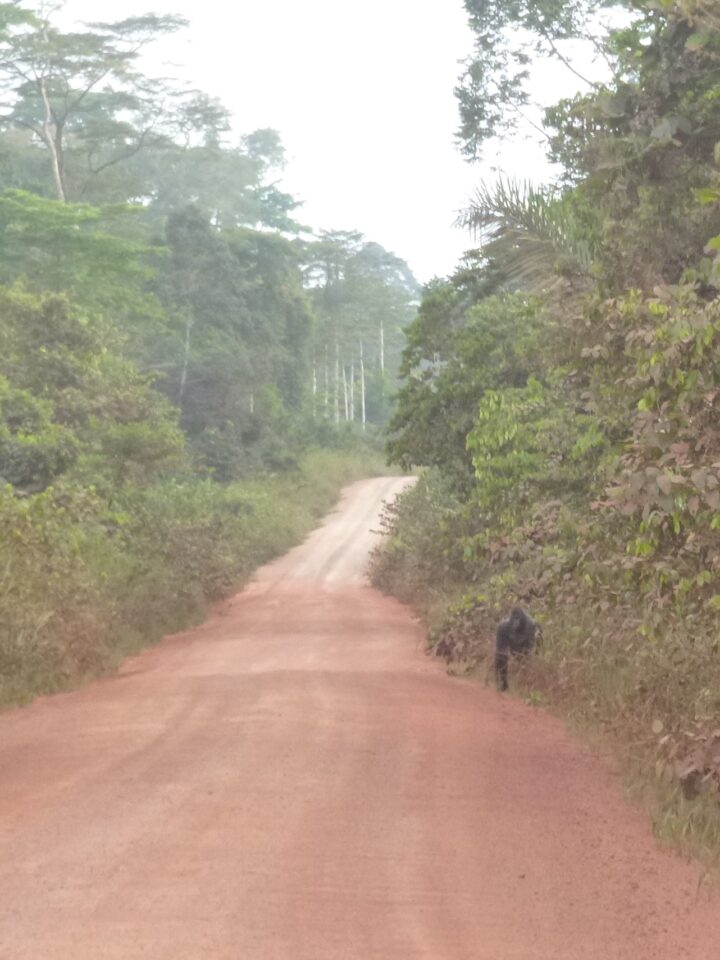
As road networks have expanded, the roads are bringing people deeper into the jungle and closer to wildlife. In general, forest roads lead to more human activity and to unregulated or destructive events, such as poaching, mining, or illegal logging. The image below demonstrates how roads are encroaching on wildlife habitats.
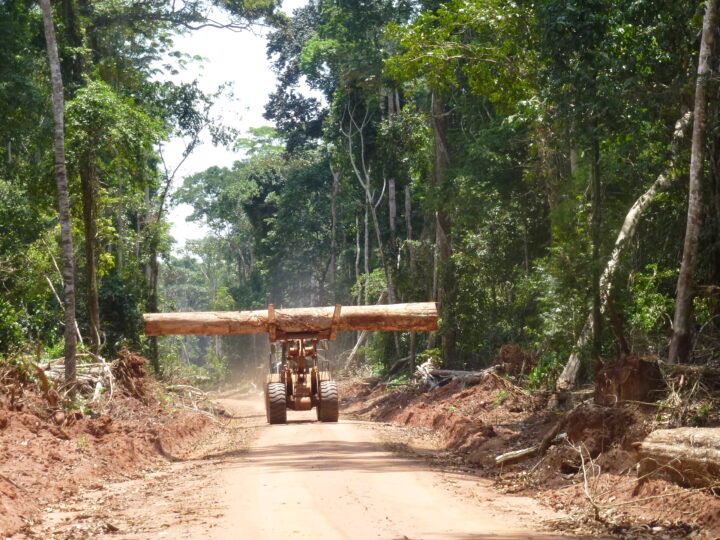
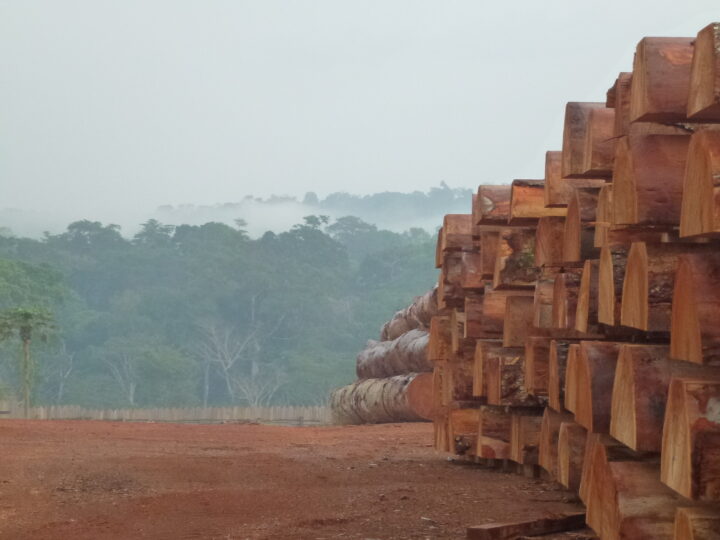
The majority of new roads are built for selective logging activities, which is one of the main economic activities in the rainforest. Companies practice selective logging where only the most valuable tree species are cut, which usually results in cutting one tree per hectare on average. In order to harvest this timber though, the companies must build roads, usually unpaved, that allow the trucks and tractors to drive deep into the forest. The photos below show scenes of timber extraction and a timber yard.
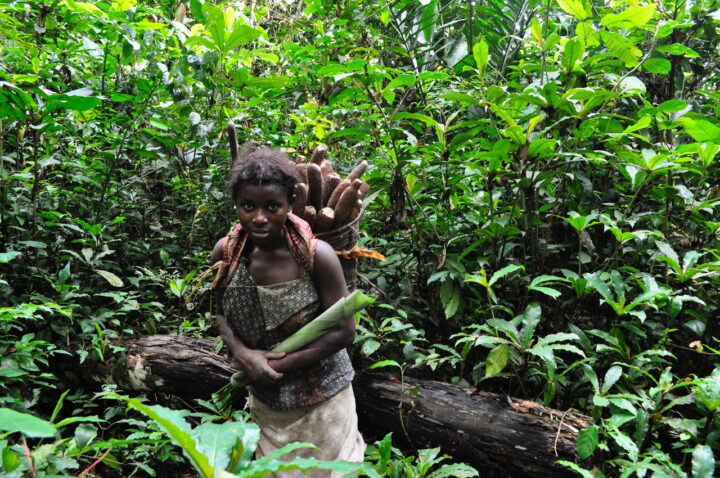
Sometimes roads are used by farmers to reach further into the forest and establish small-scale agricultural plots. The image below shows a small landholder in a forest near Mbandaka in the Democratic Republic of Congo. The woman is carrying a basket of manioc (cassava). She is also holding a maranthaceae leaf, which is commonly used for wrapping and cooking on a fire.
In the recent study, the researchers found that deforestation rates were highest around older, open roads. Specifically, the highest rates were found in the Democratic Republic of Congo due to agriculture and a high population density.
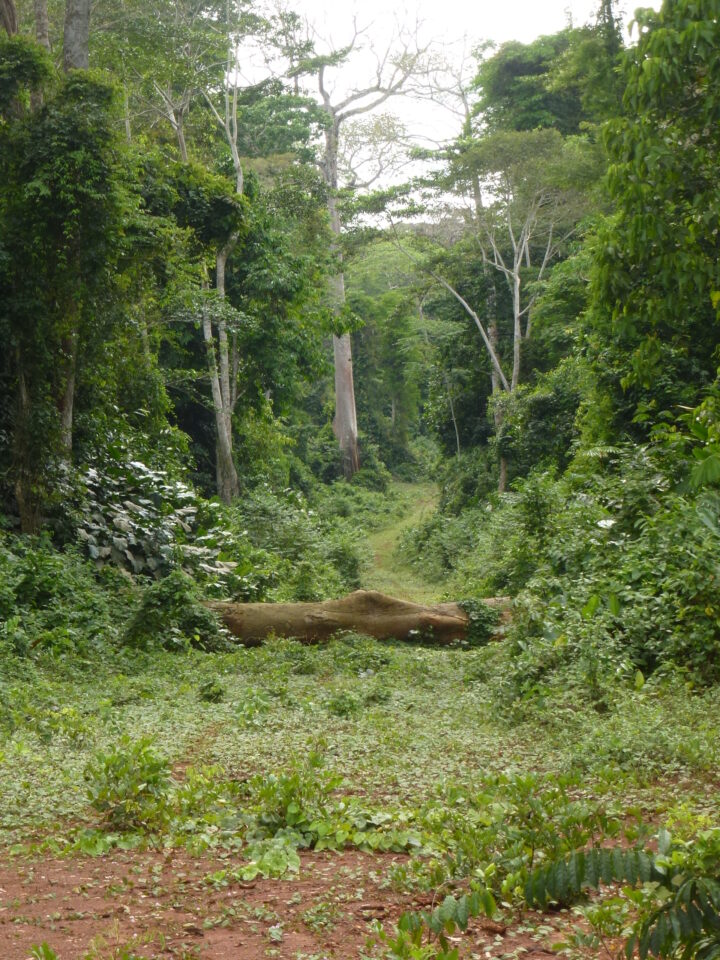
Researchers showed deforestation rates were the lowest around abandoned or closed roads. Abandoned roads reduce human traffic and allow vegetation to grow over the dirt path. The image below shows an abandoned road in the Republic of Congo that is overgrown with regenerating trees and plants. These plant species pictured are popular for gorillas to feed on and can help restore the gorillas’ natural habitat.
Abandoned roads were most commonly found inside logging concession areas. After a logging company was no longer using the road, the road was often closed or abandoned. Sometimes the road can be closed off by simply using a log to prevent vehicles from entering, as shown below.
To read the accompanying article, click here: When a Road Leads to Deforestation
Every month on Earth Matters, we offer a puzzling satellite image. The November 2019 puzzler is above. Your challenge is to use the comments section to tell us what we are looking at, where it is, and why it is interesting.
November 2019 puzzler is above. Your challenge is to use the comments section to tell us what we are looking at, where it is, and why it is interesting.
How to answer. You can use a few words or several paragraphs. You might simply tell us the location. Or you can dig deeper and explain what satellite and instrument produced the image, what spectral bands were used to create it, or what is compelling about some obscure feature in the image. If you think something is interesting or noteworthy, tell us about it.
The prize. We can’t offer prize money or a trip to Mars, but we can promise you credit and glory. Well, maybe just credit. Roughly one week after a puzzler image appears on this blog, we will post an annotated and captioned version as our Image of the Day. After we post the answer, we will acknowledge the first person to correctly identify the image at the bottom of this blog post. We also may recognize readers who offer the most interesting tidbits of information about the geological, meteorological, or human processes that have shaped the landscape. Please include your preferred name or alias with your comment. If you work for or attend an institution that you would like to recognize, please mention that as well.
Recent winners. If you’ve won the puzzler in the past few months or if you work in geospatial imaging, please hold your answer for at least a day to give less experienced readers a chance.
Releasing Comments. Savvy readers have solved some puzzlers after a few minutes. To give more people a chance, we may wait 24 to 48 hours before posting comments.
Good luck!
See our “A Burial Site Fit for an Emperor“ Image of the Day for the answer.
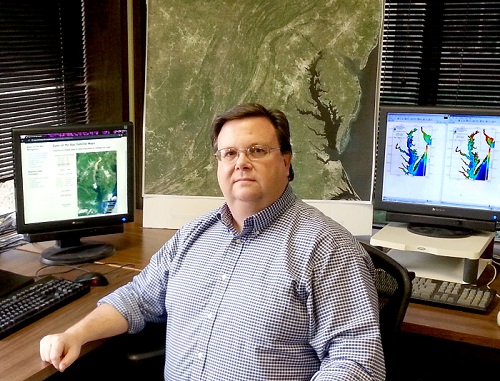
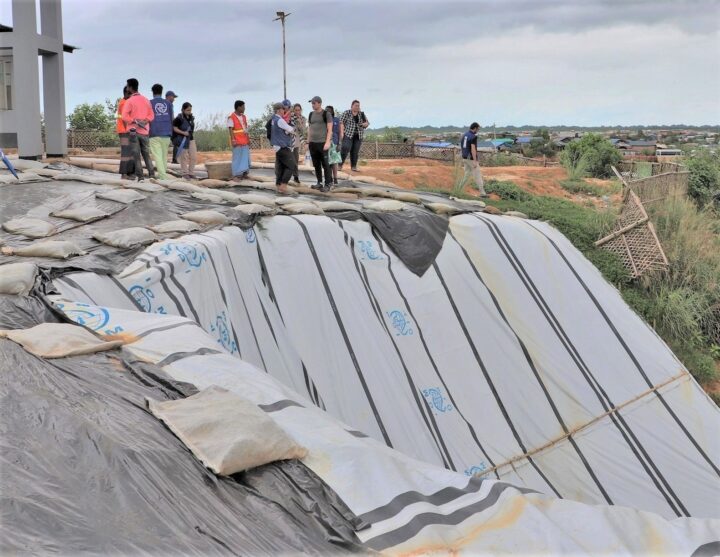
Camp managers and other officials overseeing Rohingya refugee camps in Bangladesh are now incorporating NASA satellite observations into their decision-making. Information like daily rain totals can help inform how to lay out refugee camps and how to store supplies. The goal is to reduce the risk to refugees from landslides and other natural hazards.
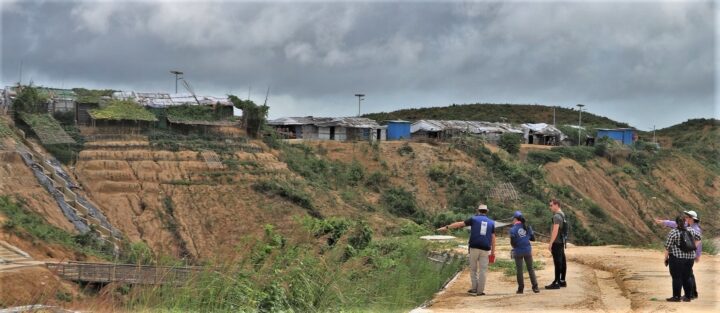
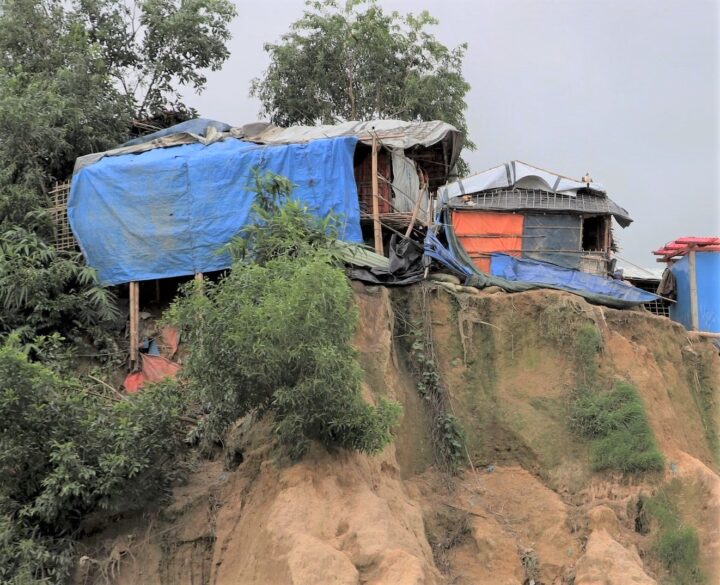
Since August 2017, more than 740,000 Rohingya refugees have fled from Myanmar (Burma) to Bangladesh. Many of them have sought shelter in camps in the hilly countryside, where landslide risks are greatest. When refugee camps were built in the southeastern part of the country, many plants and trees were removed — taking with them the roots that could hold the soil in place and help stabilize the landscape when heavy rains come.
Increasing this danger is Bangladesh’s intense monsoon season. Approximately 80 percent of the country’s yearly rain falls from June to October, bringing with it an increased risk of flash flooding and landslides. For instance, July 2019 storms dropped 14 inches of rain in just 72 hours, causing 26 landslides in Rohingya refugee camps around Cox’s Bazar, Bangladesh. One person was killed and more than 4,500 others were left without shelter.
“We have little information on landslides,” said Hafizol Islam, who is in charge of one of the most densely populated camps at Cox’s Bazar. “It is unpredictable for us and can happen at any time.”
Now Islam and other camp managers have access to maps and a website (updated daily) that provides near real-time NASA data on land use, rainfall, and elevation. Data come from the Global Precipitation Measurement (GPM) mission and the Moderate Resolution Imaging Spectroradiometer (MODIS) instruments on NASA’s Terra and Aqua satellites, among other sources. Taken together, these maps and data provide a clearer picture of when and where landslide hazards are concentrated.
“With landslides, flash floods, and rapid development, the terrain of these camps is constantly changing,” said Robert Emberson, a postdoctoral fellow at NASA’s Goddard Space Flight Center.
Emberson and other researchers from NASA’s Earth Applied Sciences Disasters Program and Columbia University’s International Research Institute for Climate and Society (IRI) are using new approaches to work alongside humanitarian end-users and develop products to address pressing needs in vulnerable settings. The partnership seeks the feedback of the local people affected and develops maps based on their input.
“We need to understand if, why, and when existing risk information is being used,” said Andrew Kruczkiewicz of IRI, one of the principal investigators of the project. “This strengthens the development of data services for humanitarian emergencies, where decisions and priorities change rapidly. Working in teams that bridge traditional professional and disciplinary boundaries gives data and climate scientists the opportunity to learn more about decision-making in specialized contexts.”
The need for coordination is pressing. Bangladesh has seen steadily increasing rainfall totals over the past 50 years. Climate change is making monsoons in Asia more extreme, and it may be doubling the likelihood of extreme rainfall events even before monsoon season begins.
“The partnership with NASA and IRI helps the UN agencies to assess risks like landslides or flash flooding and supports the disaster management in a scientific way to save lives and reduce damages in the refugee camps,” said Cathrine Haarsaker, a project manager for UNDP Disaster Risk Management.
Emberson said seeing the camps in person brought home the importance of connecting with the people on the ground. “Working with satellite data can sometimes feel quite abstract and separate from the people within the images,” he said. “Visiting the camps not only helped us understand more about the specific problems associated with landsliding to help improve our models in the future, but also drove home the human side to this disaster, emphasizing the urgency of our work.”
Every month on Earth Matters, we offer a puzzling satellite image. The October 2019 puzzler is above. Your challenge is to use the comments section to tell us what we are looking at, where it is, and why it is interesting.
How to answer. You can use a few words or several paragraphs. You might simply tell us the location. Or you can dig deeper and explain what satellite and instrument produced the image, what spectral bands were used to create it, or what is compelling about some obscure feature in the image. If you think something is interesting or noteworthy, tell us about it.
The prize. We can’t offer prize money or a trip to Mars, but we can promise you credit and glory. Well, maybe just credit. Roughly one week after a puzzler image appears on this blog, we will post an annotated and captioned version as our Image of the Day. After we post the answer, we will acknowledge the first person to correctly identify the image at the bottom of this blog post. We also may recognize readers who offer the most interesting tidbits of information about the geological, meteorological, or human processes that have shaped the landscape. Please include your preferred name or alias with your comment. If you work for or attend an institution that you would like to recognize, please mention that as well.
Recent winners. If you’ve won the puzzler in the past few months or if you work in geospatial imaging, please hold your answer for at least a day to give less experienced readers a chance.
Releasing Comments. Savvy readers have solved some puzzlers after a few minutes. To give more people a chance, we may wait 24 to 48 hours before posting comments.
Good luck!
See our Virginia’s Volcanic Past Image of the Day for the answer.
