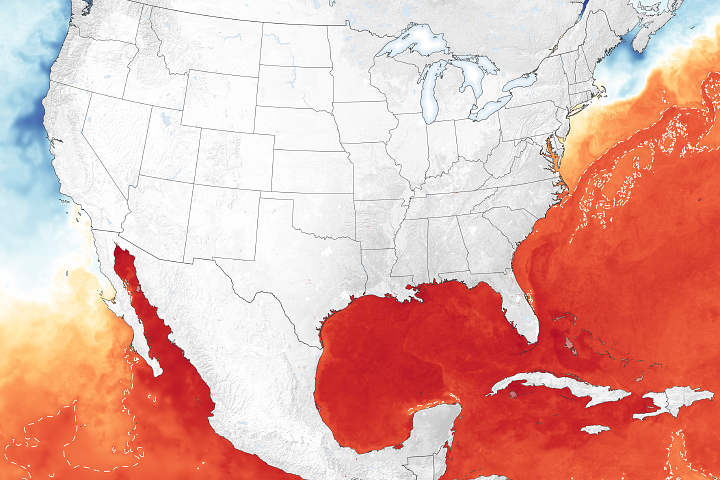
Though tropical cyclones are atmospheric phenomena, much of their fearsome power comes from the ocean. The seas are abundant sources of moisture to feed growing storm clouds. Just as critically, they are vast repositories of thermal energy that can move from the sea to the sky.
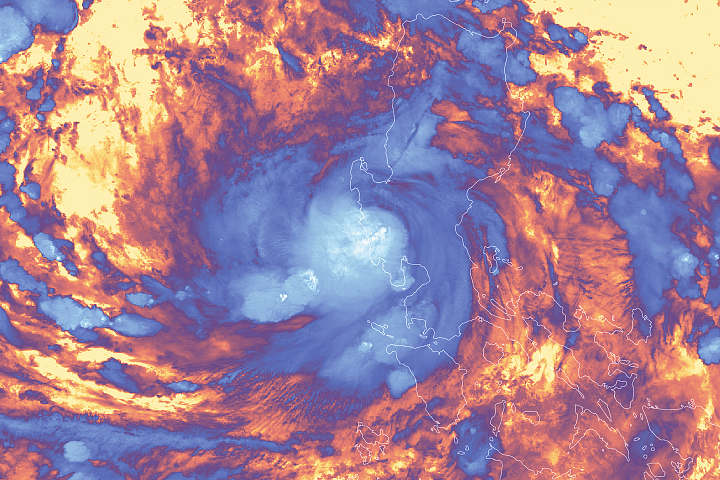
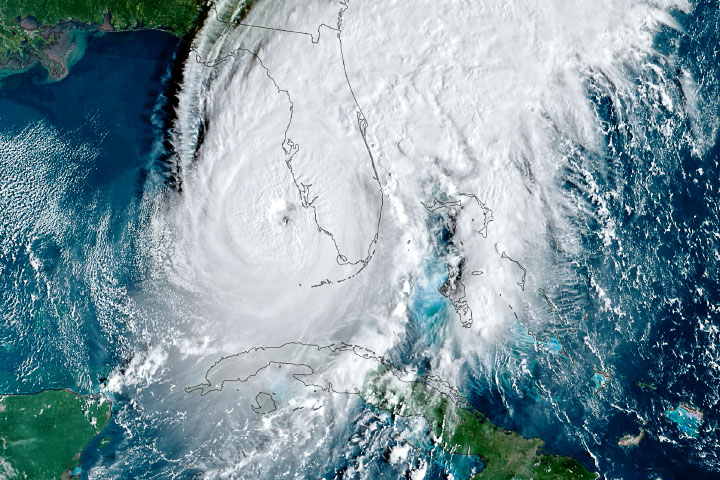
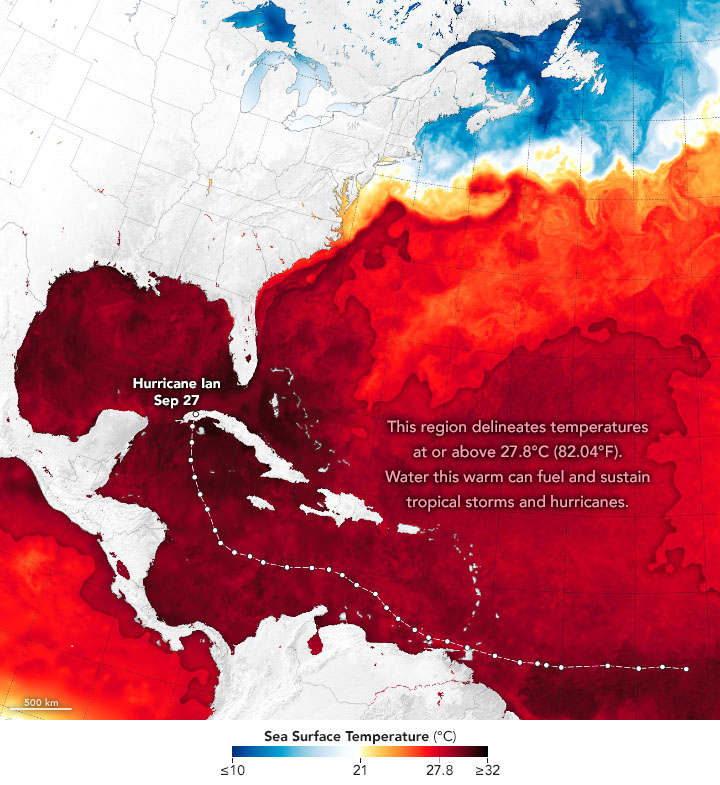
As Hurricane Ian lashed western Cuba and headed for the west coast of Florida on September 27, 2022, it moved over an abundant fuel source in the Gulf of Mexico. While sea surface temperatures are just one of the factors influencing hurricanes, they are a fair predictor of the readiness of the ocean to sustain them.
The map above shows sea surface temperatures (SSTs) as measured on September 26 by a combination of satellite and ocean instruments and processed by NASA scientists. Meteorologists generally agree that SSTs should be above 27.8° Celsius (82.04° Fahrenheit) to sustain and intensify hurricanes, cyclones, and typhoons. Surface waters above that threshold are represented in red on the map.
Evidence for the transfer of energy between the ocean and atmosphere often shows up in the wake of a storm, literally. As a hurricane or typhoon passes through a parcel of ocean, it can cool the local sea surface for several days.
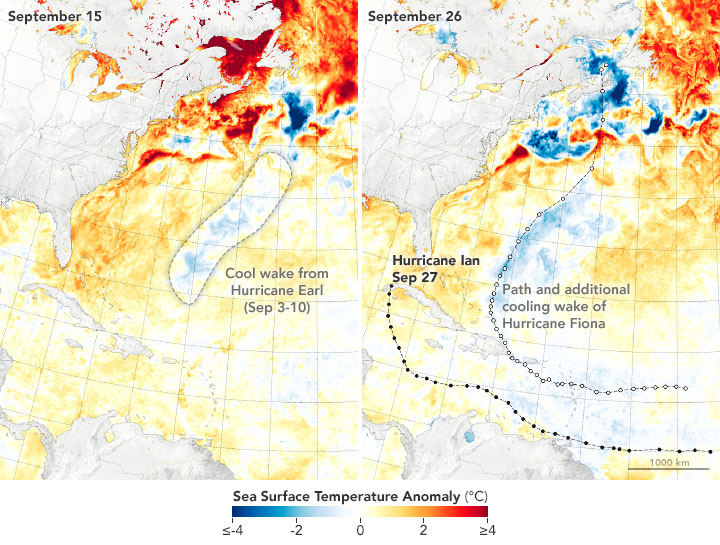
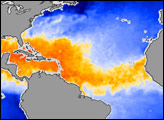
The maps above show sea surface temperature anomalies on September 15 (left) and September 26 (right). They depict how much the surface layer was above or below the long-term average temperature for this time of year. The storm that became Hurricane Earl left a path of cooler water in its wake as it moved across the northwest Atlantic between September 3-10. Then Hurricane Fiona—which traced a path of destruction across Puerto Rico, the Dominican Republic, Bermuda, and Newfoundland—also left a wake as it moved north between September 15-26.
Water vapor cools naturally as it rises through the atmosphere and then falls back onto the sea as rainwater. Having given up much of its heat to the atmosphere, the rain cools the sea surface a bit. At the same time, the winds and waves of a hurricane disperse warm surface water and bring up cooler water from the ocean depths.
In theory, the cooler water rising to the surface should make it less likely for a new storm to develop or intensify in the same area in the following days. However, the waters of the North Atlantic were not necessarily cool after Earl and Fiona, just at a lower temperature than before.
The data for all of these maps come from the MUR Global Foundation Sea Surface Temperature Analysis, produced at NASA’s Jet Propulsion Laboratory. The system combines observations from several satellite instruments, including the NASA Advanced Microwave Scanning Radiometer-EOS (AMSR-E), the Moderate Resolution Imaging Spectroradiometer (MODIS) on the NASA Aqua and Terra platforms, the U.S. Navy microwave WindSat radiometer, the Advanced Very High Resolution Radiometer (AVHRR) on several NOAA satellites, and from in situ observations from NOAA.
Editor’s Note: NOAA and other federal and state agencies lead the forecasting of and response to hurricanes in the United States, with NASA playing a supporting role in developing experimental tools and providing key data to those agencies. NASA also works to streamline the flow of information and support foreign science institutions, governments, and international groups as they generate data products from freely available NASA data. The NASA Disasters program contributes with high-value or unique products to complement actions of operational agencies and regional governments to support decision-making during crises and also in disaster risk reduction.
NASA Earth Observatory images by Joshua Stevens, using data from the Multiscale Ultrahigh Resolution (MUR) project and information from the National Hurricane Center. Story by Michael Carlowicz.