Understanding the chemical precursors of ground-level ozone may make it easier to prevent the pollutant from building up in the lower atmosphere.
Published Nov 7, 2017
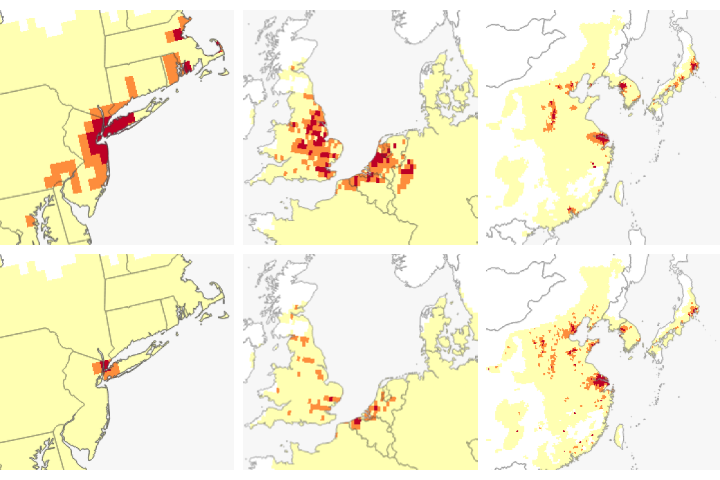
These maps show how the relative amounts of the key ingredients for ozone (smog) formation in the United States change throughout the summer.
Published Aug 7, 2009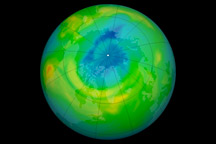
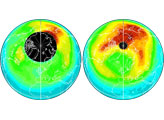
Recent observations from satellites and ground stations suggest that atmospheric ozone levels for March in the Arctic were approaching the lowest levels in the modern instrumental era.
Published Mar 30, 2011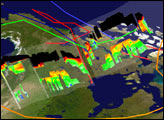
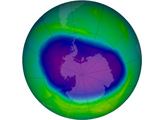
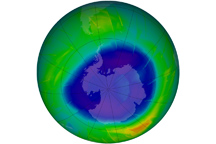
Blues and purples in this image of Antarctic ozone concentrations reveal the developing ozone hole of 2009.
Published Sep 17, 2009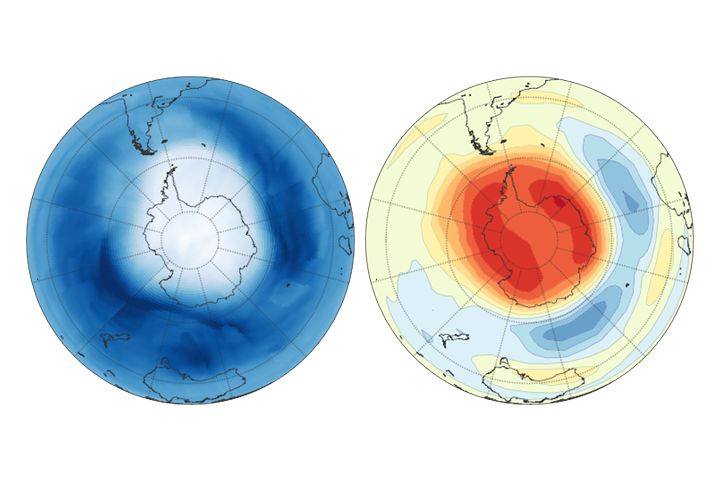
New research from NASA scientists shows that the amount of chlorine in the stratosphere over the South Pole is declining at the same time that ozone holes are becoming less severe.
Published Feb 13, 2018
The growth of the ozone hole appears to have stopped thanks to the banning of most ozone-depleting chemicals.
Published Sep 17, 2014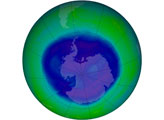
On September 12, 2008, the Antarctic ozone hole reached its maximum size for the year.
Published Oct 25, 2008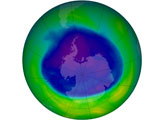
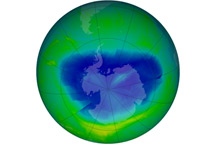
The Ozone Monitoring Instrument (OMI) on NASA’s Aura satellite acquired data for this map of ozone concentrations over Antarctica on September 12, 2010.
Published Sep 16, 2010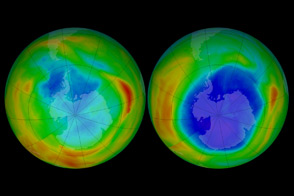
NASA satellites have observed the Antarctic ozone hole since the late 1970s—before and after nations agreed to stop producing chemicals that destroy the ozone layer.
Published Sep 18, 2012alert message
