
When ozone forms at ground level, it can cause respiratory illness and can damage crops and other plants. At the Earth’s surface, the ingredients for making ozone are nitrogen oxides and volatile organic compounds (organic chemicals that vaporize easily). Both of these ingredients are found in the air pollution from vehicles (and gasoline vapors), power plants, and industrial activities, but volatile organics are also released naturally from trees and other vegetation.
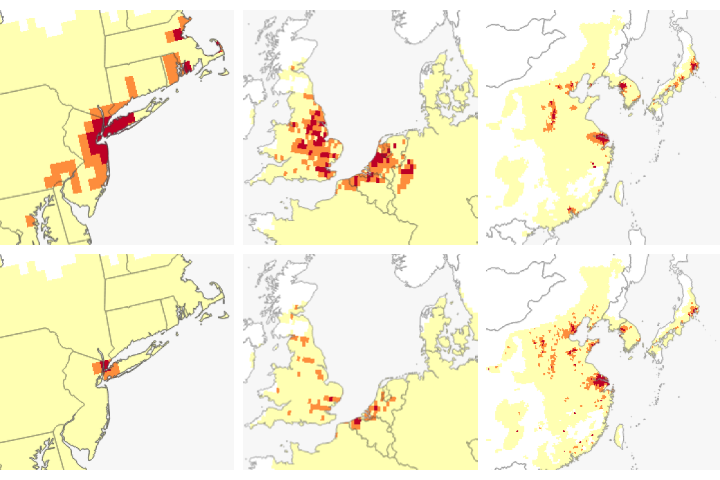
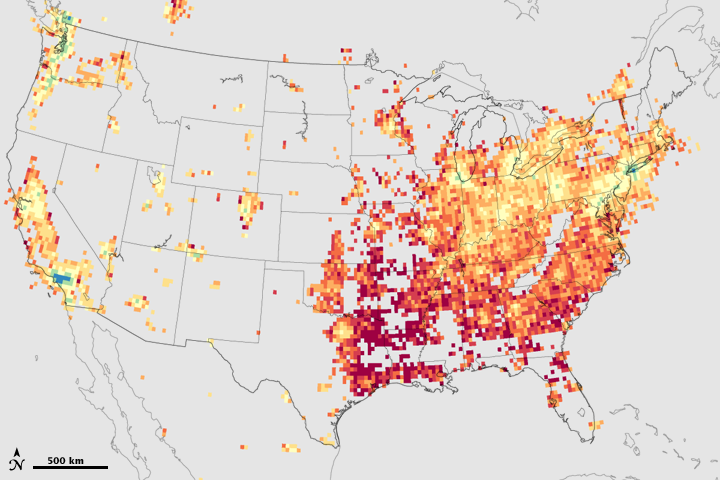
Because both kinds of chemicals—plus summertime sunlight and heat—are needed to make ground-level ozone, regulators could control ozone production by reducing only one ingredient. But which one? These maps show a satellite-based approach to deciding when it would be more effective to reduce nitrogen oxides and when it would be more effective to reduce volatile organic compounds. Based on data from the Ozone Monitoring Instrument (OMI) on NASA’s Aura satellite, the maps show the relative amounts of the volatile organic compound formaldehyde and nitrogen dioxide in July and September 2005.
Across virtually all of the United States, the ratio of formaldehyde to nitrogen dioxide is greater than 1 (yellow, orange, red) throughout the summer months, despite the seasonal decline in naturally produced volatile organics. In other words, formaldehyde is more abundant than nitrogen dioxide. Since there are plenty of naturally produced volatile organics in the air in most places, ozone production is limited by the amount of nitrogen oxides. Further reductions of nitrogen oxides, then, would be the best way to limit ozone production in most places.
Where urban development is extensive enough, however, the ratio of formaldehyde to nitrogen dioxide shifts to less than 1 (purple, blue, green). An excess of nitrogen oxides means that in those places, ozone production is limited by the amount of volatile organics; tighter regulation of manmade volatile organic compounds would more effectively stop ozone formation in these urban areas. In some urban areas, such as Los Angeles and Seattle, the mixing ratio favors controlling volatile organics all summer long. In some Eastern urban areas, however, the pattern changes as the season progresses. Around New York, Philadelphia, Pittsburgh, Baltimore, and Washington, D.C., for example, mixing ratios of volatile organics to nitrogen dioxide are greater than 1 early in the season, favoring control of nitrogen oxides to stop ozone, but they become less than 1 later in the season, favoring a shift in regulatory strategy to reduction of manmade volatile organics. Gray areas indicate where the amounts of one or both ozone precursors are negligible.
NASA image by Jesse Allen, based on data provided by Bryan Duncan and Yasuko Yoshida, NASA Goddard Space Flight Center. Caption by Rebecca Lindsey and Michon Scott, based on interpretation provided by Bryan Duncan.