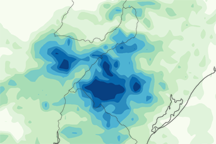
This image shows rainfall estimates for Argentina, Uruguay, and Brazil from November 19–25, 2009. Heaviest rainfall amounts appear in dark blue, and lightest rainfall amounts appear in page green.
Published Dec 7, 2009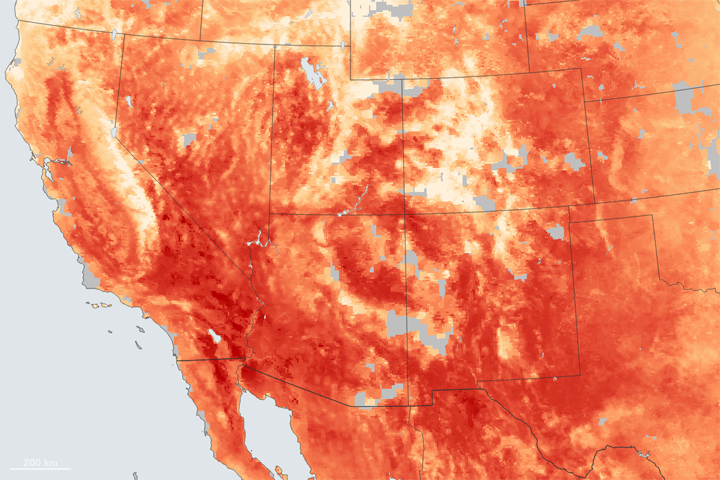
Extreme heat broke meteorological records, canceled flights, and made life miserable for millions of people.
Published Jun 23, 2017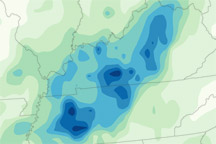
A map of rainfall totals between May 1 and May 3, 2010, shows a line of heavy rain following the path of severe thunderstorms across Tennessee and Kentucky.
Published May 5, 2010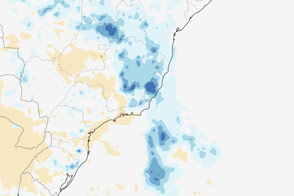
More than two feet of rain fell in parts of southeast Brazil during December, resulting in widespread flooding.
Published Jan 7, 2014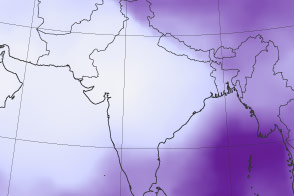
Humidity and the abrupt onset of extremely high temperatures have killed thousands of people in India.
Published Jun 5, 2015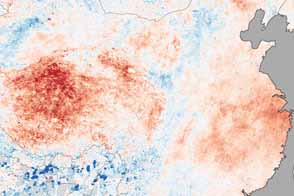
All-time national and regional records for summer temperatures have fallen several times in recent weeks.
Published Aug 16, 2013
This color-coded map shows approximate rainfall amounts over Japan, where unprecedented floods struck some areas in early July 2012.
Published Jul 13, 2012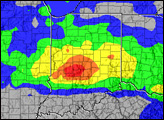
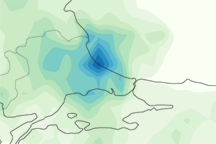
This image shows rainfall estimates for northwestern Turkey and the surrounding region from September 2 to September 9, 2009. The lightest amounts appear in pale green, and the heaviest amounts appear in blue.
Published Sep 11, 2009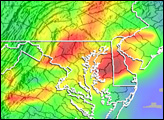
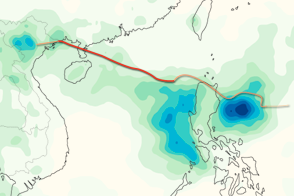
This color-coded image shows rainfall totals and the storm track for Typhoon Kai-tak in August 2012.
Published Aug 20, 2012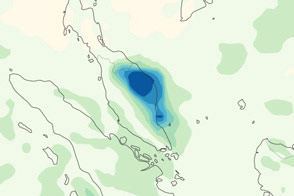
This color-coded map shows rainfall amounts in Malaysia and Indonesia from December 24, 2012, to January 6, 2013.
Published Jan 8, 2013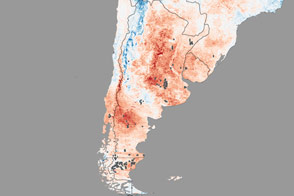
A deadly heatwave left its signature on the land as temperatures soared as high as 45° C (113° F) in December.
Published Jan 7, 2014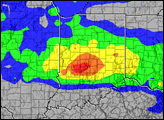
alert message
