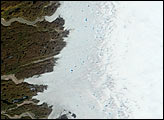
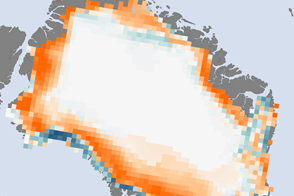
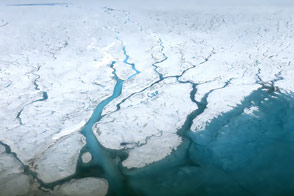
Although 2005 overall saw a new record, the extent of June melting in 2005 was unexceptional. The same held true for 2006, when this picture was taken.
Published Jun 30, 2006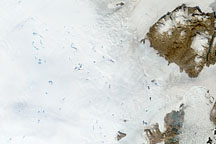
To understand ice sheets, glaciologists venture both below the surface with ice cores, and into the sky with satellites. Satellite imagery of the Greenland Ice Sheet reveals melt ponds that can affect glacier flow and sea level.
Published Oct 29, 2008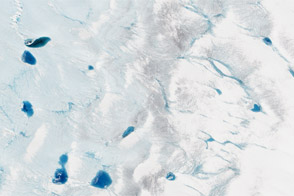
Melt ponds on the surface of Greenland’s ice sheet are an important indicator of the strength of the 2013 melt season.
Published Jul 9, 2013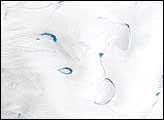
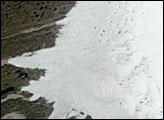
Thinner than the 2.3-kilometer-thick center, the outer edges of the Greenland ice sheet develop melt zones like the one shown here during the warm summer months.
Published Apr 7, 2007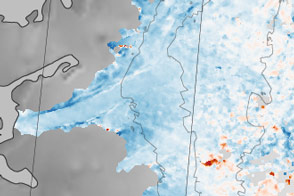
Sections of the Greenland Ice Sheet that end on land are slowing—a sliver of good news for sea level rise.
Published Oct 30, 2015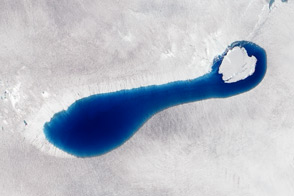
Pools of water grow on top of the ice sheet in summer, then sometimes disappear quickly. That water flushes out through glacial plumbing, carrying sediment and massive volumes of fresh water to the sea.
Published Mar 21, 2013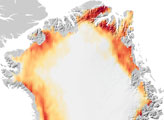
The 2011 Greenland melt season was up to 30 days longer than the 1979–2010 average. This color-coded map shows where melt season lasted more or less than average.
Published Dec 6, 2011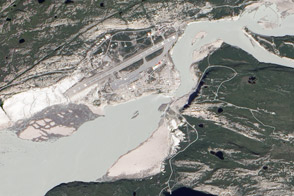
Acquired May 31, 2012, and July 12, 2012, these images compare conditions along the Watson River at Kangerlussuaq, which was struck by floods in July 2012.
Published Jul 27, 2012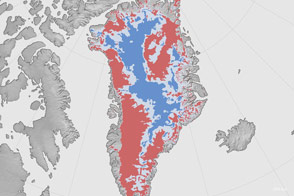
A new map shows where the bottom of the Greenland Ice Sheet is likely thawed.
Published Aug 4, 2016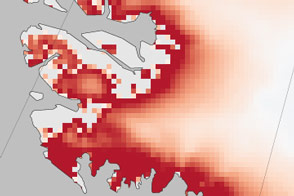
By 2090, the scale could tilt in the favor of ice loss instead of buildup.
Published Jan 31, 2017Image of the Day Heat Human Presence Snow and Ice Remote Sensing
A summer field campaign examines the hydrology of the water streaming across the top of the ice sheet.
Published Aug 30, 2015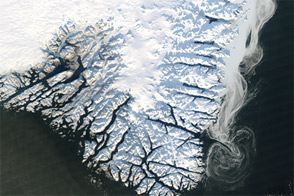
Captured near the end of 2012, this image shows a mixture of sea ice, land ice, and fresh snow.
Published Jan 6, 2013