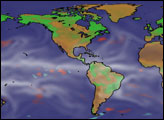

This comparison shows how a forecast from the high resolution Goddard Earth Observing System Model, Version 5, the world’s highest resolution global climate model, stacks up against GOES satellite images showing actual cloud patterns for February 6, 2010.
Published Jun 9, 2010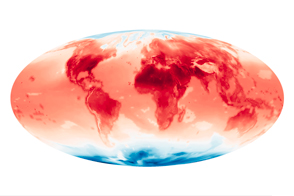
A new data set from the NASA Earth Exchange shows projected changes in temperature in response to different scenarios of increasing carbon dioxide.
Published Jun 12, 2015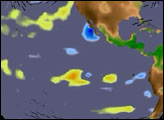

The near-record water temperatures of 2015-16 has been followed by a modest, quiet appearance of La Niña.
Published Jan 6, 2017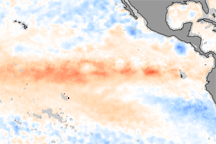
These color-coded images show the strengthening of El Niño between October and November 2009. In the November image, warm waters (indicated in red) have spread across the Pacific.
Published Dec 11, 2009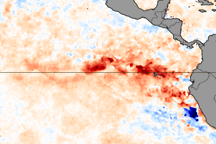
A patch of warmer than average ocean temperatures in the eastern Pacific on July 26, 2009, revealed the onset of El Niño conditions.
Published Jul 28, 2009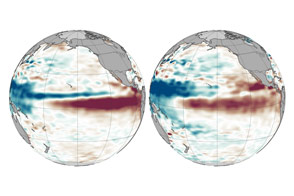
With each passing month, 2015 looks more and more like 1997.
Published Oct 13, 2015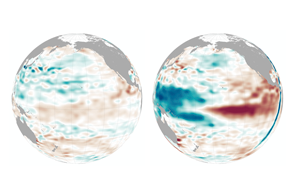
Past events suggest the phenomenon winds down after December and January. But will this year follow the pattern?
Published Jan 22, 2016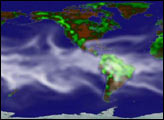
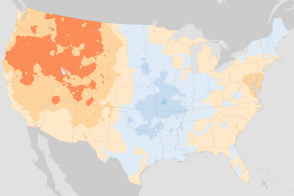
These maps compare January minimum temperatures and July maximum temperatures in the U.S. Climate Normals, a 30-year frame of reference. The new normal reflects a warming world.
Published Jul 6, 2011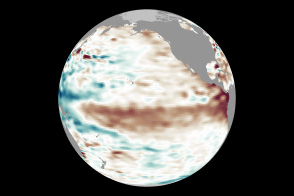
Conditions in May 2014 look similar to those in May 1997, a year that brought one of the most potent El Niño events of the 20th century.
Published May 14, 2014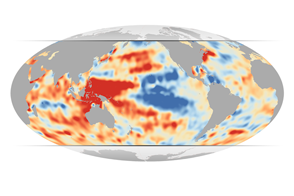
Examining temperatures from the depths of the ocean, JPL scientists have found that lower layers of the Western Pacific and Indian Oceans grew much warmer during a decade when surface temperatures cooled.
Published Jul 10, 2015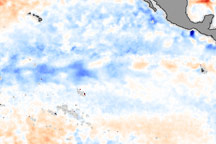
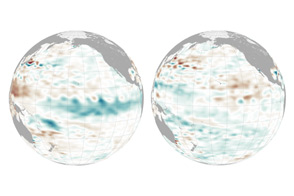
La Niña is an occurrence of unusually cold water temperatures in the Pacific Ocean along the equator (the precise area affected is outlined in black in the image above). La Niña and its opposite, El Niño, are linked to seesaw variations in air pressure over the tropical Pacific and affect weather patterns across the globe. NASA monitors developing El Ni&ntidle;o and La Niña events by observing sea surface temperatures. This image compares the water temperatures observed in late January 2006 to long-term average conditions for that time of year. The recent data were collected by the Advanced Microwave Scanning Radiometer for EOS (AMSR-E). Red shows where sea surface temperatures are warmer than normal and blue where they are colder than normal.
Published Feb 9, 2006