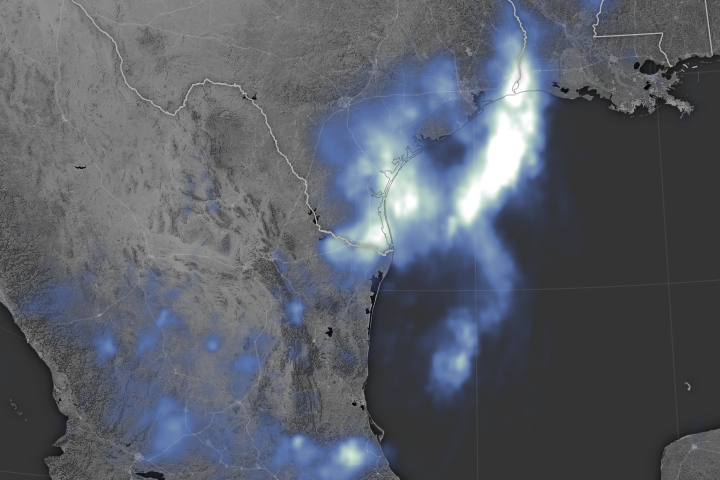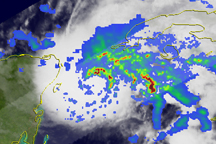
Peaking as a category 4 hurricane on September 28, 2018, over the Eastern Pacific Ocean, Hurricane Rosa weakened before making landfall on the Baja California Peninsula four days later. Still, as the storm’s remnants moved inland, they delivered heavy rain and caused flash floods in northwestern Mexico and the U.S. Southwest.
“We can draw parallels between this storm and Hurricane Florence,” said Gary Partyka, an atmospheric scientist with the GMAO at NASA’s Goddard Space Flight Center. “The strength of both weakened tremendously, but both moved enough moisture to produce substantial amounts of rainfall. A hurricane’s category (which describes its maximum winds) is not very important when it comes to flooding.”
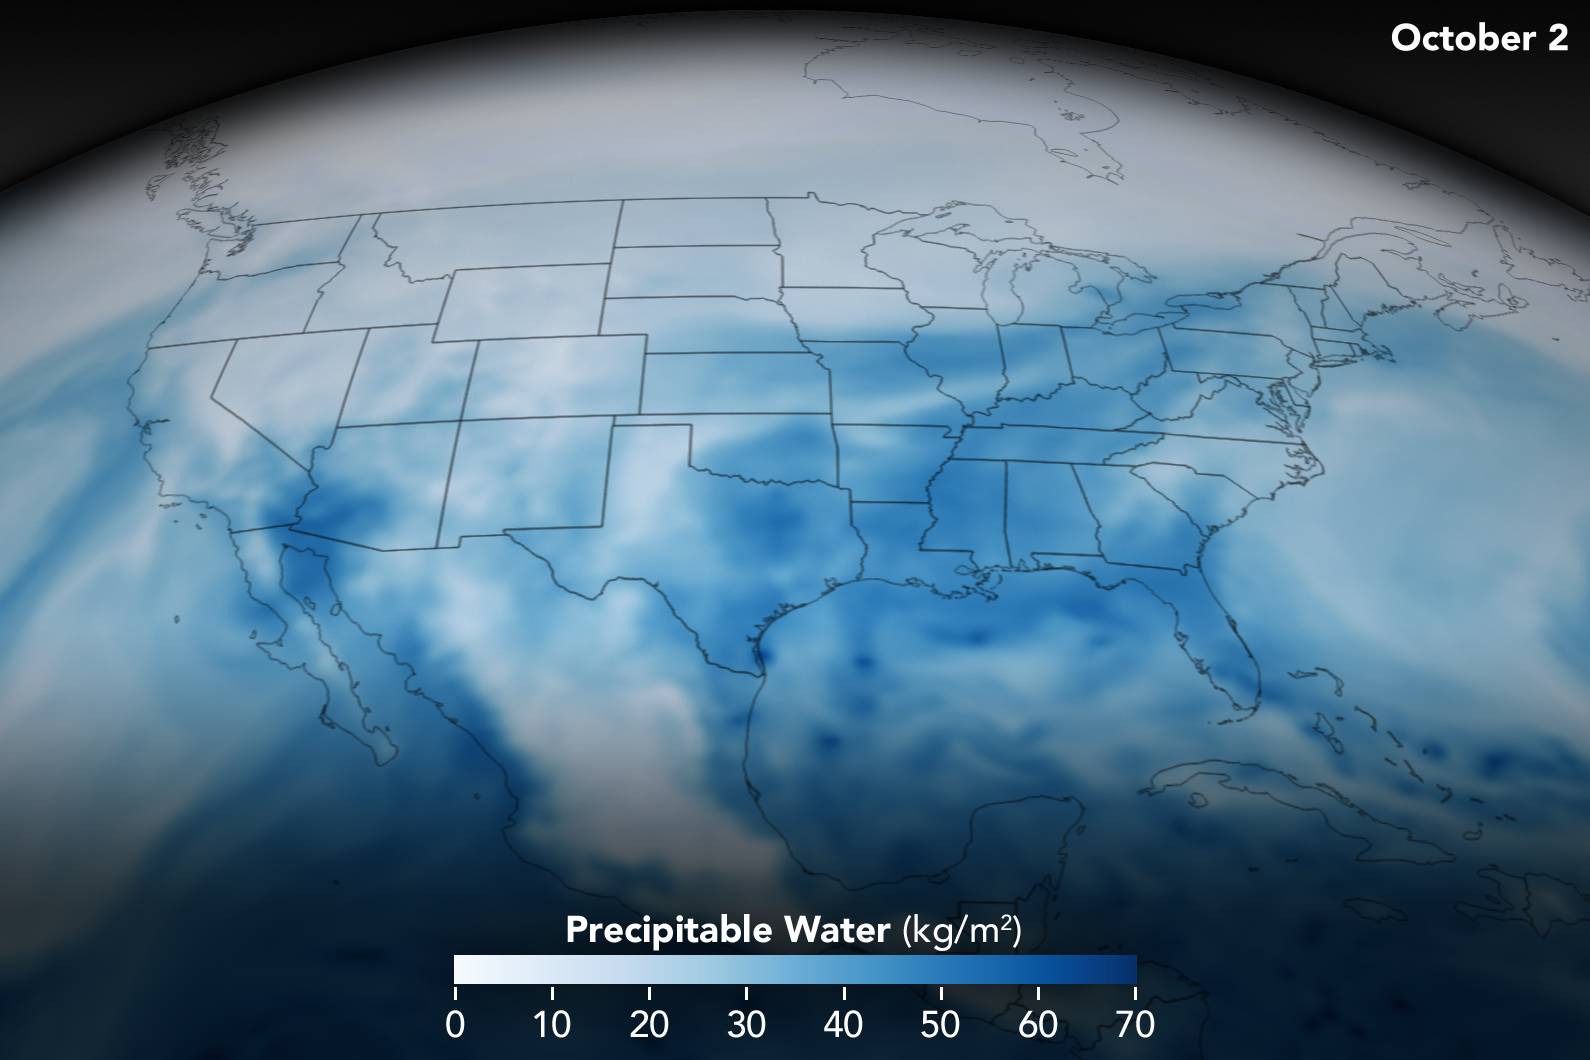
The still image and animation above show the atmosphere’s total precipitable water. That is, the depth of water in a column of the atmosphere if all the water in that column fell as rain. The image and animation, compiled from October 1-3, 2018, were created with data from a version of a NASA model known as the Goddard Earth Observing System Data Assimilation System (GEOS DAS), which uses satellite data and mathematical representations of physical processes to calculate what was happening in the atmosphere.
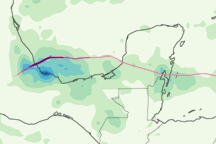
Viewed globally, the model shows large circulation patterns as well as individual storms. This regional view shows Hurricane Rosa as it spun over the East Pacific Ocean and broke up over Baja California and the U.S. Southwest. Dark blue areas represent the highest values of precipitable water.
Partyka says it is important to note that not all precipitable water falls as rain; some water vapor stays behind in the atmosphere. Nor is it a limit on the amount of rain that can fall, which can increase as water vapor moves into the column of air.
“The indicator is useful for showing potential regions where rainfall could be excessive, though you also need a trigger to make the ‘precipitable water’ fall as precipitation,” Partyka said. In this case, Rosa’s remnants and a low-pressure system off the California coast did serve as triggers.
According to the National Weather Service, October 2 was the wettest October day on record in Phoenix, Arizona. More than 2 inches (5 centimeters) of rainfall were measured that day at Phoenix Sky Harbor International. The last time the city saw more than two inches in a day in October was in 1988.
NASA Earth Observatory imagery by Joshua Stevens, using GEOS-5 data from the Global Modeling and Assimilation Office at NASA GSFC. Story by Kathryn Hansen.