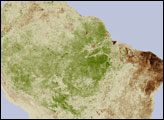
In temperate deciduous forests, seasonal changes are hard to miss. Green forests turn red, yellow, or orange in autumn and brown by winter.
The Amazon rainforest experiences seasons as well, but the changes are far more subtle. Temperatures and sunlight remain pretty consistent year-round, but rainfall varies cyclically, becoming more common in certain months and less common in others. Though there are regional variations, June through September are generally the driest months, and December through March are the wettest. While it still rains a significant amount all year, precipitation often drops by half from the wettest months to the driest.
In recent decades, scientists have been using satellite data to study whether these seasonal variations have a significant effect on the “greenness” of the rainforest canopy. While there have been some conflicting results over the years, multiple studies have suggested that a key measure of vegetation called the Normalized Difference Vegetation Index (NDVI) can detect subtle seasonal cycles.
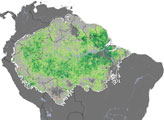
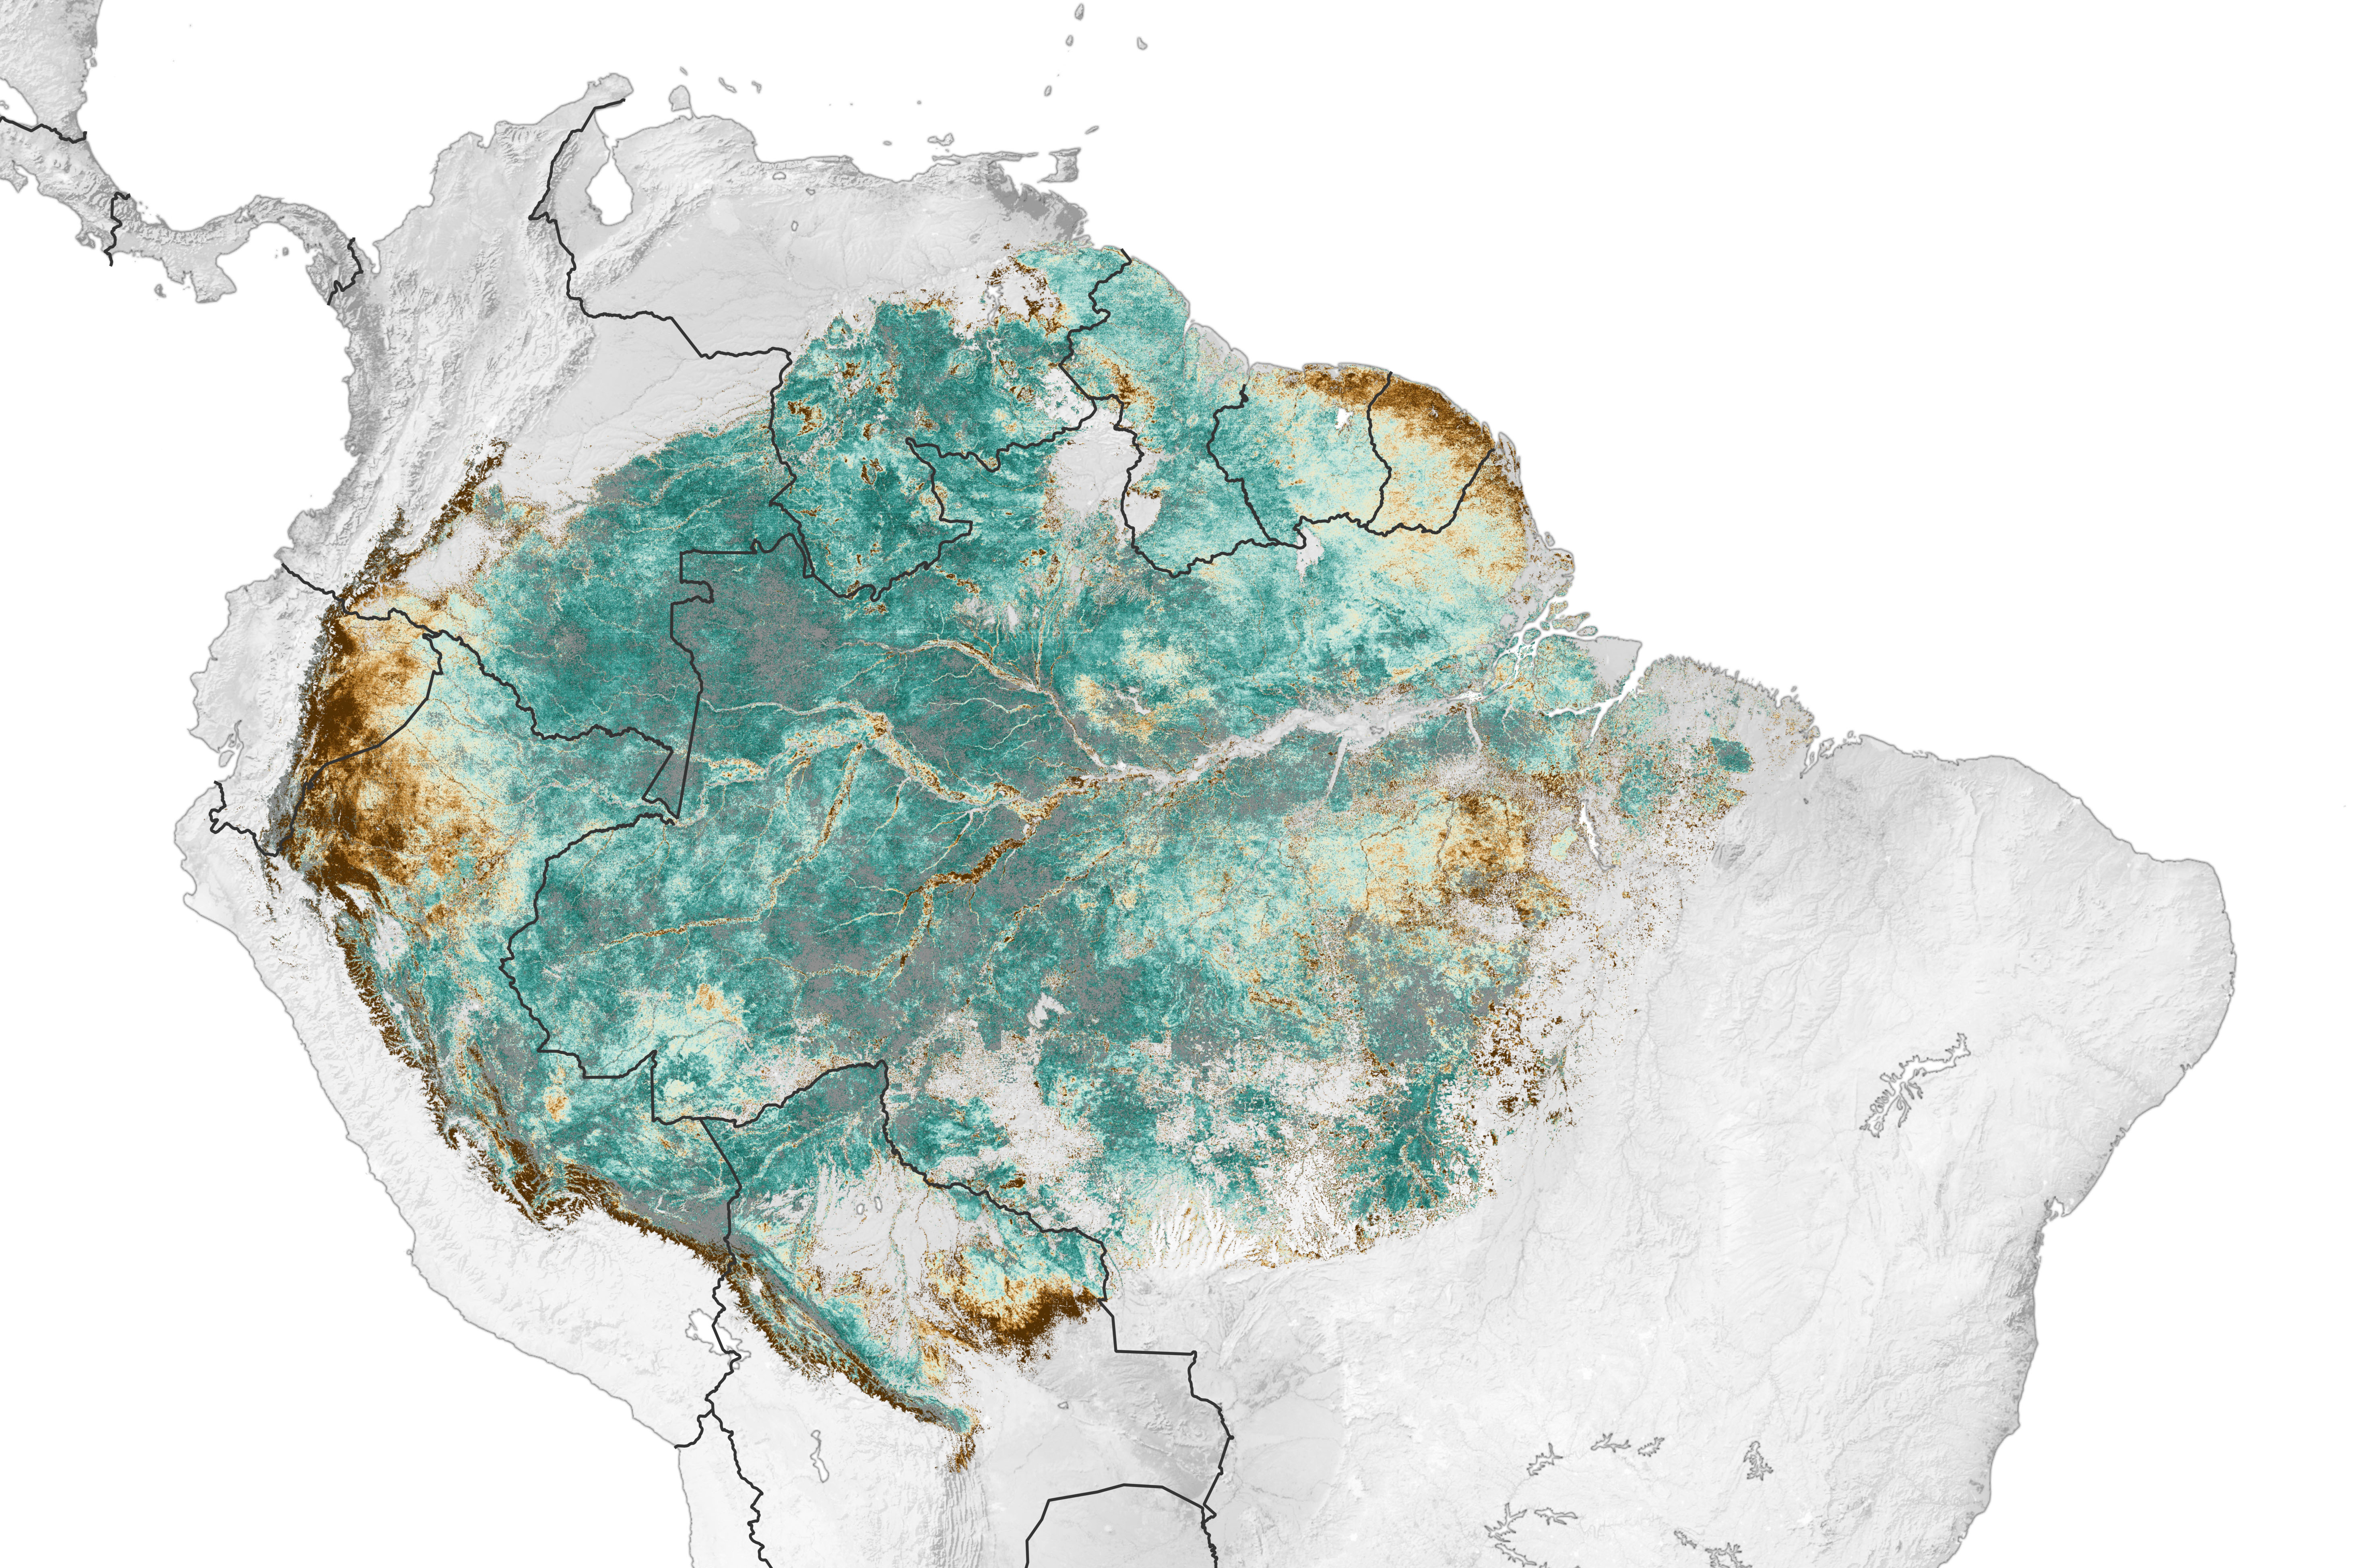
Analysis of data from a new generation of geostationary satellites supports this finding, according to research led by Hirofumi Hashimoto and Ramakrishna Nemani of NASA’s Ames Research Center. The map above, built with information collected by the Advanced Baseline Imager (ABI) on NOAA’s GOES-R satellite, offers a basin-wide view of the differences in vegetation greenness between wet and dry seasons in 2018. The analysis found that 85 percent of forested areas exhibited some seasonality—with the most pronounced signals in Ecuador, western Peru, Bolivia, French Guiana, and Suriname.
“What the satellite observations are showing us is that Amazon forests were slightly greener—about 10 to 15 percent on average—during the dry season,” said Nemani. “It’s a bit counterintuitive, but we see this pattern because some trees put out an extra flush of leaves in the beginning of the dry season in anticipation of the extra sunlight that clearer skies will bring.”
The thickness of the Amazon canopy and the forest’s vast area means that even modest seasonal changes should have significant impacts on the region’s carbon and water cycles. While some recent findings indicate the Amazon rainforest may be close to becoming a source of carbon, it has generally functioned as an enormous carbon sink—an area that draws carbon out of the atmosphere and stores it in plant matter or the soil. It also pumps huge quantities of water into the air through a process called transpiration. That moisture fuels vast "flying rivers" and provides about half of the rain that falls back down on the region.
While earlier studies of Amazon seasonality have mostly relied on polar-orbiting satellites that pass over the rainforest just once or twice per day (usually around midday), Hashimoto and Nemani turned to a satellite sensor that keeps its sights continually trained on the region. Since GOES sits in geostationary orbit, ABI collects new data every 10-15 minutes for entire days, giving researchers more opportunities to see the forest between the persistent clouds.
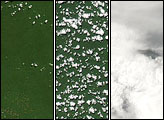
The animation above, showing popcorn clouds bubbling up along the Amazon River on July 13, 2018, highlights the depth of the ABI data. Over the forests, transpiration adds water vapor to the air. This moist air is heated by sunlight until it rises and eventually condenses into clouds. Rivers do not heat up as quickly as the adjacent land, so fewer clouds form over them.
Understanding Amazon seasonality should help scientists develop a more nuanced and accurate view of the carbon cycle. “Climate models have not generally included Amazon seasonality, and this research takes us one step closer to doing that,” said Hashimoto.
“The huge increase in the volume of data we can get from a geostationary platform really gives us confidence that this is a real signal,” said Nemani. “With this type of platform, we are literally able to watch trees grow over the course of a day.” Nemani is one of the leaders of GeoNEX, a collaborative effort for generating Earth-monitoring products from geostationary satellite sensors. The project includes partnerships with NOAA, Japan Aerospace Exploration Agency (JAXA), Korea Aerospace Research Institute, Korea’s National Meteorological Satellite Center, and the Center for Environmental Remote Sensing at Chiba University.
Scientists are cautious but optimistic about the seasonality estimates reported in the study. “There is still work that should be done to correct for and minimize artifacts in the data. Spatial variations in the satellite's viewing angle, sun-angle patterns, and the atmosphere may compromise the subtle seasonality effects reported here,” said Alfredo Huete, a remote sensing scientist at the University of Technology Sydney. “I also expect that we will see major advances when the geostationary satellite data is combined with data from FLUXNET, a ground-based network that measures forest canopy fluxes of carbon dioxide and other key environmental variables.”
NASA Earth Observatory images by Joshua Stevens, using data courtesy of Hashimoto, H., et al. (2021), and GOES 16 data from NOAA and the National Centers for Environmental Information (NCEI). Story by Adam Voiland.