Fieldwork notes, July 21-August 3, 2023
Summer fieldwork for our project, “Clarifying Linkages Between Canopy Solar Induced Fluorescence (SIF) and Physiological Function for High Latitude Vegetation,” once again took our team from University of Maryland Baltimore County north to the boreal forests of central Alaska. We visited this area in the spring to collect data during the very start of the growing season, and now we are returning to collect data during the peak of summer.
This project is part of the NASA Terrestrial Ecology program’s Arctic-Boreal Vulnerability Experiment (ABoVE). The goal of ABoVE is to improve our understanding of high latitude ecosystems, how these ecosystems respond to climate change, and how satellite data can provide information to describe ecosystem processes and aid management decisions.
Our study focuses on measuring light emitted by plants called solar induced fluorescence. Green leaves absorb light, and through photosynthesis take in carbon dioxide and water and produce oxygen and sugars. Fluorescence occurs during photosynthesis as some of the absorbed light energy is radiated out from the plant. The amount of light fluoresced is only a very small fraction of what is absorbed, which is why our eyes don’t see plants glowing. In our study, we use sensitive instruments that can detect this fluorescence. Our goal is to better understand the sources of fluoresced light and how to use this information to describe productivity in boreal forests and tundra.
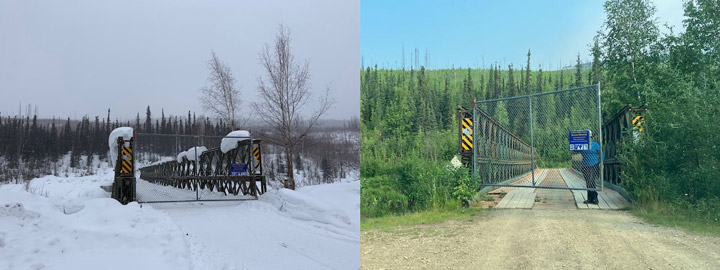
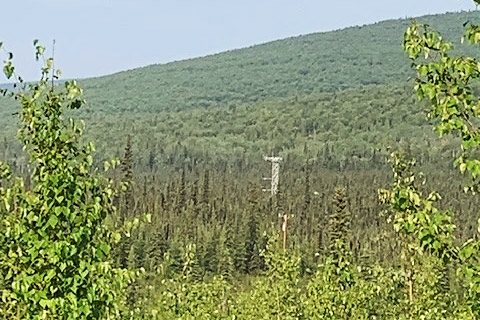
Our study site is at the Caribou Creek flux tower run by the National Science Foundation’s National Ecological Observatory Network (NEON). In spring, we deployed automated instruments at the NEON tower site that continuously collect data. On this trip, we are checking on how they have been working.
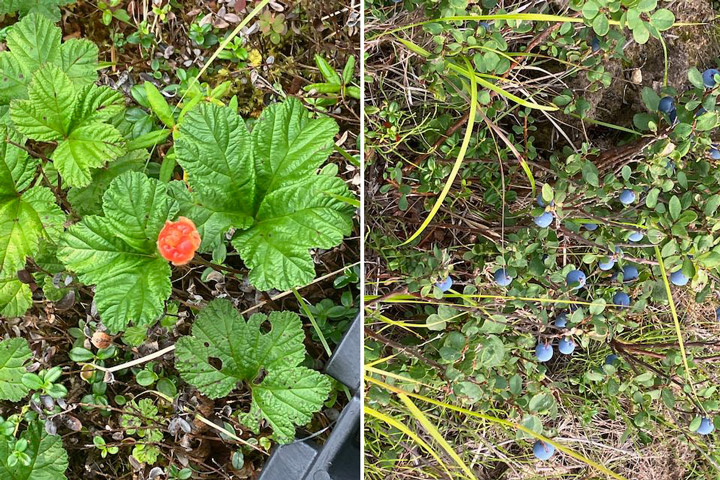
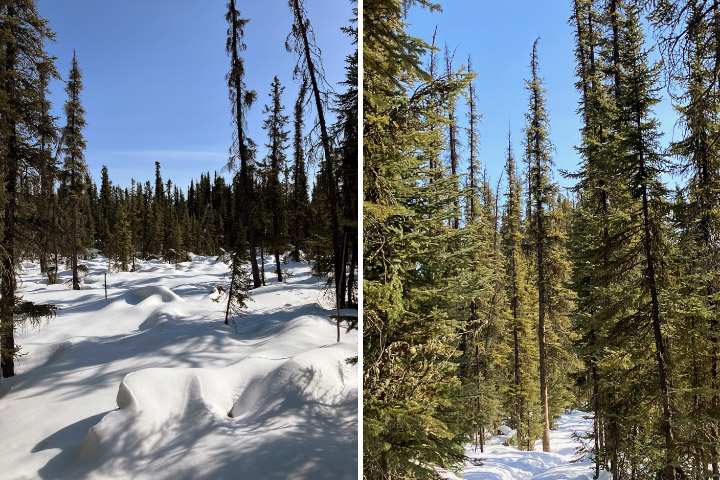
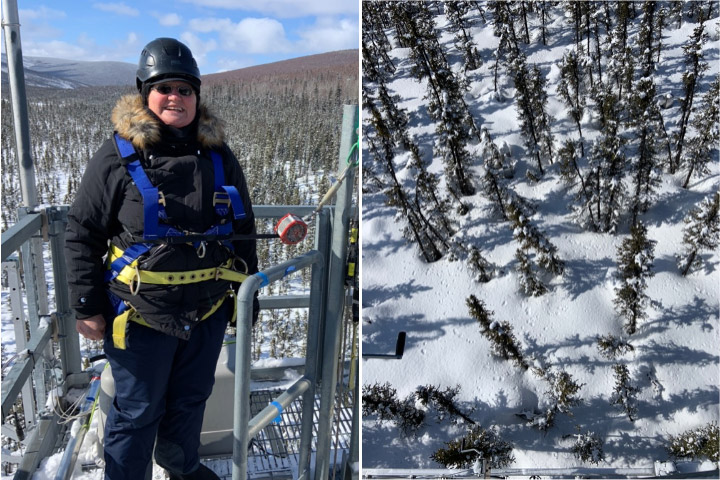
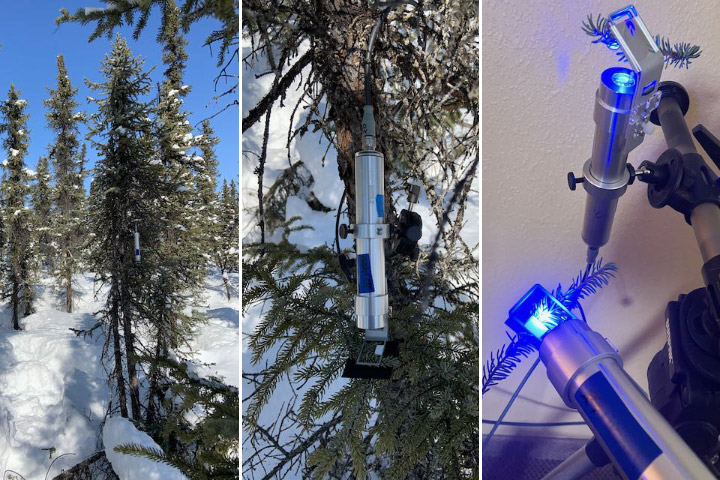
In July there was a big change from our previous visit in April. In April, the area had a deep snow cover with temperatures dropping below 0°F, while during this visit the daytime temperatures were in the 80s F and the ground was now all green (images below).
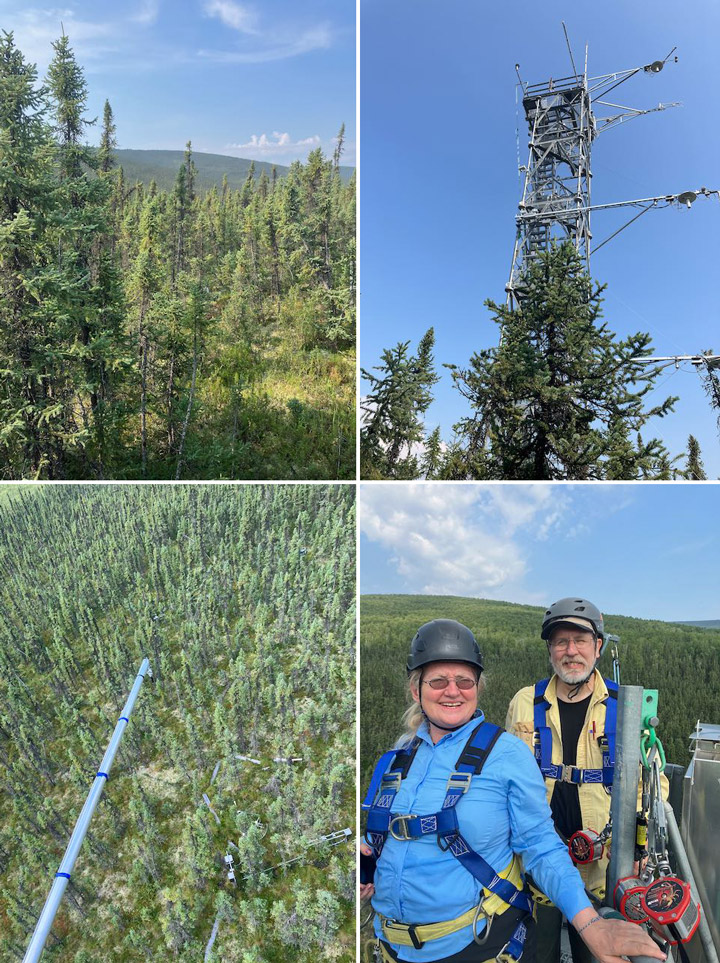
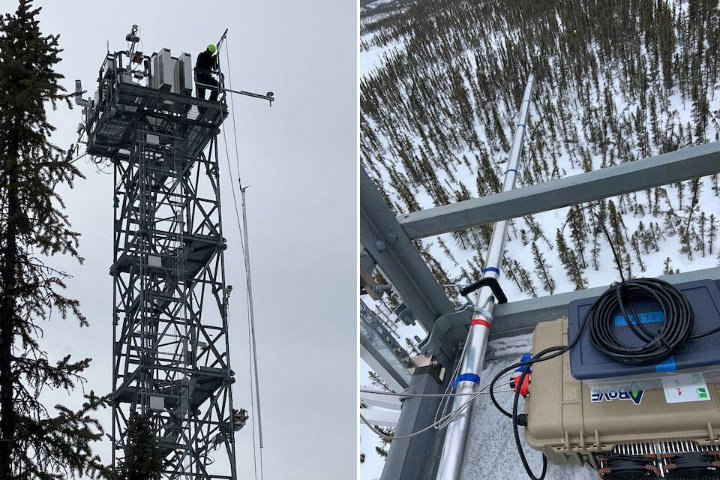
On the top of the tower we have an instrument called a FLoX (Fluorescence Box). The FLoX views a patch of forest from above, and every few minutes during the day it measures the reflected light and solar induced chlorophyll fluorescence. This provides us with a description of plant activity at different times of the day through the growing season (images below).
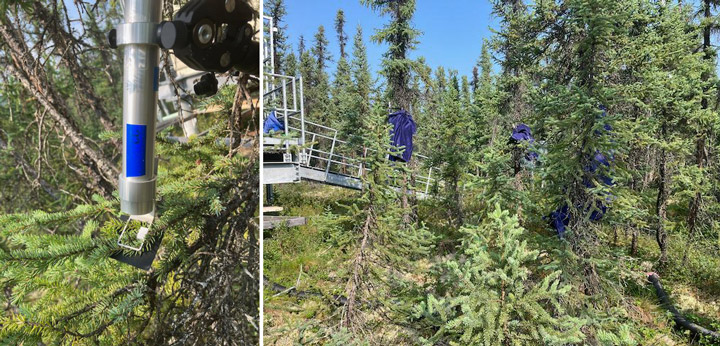
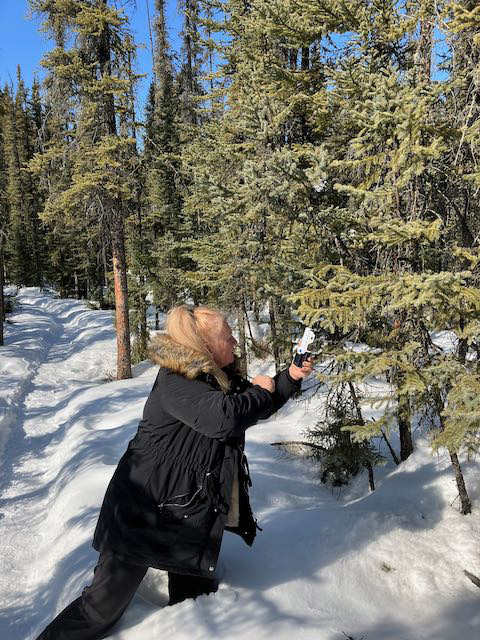
Also at the site we have monitoring PAM (MoniPAM) instruments attached to shoots of the spruce trees. The MoniPAM probes shine pulses of light at individual spruce shoots to measure fluorescence and photosynthetic processes at the leaf level (images below). We put blankets over the probes for a while to dark-adapt the shoots to measure their response when unstressed. In the spring, we put the MoniPAM probes in easy-to-reach places when there was a lot of snow on the ground. On this trip, when we returned to check them in the summer, we found we had to really reach up to get them without the snow to stand on.
From the ground, we collected reflectance and fluorescence measurements (similar to the data collected by the FLoX) of individual plants in the FLoX field of view and a variety of representative plants in the larger area surrounding the tower. These measurements will help us understand the local variability (images below).
A lot of the ground cover was cotton grass (Eriophorum spp.) that forms tussocks, which are tight clumps of grasses. The tussocks made walking through the area difficult, like walking on half-buried basketballs, so it was easy to twist an ankle, especially with a heavy backpack spectrometer on your back.
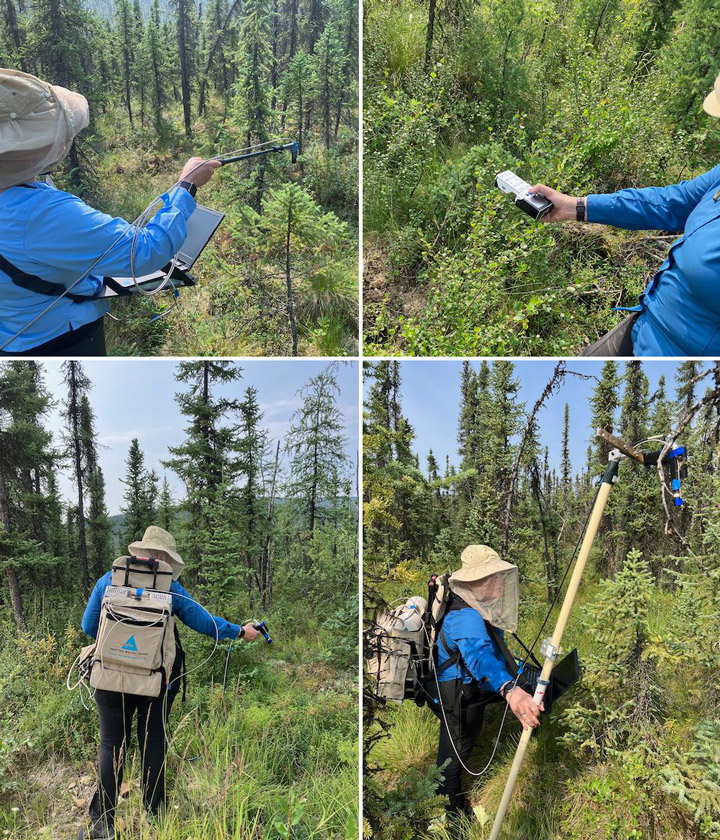
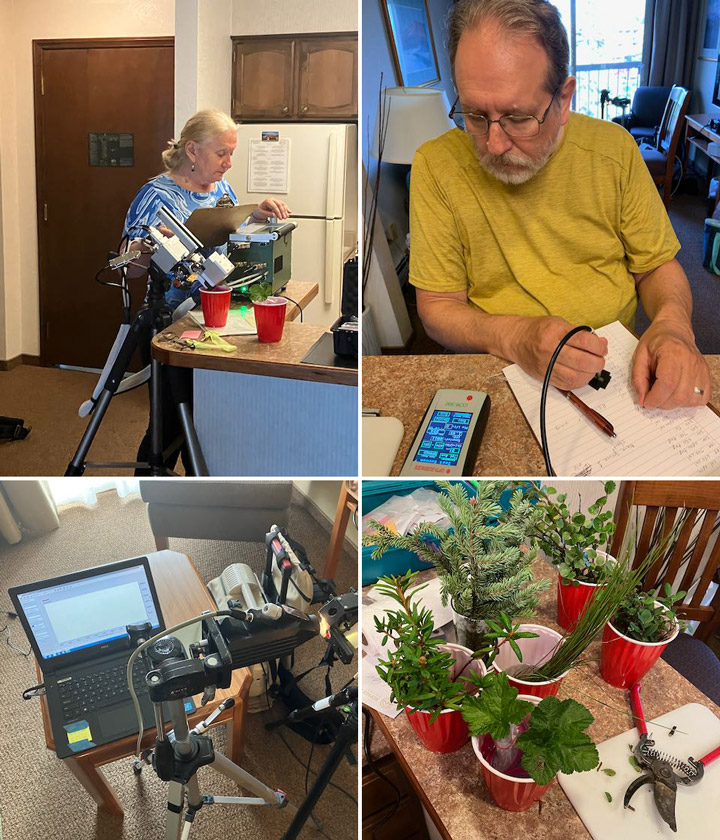
We collected branch samples to make measurements of leaves and needles that we will use to parameterize models of vegetation fluorescence and productivity (images below).
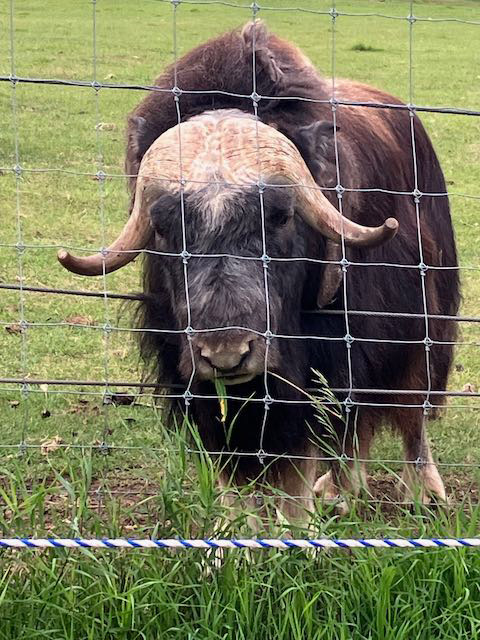
We took a little time off to visit some other places in the area. We saw musk ox, which are animals of the tundra but raised in captivity at the University of Alaska Fairbanks’ Large Animal Research Station. Their thick, shaggy coat keeps them warm through the frigid arctic winters. Under the long guard hairs is a soft wool called qiviut that musk oxen shed in the spring. Qiviut can be spun into a very warm and soft yarn. Small balls of qiviut yarn can sell for over $100.
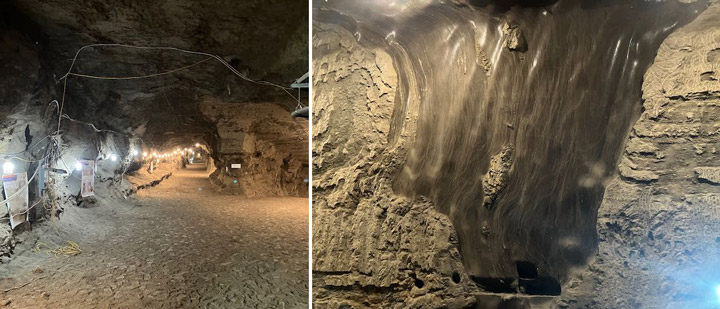
On our last day in Alaska we visited the Cold Regions Research and Engineering Laboratory (CRREL) Permafrost Tunnel Research Facility (images below). Permafrost refers to soil that has been frozen continuously for more than two years. The permafrost around Fairbanks, Alaska, is considered ‘warm’ (at a temperature of -0.3oC/-0.4oC) as compared to the permafrost in our other study site in the North Slope of Alaska at Utqiagvik (e.g., a temperature -3oC/-4 oC). This warm permafrost is very sensitive to the changes in soil temperatures that can result from fires, rain events, and other disruptions that can cause permafrost thawing. Thawing permafrost can result in damage to roads and buildings and cause disturbance in forests.
The permafrost tunnel is dug into a hillside through earth that has been frozen for thousands of years. The tunnel reveals bones of extinct ice age animals, plants preserved since the ice age, and large ice wedges that can take hundreds to thousands of years to form. The ice wedges cause the formation of polygonal patterned ground, where the ground surface is covered with a pattern of shapes of slightly higher or lower ground. Our study site in Utqiagvik was in an area of high centered polygons, so it was interesting to be able to actually see the shapes of the underground ice that formed that unique landscape.
The boreal forest is Earth’s northernmost forest. It circles the Earth at high latitudes, covering large parts of Russia, Canada, Scandinavia, and Alaska. These forests are some of the largest intact forests on Earth. They store a large amount of carbon—as much as (if not more than) is stored in tropical forests. The trees use photosynthesis to grow, and in the process, they take in carbon dioxide from the atmosphere. Carbon dioxide is an important greenhouse gas and a driver of global climate change, which is why it is vital to understand the rates of the transfer and storage of carbon between the atmosphere and the boreal forest.
Due to their vast area and remoteness, boreal forests are difficult to monitor from the ground. Data from satellites provide the means for observing these forests’ condition and detecting change across wide areas. In our project, “Clarifying Linkages Between Canopy Solar Induced Fluorescence (SIF) and Physiological Function for High Latitude Vegetation,” our team from University of Maryland Baltimore County, NASA’s Goddard Space Flight Center, and the University of Texas El Paso is working to develop advanced approaches to using satellite data to describe boreal forest productivity and detect stress responses. Our project is part of the NASA Terrestrial Ecology program’s Arctic-Boreal Vulnerability Experiment (ABoVE), a large-scale field study in Alaska and western Canada, whose overall goals are to make use of NASA technology to gain a better understanding of ecosystems at high latitudes, their responses to environmental change, and the effects of those changes.
A large proportion of the trees in the boreal forest are conifers, such as spruce trees (images above). These trees keep their green needles all year long. This makes it hard to determine when they start photosynthesizing in the spring, compared to deciduous trees, like oaks, where we can clearly see the growth of new green leaves in the spring.
The timing of the start of the growing season is key to determining the overall productivity of the forest and can be a useful predictor of possible stress events later in the summer. So, one of the goals of our project is to find ways to use light to detect when these evergreens “turn on” photosynthesis in the spring and actively start taking up carbon from the atmosphere.
This brought team members to Fairbanks, Alaska, right in the heart of the boreal forest. We arrived with our instruments in April 2023 to observe the very start of the boreal growing season. Our instruments use different methods to detect the onset and rate of photosynthetic activity in plants. One method we are using to identify photosynthetic activity in the evergreens is based on light that is actually emitted from the trees. Plants absorb light to power photosynthesis, but in the process of photosynthesis some of that light energy is radiated out from the plant; this is called chlorophyll fluorescence. This fluoresced light is very dim, which is why we don’t see plants glowing, but we can use sensitive instruments to measure fluorescence at leaf and canopy scales, which can even be done with instruments on satellites from space.
A second method is to detect very subtle changes in the color of the needles that are related to changes in the pigments in the leaves. Pigments such as chlorophyll, which makes leaves green, and carotenoids, which cause the yellow color of leaves in the fall, control potential rates of photosynthesis as well as provide protection to the leaves when stressed. These color changes are also subtle enough that we don’t see them with our naked eyes, but our instruments can measure and detect these pigment changes.
Instruments that are already on the flux tower measure the transfer of heat, moisture, and carbon dioxide between the atmosphere and the forest (images below).
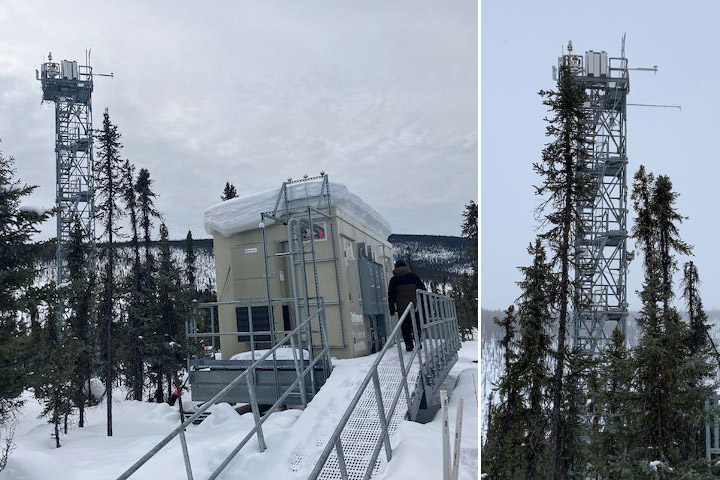
With the help of Jeb Timm, a NEON tower lead technician, we mounted our FLoX (Fluorescence Box) on the top of the tower. The FLoX looks down on the forest and measures the reflected light and solar induced chlorophyll fluorescence every few minutes continuously through the growing season (images below). FLoX measurements are similar to the data satellites provide, but with far more detail.
From the flux data we can determine photosynthesis rates and compare them with our fluorescence and reflectance measurements for relating the remotely sensed optical measurements to forest productivity. The continuous measurements allow us to examine the effects of varying light levels, moisture, and temperatures on the forest.
Near the flux tower we also put our MONITORING-PAM (MoniPAM) instruments whose probes actively illuminate individual spruce shoots with controlled pulses of light to measure fluorescence and photosynthetic processes at the leaf level (images below).
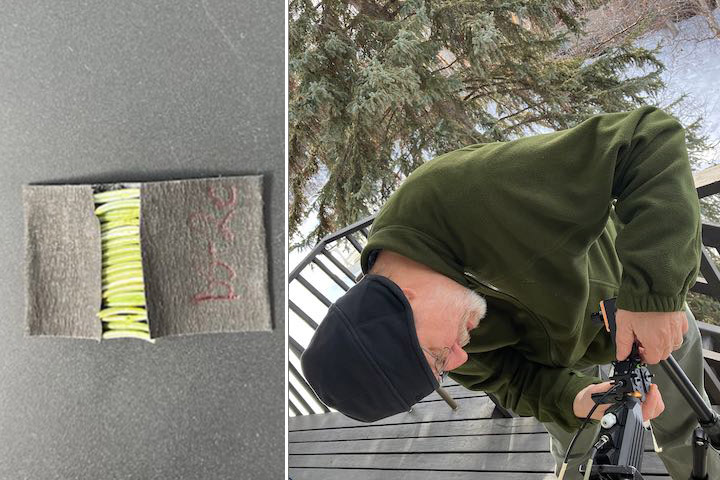
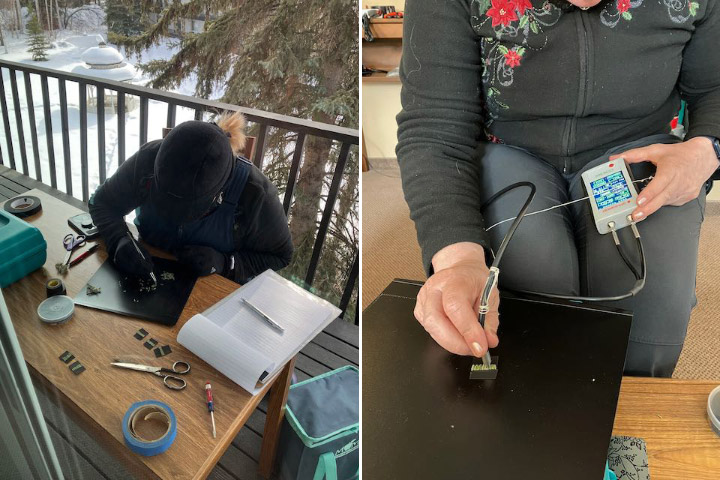
Besides setting up our instruments to catch the start of the growing season, we were hoping to be around when the spruce started to photosynthesize. This would allow us to test if we could detect the onset of photosynthesis through changes in needle reflectance due to changing pigment pools and/or fluorescence measured using a special leaf clip. To get consistent measurements using the same amount of needles, we had to pull off the individual tiny needles then line them up to make a solid mat to measure. And because photosynthesis and fluorescence are temperature sensitive, we had to make our measurements at the temperature the needles experience, so we worked on the deck outside in the cold (images below). The deck looked out on a big white spruce that was full of busy red squirrels who chattered and scolded us while we made our measurements.
Unfortunately, the temperatures mostly stayed below freezing the entire time we were there, so we didn’t get a chance to measure needles as they became photosynthetically active.
While we were there, there was also a NASA funded study of snow called SnowEx. In this part of the SnowEx study, researchers were studying changes in snow characteristics during the thaw period. The SnowEx field team made measurements of the snow on the ground, and NASA flew the Airborne Visible-Infrared Imaging Spectrometer – Next Generation (AVIRIS-NG) imaging system on an airplane, collecting high resolution canopy spectroscopy measurements. We plan to make use of the airplane imagery in our study to see if we can identify changes in tree reflectance (which is noise to the snow scientists) indicating the start of photosynthesis.
We will return in late July to collect measurements during the period of peak summer forest productivity.
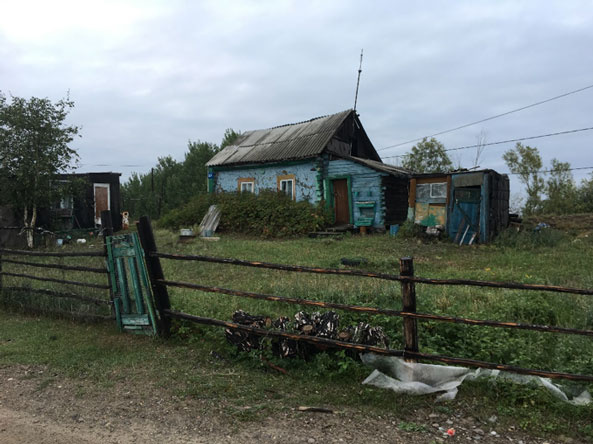
If only I could collect my thoughts about how I feel here in the tiny village of Batamay, idyllically located at the confluence of the Lena and Aldan rivers, after four weeks of campaigning in the burned larch forests of Northeast Siberia. But this process started much earlier. In December of last year we started analyzing satellite images to find suitable burn scars for carbon combustion sampling. Many people told me the idea of collecting data in Northeast Siberia is nice, theoretically, but logistically not feasible. These logistic challenges are likely part of the reason why so little data has been collected here. Yet, a data shortage in the large swaths of larch forests in Northeast Siberia is also a prime reason why we wanted to come here.
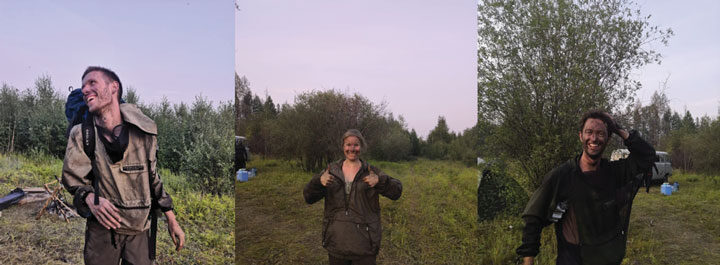
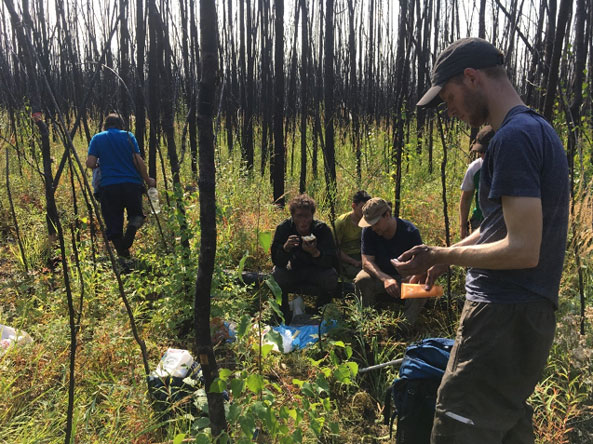
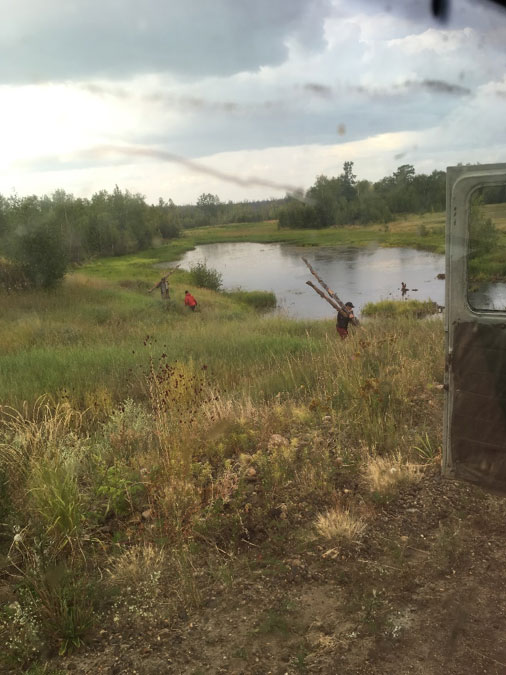
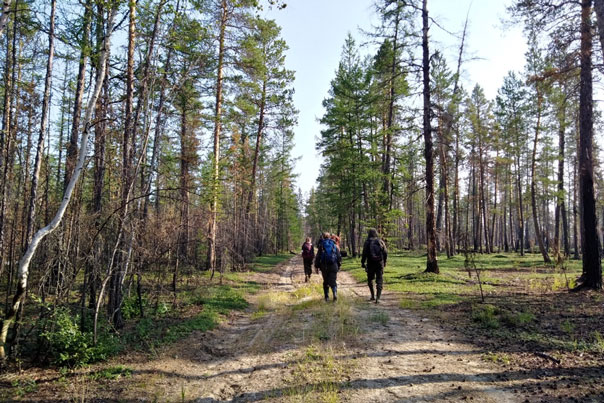
Are the logistical challenges in Siberia greater than in for example Alaska and Canada? From my experience, yes. This is mostly a matter of the difficult to travel ‘last mile’. It was surprisingly easy to reach the tiny villages of Ert and Batamay (of approximately 500 and 200 people), the small villages near our burn scars of interest. Reaching Batamay even included a scenic boat ride across the Lena river. From the villages it was about 5 km to the burn scar and 10 to 20 km to our camping sites. And this is where the adventure began. Did we get stuck in the mud? Yes, multiple times, but we made it out every time. Was it difficult to reach our sites? Yes, if often required scrambling over boggy grassland and woody debris, and through dense bush, but we always made it, and more importantly, we made it safely back to the camp. Were the stretches of camping and sampling physically challenging? Yes, we definitely felt weathered and sometimes charred, but rain or shine, we kept true to our goal of sampling more plots. And I feel proud about what we accomplished as a team! In total we measured 42 burned plots and 12 unburned plots. These plots cover gradients of forest types (larch and pine forests), fire severity and landscape position. In the fires, we collected data that will estimate carbon emissions. We also assessed how larch forests recover after fire and how the active layer, the seasonally thawed top layer of soils in permafrost regions, thickens after fire (at least before our active layer probe broke half way the campaign).
We are eager to analyze samples in the lab, and later interpret the data in our offices. We are hopeful the data we collected will improve our understanding of the role of fire in the Northeastern Siberian larch forests. We will graph our results, and write a manuscript. People will read our work, and may cite it and use our data. But we will be the only ones that know how this campaign really evolved; how we crossed rivers, woody debris and endless bush to get to these locations; how we shared our simple lunches of bread, salami, cheese, cucumber and tomatoes at some burned spot; how we were happy to finally take a serious wash in the banja, Russian sauna, when we came back in the village after days of camping. I am extremely thankful to my team for what we have accomplished. We realize that it is privilege to visit these remote places, yet this does not make the long days, difficult hikes and sometimes monotonous tasks any easier. We came from the Netherlands, USA and Russia to do this together. A big thanks to Clement, Rebecca, Dave, Tatiana, Brendan, Roman and Brian. I am also very grateful to our local collaborator Dr. Trofim Maximov from the Institute of Biological Problems of the Cryolithozone of the Siberian Branch of the Russian Academy of Sciences. Without Trofim and his team, none of this would have been possible. I was also touched by the welcoming and warm-hearted locals from our host villages. They were very curious to our endeavors, and even though language barriers inhibited our conversations, they also helped making our campaign a success.
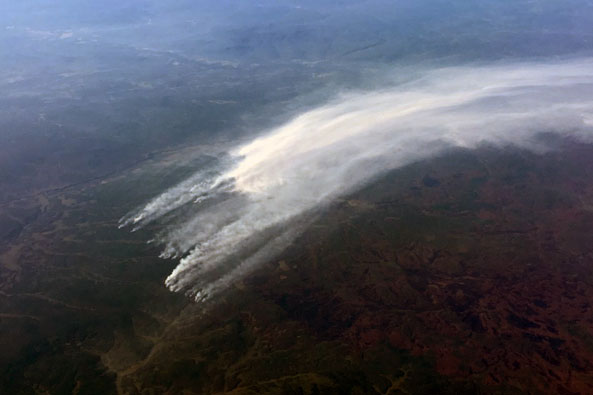
We sampled burn scars from 2017 and 2018. This year’s fire season in Siberia is extremely vigorous. Many days we experienced smoky skies partly veiling sunlight; a direct consequence of fires burning nearby. This year’s events also demonstrate the urgency of why we need to better understand the interaction between climate change and fires in Siberia. As our field campaign developed this year, we started talking more and more about next year’s campaign. We are intrigued by the current fires within the Arctic Circle in Northeast Siberia. We want to understand their climatic drivers and consequences. We will be back next year for Fire Expedition Siberia 2020.
This field campaign is part of the ‘Fires pushing trees North’ project funded by the Netherlands Organisation for Scientific Research (NWO) and affiliated with NASA ABoVE. This blog post was written by Sander Veraverbeke, assistant professor in remote sensing at Vrije Universiteit Amsterdam, and project lead of ‘Fires pushing trees North.’
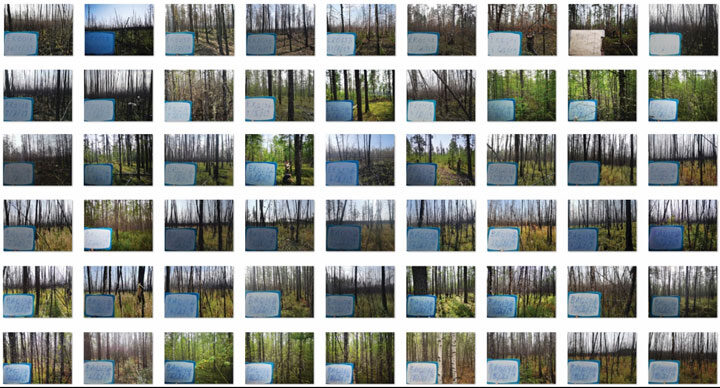
DBH (diameter at breast height)… 3.7 cm, killed by fire, severity 2, … adventitious roots at 7 cm (adventitious roots are small additional roots that larch trees have that help determine the depth of burning in the organic soil layer). Those are the words that would repeatedly disturb the forests’ eternal silence, besides the occasional call of a black woodpecker. This routine is part of making an inventory of the many trees (varying from roughly 50 to more than 300) that cover the 30 meter by 2 meter transect that is laid out in the field plot of interest. Such a transect is selected based on homogeneity in fire effects and assumed to represent a larger area of 30 by 30 meters, the size of a Landsat satellite pixel. This enables the direct comparison of ground s and satellite observations, which is in turn essential for upscaling to regional or continental scale estimates of available biomass and combustion.
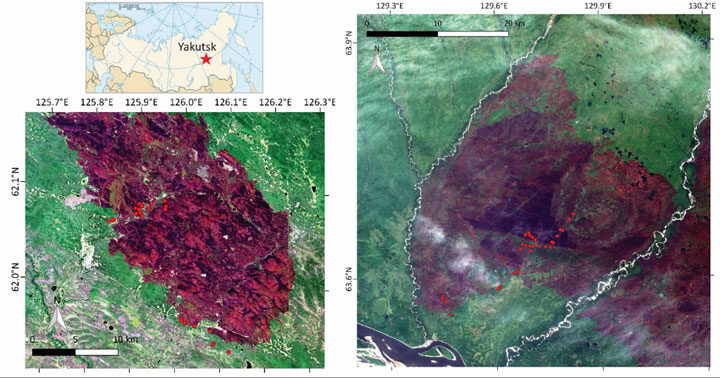
Our science team is in Batamay now, a small village about 170 km North of the capital of Yakutia and the coldest city on Earth, Yakutsk. Compared to our previous location, Ert, this is farther away from the main cluster of large fires that plague Siberia right now. However, fires are also active here, as I witnessed during my flight from Amsterdam to Yakutsk.
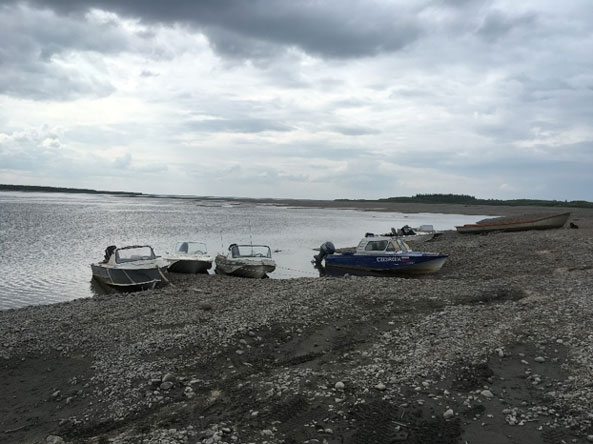
In order to get to Batamay, we had to drive for multiple hours and cross the Lena river by boat. The boat trip was not exactly like the luxury Lena river cruise that can be booked to visit the well-known ‘Lena pillars’, but it brought us to our study destination. After reaching Batamay, we continued our travels using one of these typical sturdy Russian vans to the designated camp site for a week of camping inside the burn scar that we wanted to measure. This burn scar is the result of a particularly high severity fire from 2017. The current science indicates that fires in Siberia are mostly low severity surface fires compared to the high severity crown fires in boreal North America. The high severity core of the Batamay burn scar may be out of the ordinary and attracted our interest. Could Siberian fires locally be more severe than thought and do we underestimate their emissions? Furthermore, what does this potential of high severity fire in Siberia mean for the future fire regime in a changing climate?
On the way from Yakutsk to the burn scar we have had some fine demonstrations of the Yakutian approach to problem solving. Little time is spent on overthinking possible issues beforehand, and instead problems are solved on the spot. Surprisingly, this method has been successful in every occasion we experienced an obstacle. For example, when a stretch of water is too shallow for a boat to float or a road too muddy for a car to cross, the consequences are faced instead of avoided, but always solved afterwards. This radiates a certain simplicity and relaxed approach to life that is almost fully opposed to the scientific approach and might be hard to relate to as westerners. What do the locals actually think of our complicated scientific instruments and methodologies? Sadly this is hard to say, because of the locals’ Yakutian language which is closer to Turkish than Russian (as if Russian wasn’t hard enough already) and introduces multiple new letters to the Cyrillic alphabet. And also because the locals are not men of many words anyway. However, like everyone else, these people also notice the effects of climate change, such as warmer winters and more heavy rain spells, such as the recent floods near Irkutsk
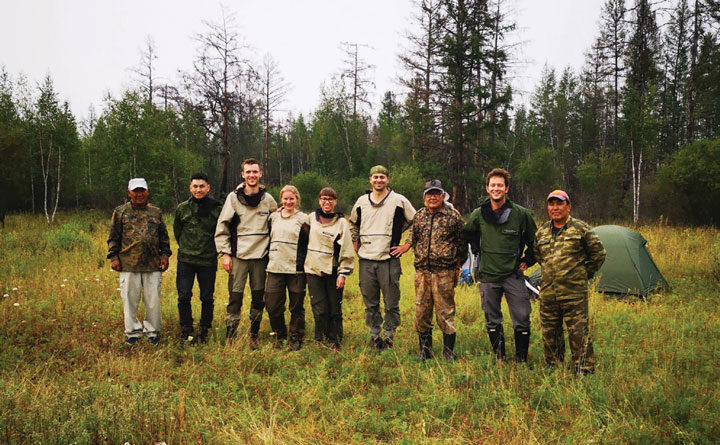
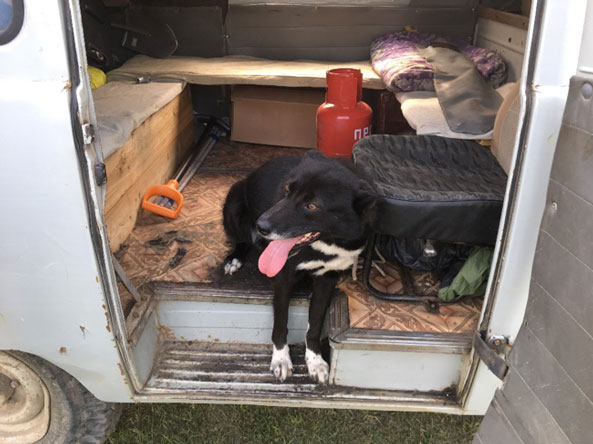
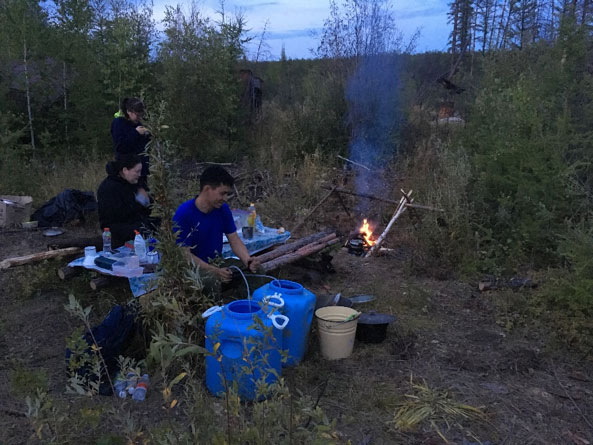
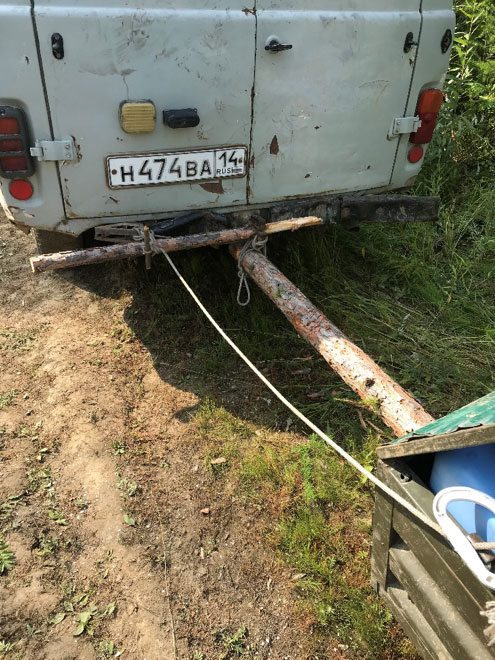
At the camp site, we were accompanied by five locals from Batamay: a guard, a driver, two cooks, and a guard dog. It was comforting to have this company and it is safe to say that this made all of us sleep better at night. In a matter of minutes a patch of tall grass was transformed into a cosy camp site including a fire place, picnic table and food warehouse, all made from the branches and logs available in the forest, and some old containers used previously by road constructors. Another great example of what you can construct from logs: a trailer able to withstand all bumps we faced on the road.
During our camping stay in the Batamay burn scar we have collected data from 24 field plots with varying degrees of fire severity. The coming week we will stay in a house in village and we will venture out in the fire scar again. Now we will focus more on unburned ‘control’ plots. This allows the comparison of the situation before and after the fire, which gives invaluable insight in quantifying the greenhouse gas emissions from the fire.
This field campaign is part of the ‘Fires pushing trees North’ project funded by the Netherlands Organisation for Scientific Research (NWO) and affiliated with NASA ABoVE. This blog post was written by Dave van Wees, PhD student at Vrije Universiteit Amsterdam, studying global fire emissions using satellite data and biogeochemical modeling.
After the Tomsk campaign, we traveled to Yakutsk for the next leg of the campaign that came with new scientific objectives. Our team now included three members from Vrije Universiteit Amsterdam, two members from Woods Hole Research Center and one collaborator from the Institute of Biological Problems of the Cryolithic Zone from the Russian Academy of Sciences. Our destination was a burn scar from last year’s fire season near the small village of Yert, approximately 200 km West of Yakutsk and surrounded by larch forests, sometimes mixed with pine forests, growing on permafrost terrain. Approximately 20% of the boreal biome are dominated by deciduous larch forests, yet we do not really know how wildfires influence carbon stocks of these ecosystems. We aimed to fill parts of these knowledge and data gaps by collecting ground measurements to quantify the amount of carbon released during these fire events. This is also a formidable opportunity to see on site what these forests look like before studying it at larger scales from satellite data.
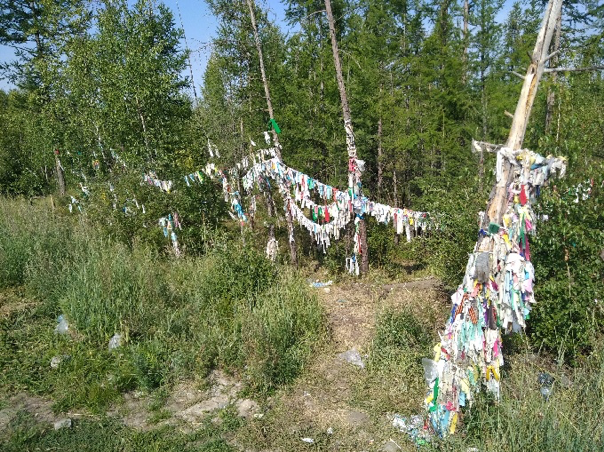
Our first task was to reach our camping site located within the burn scar of approximately 900 km2. On our way to the field site our local collaborator and driver showed us how the forests are honored in Yakutian culture. We made several stops along the road to worship the Bayanay spirit, the spirit of hunting, taiga, and its animals and birds, by leaving several presents on trees. Our local collaborators told us that these offers would bring good luck to our field campaign. Thus, of course we were very generous.
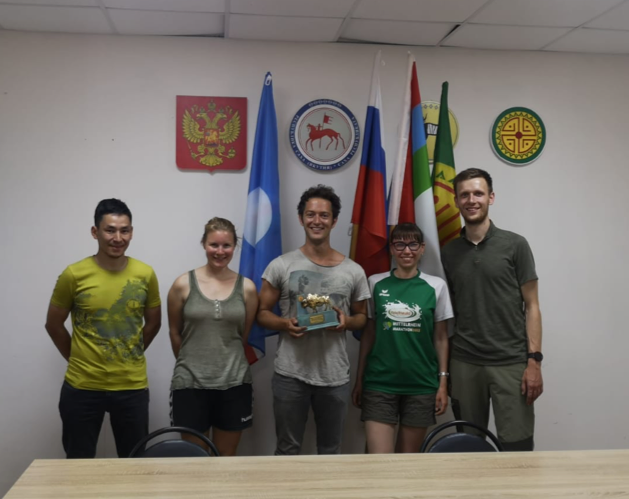
We had been told that locals from Yert were quite excited that an international team would visit their village. Indeed, when our team arrived at the village after a five-hour drive from Yakutsk we were kindly welcomed by the chief of the village with a cup of kumiz, local drink of fermented horse milk, and several local dishes. While having tea we talked more about the scientific goals of our campaign, and the local surroundings. They were also intrigued about the fact that our ‘Dutch’ team consisted of team members of French, German, Belgian, American and Russian nationalities. When we selected this little village as our access point to access the burn scar several months ago several thousand kilometres from here, in Amsterdam, using road maps and satellite images, we had no idea that this local community would be so welcoming and honored by our visit.
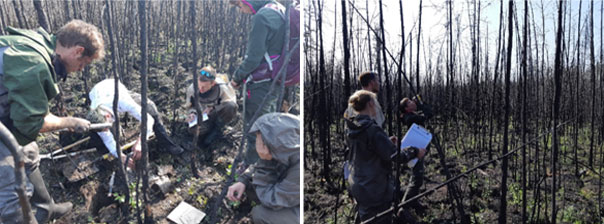
The first five days we sampled burned plots with gradients in fire severity, soil characteristics and vegetation composition. In each plot, we performed a wide range of measurement including soil sampling for carbon analysis, aboveground biomass and combustion estimates, active layer thickness measurements, tree cores for stand age estimates and post-fire tree seedling counts. Getting into these plots in such a remote area was quite challenging as we had to hike in dense bushes or waterlogged grasslands carrying all the equipment and freshly collected samples, and some days were unfortunately rainy. With these wet and cold conditions, the camp fire became an important place after the working days to dry clothes, but also to keep positive minds sharing tea and snacks together. It was worth facing these tough conditions as we made some interesting and unexpected observations. For example, we did not expect to find relatively young, approximately 50 to 60 years old stands, that were very dense and burned with high severity.
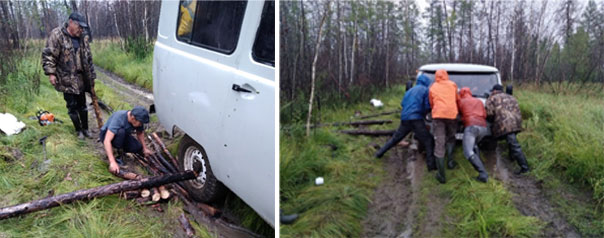
Waking up with rain showers in the morning of the fifth day of the campaign, we decided in a hurry to return to the village one day earlier than originally planned. More than working under rainy conditions, we were worried about the road that could become too muddy, even for our sturdy all-terrain van. We got indeed stuck multiple times on the muddy road back to the village, but thanks to a collective ‘pushing’ effort of the team and particularly to the amazing skills of our driver and ‘hero’ Dima, we safely made it out through 15 kilometres to the village after four hours on a muddy forest road. And this was supposed to be our rest day!
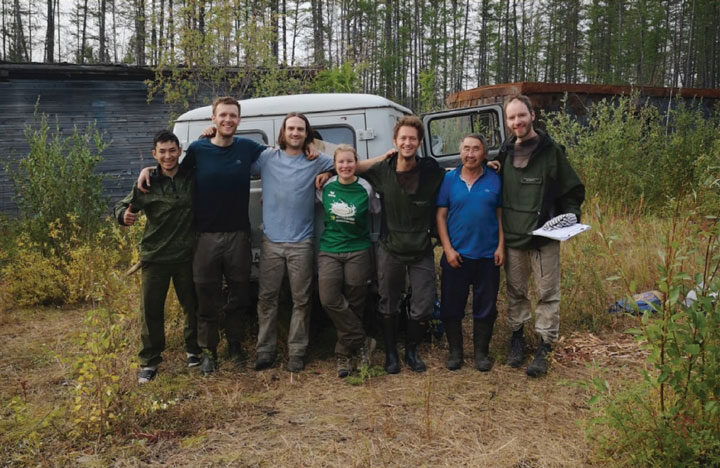
The work in the second week around this burn scar aimed at finding and sampling unburned sites along a forest road. These unburned plots were selected as ‘best’ matches of our burned plots by having similar forest compositions and landscape positions. The measurements in these ’control’ plots will allow us to estimate pre-fire carbon stocks, and thus act as a reference for comparison with our burned sites. While the comfort of staying in the village and sampling along the road may sound easier than our earlier camping experience, we ran into several unexpected mishaps. Our van suddenly broke down on a seemingly ‘easy’ part of forest road, and one team member had to recover from a muscle strain for two days. We quickly learned making a plan B… or even plan C. Luckily, we could rely on our local collaborator and driver, which were of a tremendous help throughout the campaign in addition to taking care of most of the logistics. They were very helpful in sharing knowledge on the ecosystems, but also cooked delicious meals. The jury is still out whether Dima’s soup or Roman’s pasta was the best meal.
We collected data in 24 sites which will enable us to better understand carbon emissions from fires in these larch ecosystems. This dataset will be completed with similar measurements that we will make in another burn scar on the opposite side of the Lena river North of Yakutsk in the upcoming ten days.
This field campaign is part of the ‘Fires pushing trees North’ project funded by the Netherlands Organisation for Scientific Research (NWO) and affiliated with NASA ABoVE.
This blog post was written by Clement Delcourt, PhD student at Vrije Universiteit Amsterdam, researching carbon emissions from boreal fires.
