
A successful field campaign collecting meteorological and hydrological data almost always involves a forecasting element. A detailed high quality forecast briefing on the potential evolution of weather events allows the scientists behind the scenes and out in the field to make crucial decisions that ultimately may determine the success of a project. While many joke that weather forecasters are allowed to be wrong half of the time, making a forecast that can affect the outcome of data collection is a serious task. Whether it be forecasting for strong winds (which affects the manual installation of multi-million dollar high resolution radar systems) or large hail (which can damage these expensive tools), providing the most accurate information possible was the primary goal for us at Iowa State University who provided a weather briefing every morning during IFloodS.
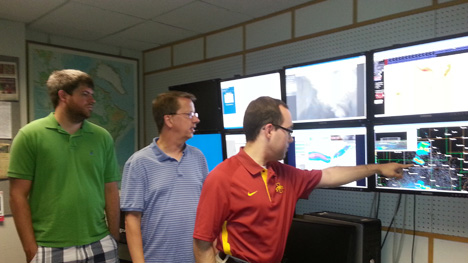
- Iowa State University Forecasters Dr. William Gallus (middle) and Graduate Assistants Brian Squitieri (right) and Ben Moser (left) evaluating storms in real time and determining the areas that might be at greatest risk for experiencing flooding conditions and severe weather. Credit: Iowa State University
Each day, our forecast team of Dr. William Gallus, Ben Moser, and myself (Brian Squitieri) woke up bright and early to prepare the 9 AM weather briefing. We began each day by evaluating precipitation and stream data from the recent past to determine the extent of ground saturation present or the current height of the streams. This information is vital for making a flood forecast, particularly during a progressive weather pattern, where a series of atmospheric disturbances moving overhead may bring multiple days of heavy rainfall.
We as forecasters may determine a specific region or location that may be at greatest risk for experiencing flooding if we know the precipitation and river/stream gauge data for specific areas most affected by previous rainfall events and the current observations and model output –mathematical representations of the laws of physics used to simulate atmospheric features into the future. This is especially the case if model trends place the same area at risk for heavy rainfall that had experienced significant accumulations in the recent past.
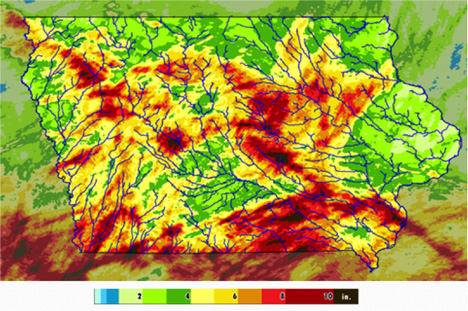
Rain gauge measurements and interpolation of rainfall totals within a six day period (valid 8 AM 05/31/2013). Areas of darkest red show regions that have accumulated the most rainfall. Rivers, streams, and sub-basins in these areas are most vulnerable for future flooding. Extra attention is thus given to these areas by the forecasters. Credit: NASA
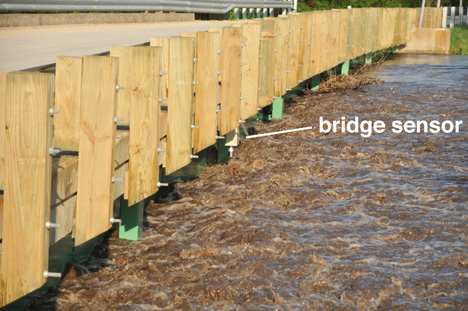
May 20, 2013. Bridge sensors like this one on the Little Cedar River measure the height of the water below it. When compared with past data, these measurements allow researchers to determine if the river is at flood stage or above. Credit: Iowa Flood Center
While one of the main goals of the IFloodS project was to evaluate precipitation events, observing and understanding severe thunderstorm events proved to be an equally vital component of the mission. Not only do many heavy rainfall events originate from severe thunderstorms, but the storms themselves can prove to be very damaging and pose a threat to the researchers and their equipment. As such, we had the additional duty of providing the most up to date forecast information from observations and model runs regarding the potential development of severe weather. Details included what the primary hazards were (strong straight line winds, large hail, tornadoes, or some combination of the three), where the most likely regions of impact were and what time frame was most favorable for the activity to occur.
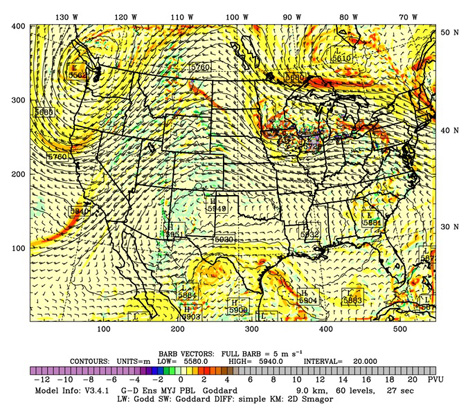
This map shows the atmospheric pattern at 500 mb for 7 PM CST 06/12/2013. A low pressure disturbance with a “U” shaped pattern over Iowa creates favorable conditions for air to rapidly rise upward to create showers and thunderstorms. Credit: NASA
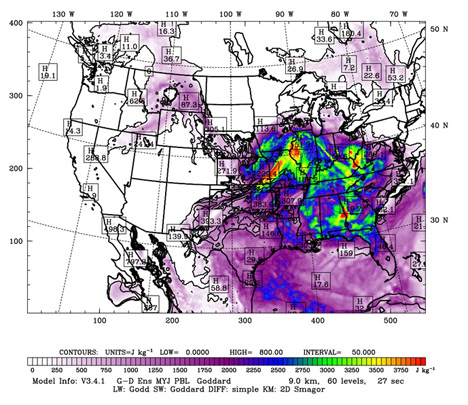
This map shows the Convective Available Potential Energy (CAPE), the amount of energy available for thunderstorm to form and produce strong updrafts, capable of large hail and tornadoes (image valid for 4 PM CST 06/12/2013). Across Iowa, there is an east to west boundary dividing higher CAPE south from lower values immediately to the north. It is along this “CAPE Boundary” that one would expect severe storms on this particular day. Both this image and the one above are generated from the high resolution NASA Unified Weather Research and Forecasting (NU-WRF) model. The model run was initialized at 7 PM CST on 06/11/2013 and the images above were forecasts valid 24 and 21 hours into the simulation. Credit: NASA
One challenging event requiring accurate forecasting of both heavy rainfall and severe weather occurred June 12, 2013, where eastern Iowa was under the gun for significant severe thunderstorms. Observations and model outputs showed that the atmosphere was primed for a potential outbreak of thunderstorms. Supercells were expected with an initial threat of large hail (perhaps larger than golfballs) and strong tornadoes.
Within a few hours of development, a line of powerful storms was expected to further develop as the supercells would merge with each other and produce a widespread swath of very damaging straight line winds. Our Iowa State University Forecast team had briefed the IFloodS project at 9 AM of the potential for a dangerous weather event, particularly for the eastern most Iowa counties in the IFloodS project domain. The Waterloo area was of specific concern because the N-POL radar was located there and was susceptible to hail and wind damage.
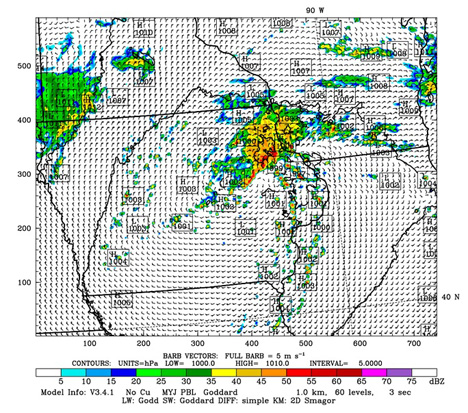
The image is NASA WRF model output from the 7 PM CST June 11, 2013 model run. It simulates what the radar would see in 24 hours at 4 PM CST on June 12, 2013. Credit: NASA
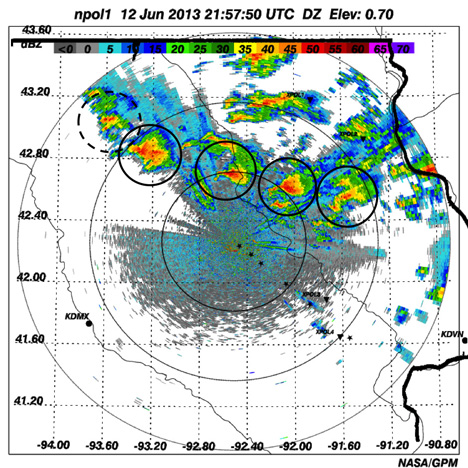
Actual radar measurements of the thunderstorm supercells at 3:57 p.m. CDT on June 12. Note the scale is not the same as the model output. Credit: NASA
This forecast proved to be rather accurate, as a northwest to southeast oriented line of supercell thunderstorms developed and moved just a few miles north of the city of Waterloo. While the damaging tornadoes were mainly confined immediately to the west and east of I-35 during a 45 minute period, large hail and winds threatened the rural areas immediately north of Waterloo.
Overall, the IFloodS project forecasting tasks proved to be an enlightening, challenging and exciting experience for the three of us. We learned a lot, and were especially happy with the use of the NASA Unified Weather Research and Forecasting (NU-WRF) mode, which proved to greatly enhance the accuracy of the forecasts themselves. While this tool was experimental, its first 24 hours of output handled the placement, timing and intensity of rainfall events very well. We quickly noticed the skill of this product and openly praised its usefulness in operations. Lastly, we thoroughly enjoyed this experience, and though the work was difficult at times, we look forward to possible similar future collaborations.
From May 1 to June 15, NASA and Iowa Flood Center scientists from the University of Iowa measured rainfall in eastern Iowa with ground instruments and satellites as part of a field campaign called Iowa Flood Studies (IFloodS). They will evaluate the accuracy of flood forecasting models and precipitation measurements from space with data they collect.