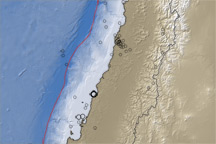
This map of topography and water depth reveals subduction’s influence on the West Coast of South America near the epicenter of the 8.8-magnitude earthquake that struck Chile on February 27, 2010.
Published Mar 2, 2010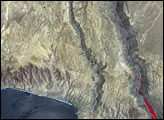
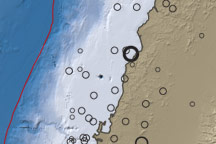
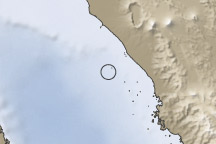
This map of topography and water depth along the Chilean coast includes black circles that indicate aftershocks with a magnitude of 5.0 or larger that occurred between March 5 and 12, 2010, following the large earthquake on February 27.
Published Mar 11, 2010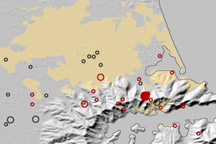
This map shows the location of earthquakes on near Christchurch, New Zealand between September 3, 2010, and February 22, 2011.
Published Feb 23, 2011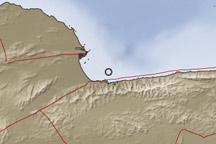
A strong earthquake struck off the Venezuelan coast on September 12, 2009.
Published Sep 15, 2009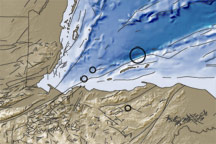
This image shows the topography and bathymetry of the region surrounding the earthquakes that occurred on May 28-29, 2009. Red circles indicate quake locations, and fine black lines indicate fault lines.
Published May 30, 2009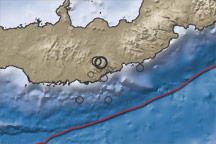
This color-coded map shows the topography, bathymetry, fault lines, and earthquake locations related to earthquakes in New Britain on July 18–19, 2010.
Published Jul 20, 2010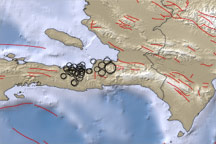
This map shows the region around the earthquake that struck the Haitian capital of Port-au-Prince on January 12, 2010. Blue areas indicate water and brown areas indicate land. Lighter colors indicate higher elevation or shallower depth. Circles indicate earthquake locations, with circle size corresponding to earthquake magnitude. Lines indicate faults.
Published Jan 13, 2010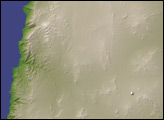
This image shows the topography and bathymetry near Sumatra, Indonesia, where hundreds or thousands of people were feared dead in the wake of a magnitude 7.6 earthquake that struck on September 30, 2009.
Published Sep 30, 2009alert message
