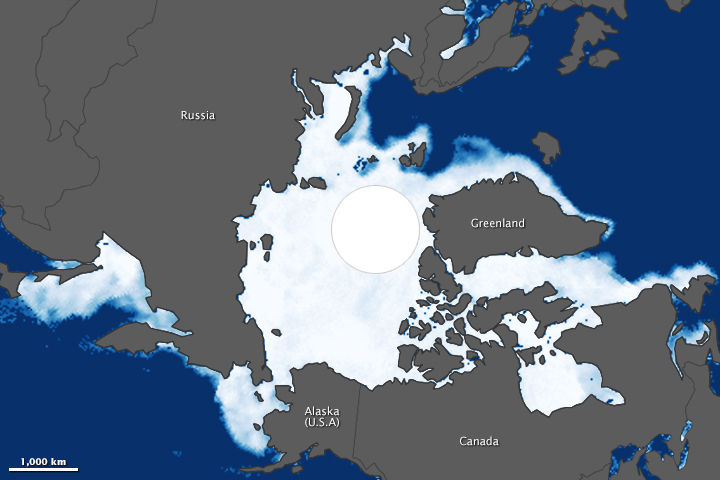

The sea ice cap atop the Arctic Ocean appeared to reach its annual maximum extent on February 25, 2015, scientists at the National Snow and Ice Data Center (NSIDC) announced in their latest analysis. At 14.54 million square kilometers (5.61 million square miles), this year’s maximum extent was the smallest in four decades of satellite records. It was also one of the earliest maxima.
Arctic sea ice—frozen seawater floating on top of the Arctic Ocean and its neighboring seas—is constantly changing. It grows in the fall and winter, reaching its maximum between late February and early April. It shrinks in the spring and summer until it reaches its minimum extent in September. The past three decades have seen a downward trend in sea ice extent during both the growing and melting season, though the decline has been steeper in the melting season.
This year’s maximum was reached 15 days earlier than the 1981 to 2010 average date of March 12. Ice conditions have been below average everywhere except in the Labrador Sea and Davis Strait. A late spurt of ice growth is possible, but it is unlikely now that spring sunlight is arriving in the Arctic Circle. If the maximum remains at 14.54 million km2, it would be about 130,000 km2 below the previous lowest peak (set in 2011).
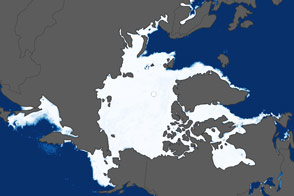
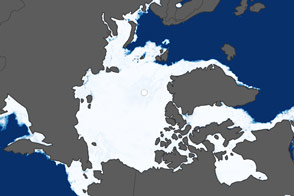
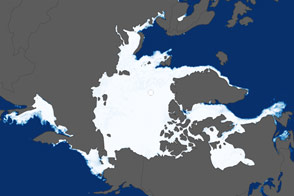
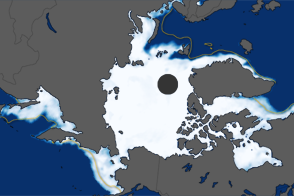
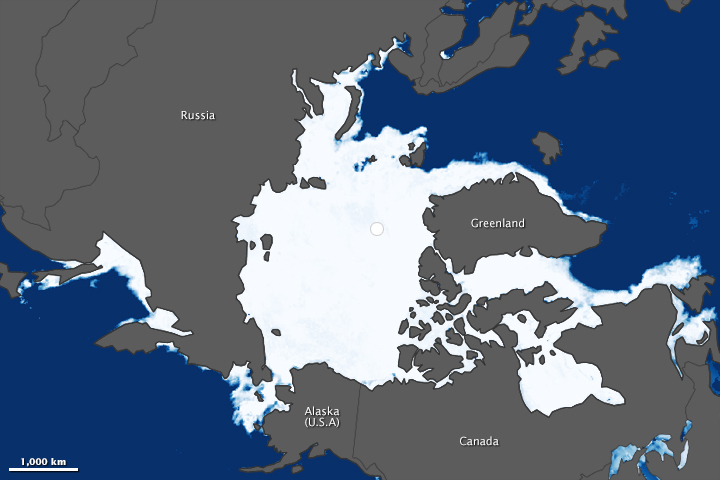
The maps above show Arctic sea ice extent on February 25, 2015 (top) and March 14, 1983 (bottom). Extent is defined as the total area in which the ice concentration is at least 15 percent. According to NSIDC, the average maximum extent for 1979–2000 was 15.46 million square kilometers (5.96 million square miles). The 1983 maximum covered roughly that extent, so a comparison between 2015 and 1983 gives an idea of how conditions this year strayed from the long-term average. Turn on the image-comparison tool to see the differences.
The biggest variable in the wintertime maximum tends to be the seasonal ice at the edges of the ice pack. On the maps above, this is most obvious along the Pacific coasts of Russia and Alaska, and around Greenland and Labrador. The ice in these regions is thin and at the mercy of the winds. Winds from the south can drive ice northward while bringing warm air and water that makes the ice melt; cold winds out of the north allow more sea ice to form and spread toward lower latitudes.
A record low sea ice maximum extent does not necessarily lead to a record low summertime minimum extent. “The winter maximum gives you a head start, but the minimum is so much more dependent on what happens in the summer,” said Walt Meier, a sea ice scientist at NASA’s Goddard Space Flight Center. “Scientifically, the yearly maximum is not as interesting as the minimum because it is highly influenced by weather. We’re looking at the loss of thin, seasonal ice that is going to melt in the summer anyway, and it won’t become part of the permanent ice cover. With the summertime minimum, when the extent decreases, it’s because we’re losing the thick ice component, and that is a better indicator of warming temperatures.”
The 2015 map was compiled from observations by the Advanced Microwave Scanning Radiometer 2 (AMSR-2) sensor on the Global Change Observation Mission 1st–Water (“Shizuku”) satellite, operated by the Japan Aerospace Exploration Agency (JAXA). The 1983 image was made from observations by the Scanning Multichannel Microwave Radiometer) on the Nimbus-7 satellite. The white circle over the pole is a data gap caused by how satellites fly close to but not directly over the poles. Wider coverage by AMSR-2 has shrunk the size of this gap. The area within the circle is ice-covered—an assumption confirmed by many surface expeditions—but researchers use an average of the ice just outside the gap to estimate the extent within.
NASA Earth Observatory images by Jesse Allen, using data from the Advanced Microwave Scanning Radiometer 2 (AMSR-2) sensor on the Global Change Observation Mission 1st-Water (GCOM-W1) satellite and the Scanning Multichannel Microwave Radiometer (SMMR) on the Nimbus-7 satellite. Caption by Maria-Jose Viñas, NASA Earth Science News Team.