The Earth Observatory has published its last Image of the Day on this website. Please join us on our new home at science.nasa.gov/earth/earth-observatory.
In September 2012, the ice cap over the Arctic Ocean shrank to its lowest extent on record, about half the size of the average summertime extent from 1979 to 2000. That sea ice minimum continued a long-term trend of diminishing ice cover over the past few decades.
During the darkness and bitter cold of Arctic winter, new sea ice forms and older ice re-freezes and grows. This growth typically reaches its maximum extent in late February or early March.
According to a NASA analysis, this year’s annual maximum extent was the fifth lowest in the past 35 years. The yearly maximum—15.09 million square kilometers (5.82 million square miles)—was reached on February 28, 2013, according to scientists at NASA’s Goddard Space Flight Center. The 2013 winter extent is 374,000 square kilometers (144,402 square miles) below the average maximum extent for the past three decades.
Scientists at the National Snow and Ice Data Center (NSIDC) assert that the Arctic ice maximum occurred on March 15, 2013. Their calculated extent of 15.13 million square kilometers (5.84 million square miles) was less than half a percent from the NASA maximum extent. The two institutions use slightly different methods in their sea ice assessments, but overall their trends show close agreement. In both cases, the 2013 measurement fits with the ongoing trend: nine of the ten smallest ice maximums in the satellite record have occurred in the past decade.
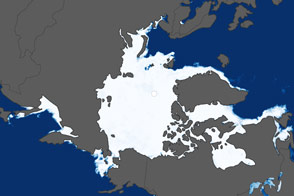
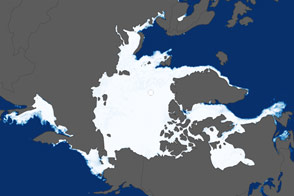
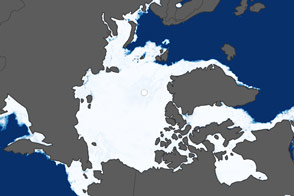
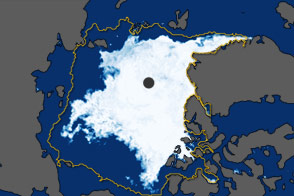
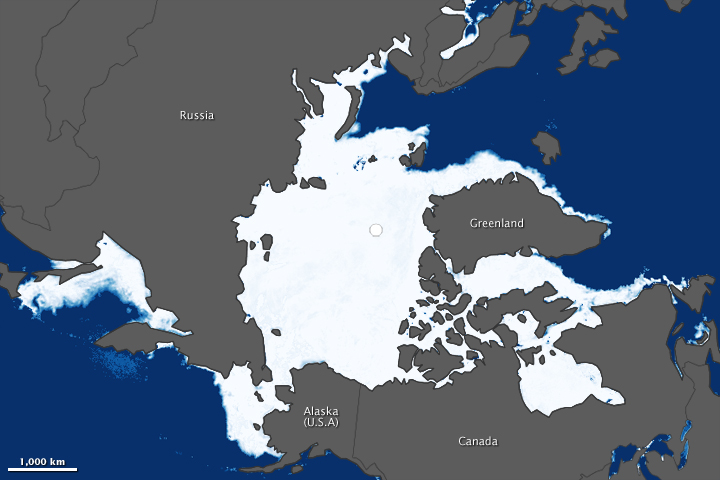
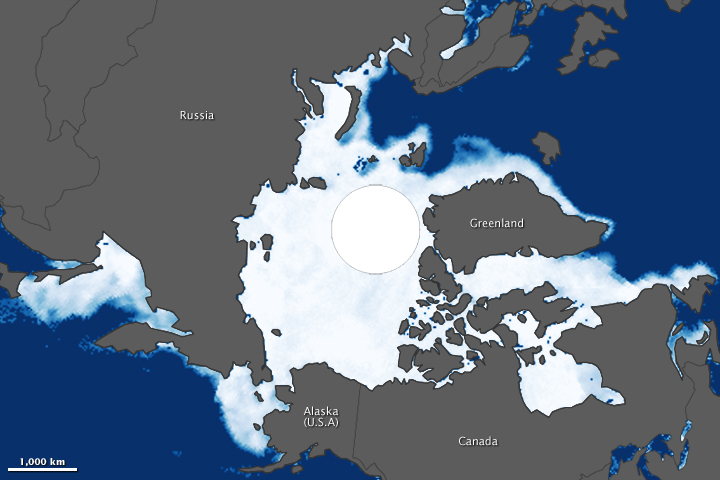
The maps above show the Arctic sea ice extents from March 15, 2013 (top) and March 14, 1983 (bottom), an average year for sea ice maximum. (Extent is defined as the total area in which the ice concentration is at least 15 percent.) According to NSIDC, the average maximum extent for 1979–2000 was 15.46 million square kilometers (5.96 million square miles). The 1983 maximum covered roughly that extent, so a comparison between 2013 and 1983 gives an idea of how conditions in 2013 strayed from the long-term average. (Turn on the image-comparison tool to see the difference.)
The 2013 map was compiled from observations by the Advanced Microwave Scanning Radiometer 2 (AMSR-2) sensor on the Global Change Observation Mission 1st–Water (“Shizukuâ€) satellite, operated by the Japan Aerospace Exploration Agency (JAXA). The 1983 image was made from observations by the Scanning Multichannel Microwave Radiometer (SMMR) on the Nimbus-7 satellite. The white circle over the pole in each image is a data gap resulting from satellites flying close to—but not directly over—the poles. The wider coverage by AMSR-2 (and other satellite instruments) has shrunk the size of this gap. The area around the North Pole is ice-covered—an assumption confirmed by many airborne and ice-surface expeditions—but researchers use an average of the concentration just outside the gap to estimate the extent within.
The behavior of the winter sea ice maximum is not necessarily predictive of the following melt season. The long-term record shows there are times when an unusually large maximum is followed by an unusually low minimum, and vice versa. “You would think the two should be related because if you have an extensive maximum that means you had an unusually cold winter and the ice would have grown thicker and more difficult to melt in the summer,” said Joey Comiso, a senior scientist at NASA Goddard. “But it isn’t as simple as that. You can have a lot of other forces that affect the ice cover in the summer, like the strong storm we got last August.”
While winter sea ice has declined at a less drastic rate than summer ice, the fraction of ice cover that has survived at least two melt seasons—“multi-year ice”—remains much smaller than at the beginning of the satellite era. This older, thicker ice buttresses the ice cap against more severe melting. Measurements suggest multi-year ice grew slightly this past winter and now covers 1.03 million square miles (2.67 million square kilometers), or about 39,000 square miles more than last winter. Nonetheless, the multi-year ice extent is less than half of what it was in the early 1980s.
“I think the multi-year ice cover will continue to decline in the upcoming years,” Comiso said. “There’s a little bit of oscillation, so there still might be a small gain in some years. But it continues to go down and before you know it we’ll lose the multi-year ice altogether.”
NASA Earth Observatory images by Jesse Allen, using data from the Advanced Microwave Scanning Radiometer 2 (AMSR-2) sensor on the Global Change Observation Mission 1st-Water (GCOM-W1) satellite and the Scanning Multichannel Microwave Radiometer (SMMR) on the Nimbus-7 satellite. Caption by Maria-Jose Vinas, NASA Earth Science News Team, and Mike Carlowicz, Earth Observatory.