Once they are formed, volcanic craters can gradually fill with water. If the volcano remains active, such as Mt. Ruapehu Volcano on the North Island of New Zealand, the lake is a potential hazard. During an eruption or earthquake—or even as a result of snowmelt or heavy rain, the lake may produce a lahar—a torrent of water, rocks and earth. However, the lake can also provide warning signs of impending eruptions; rising water temperatures can be a sign that activity is increasing. Many volcanic lakes are located in remote areas where direct monitoring is challenging, but satellites can detect thermal changes in volcanic lakes anywhere in the world.
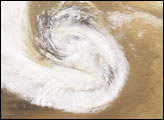
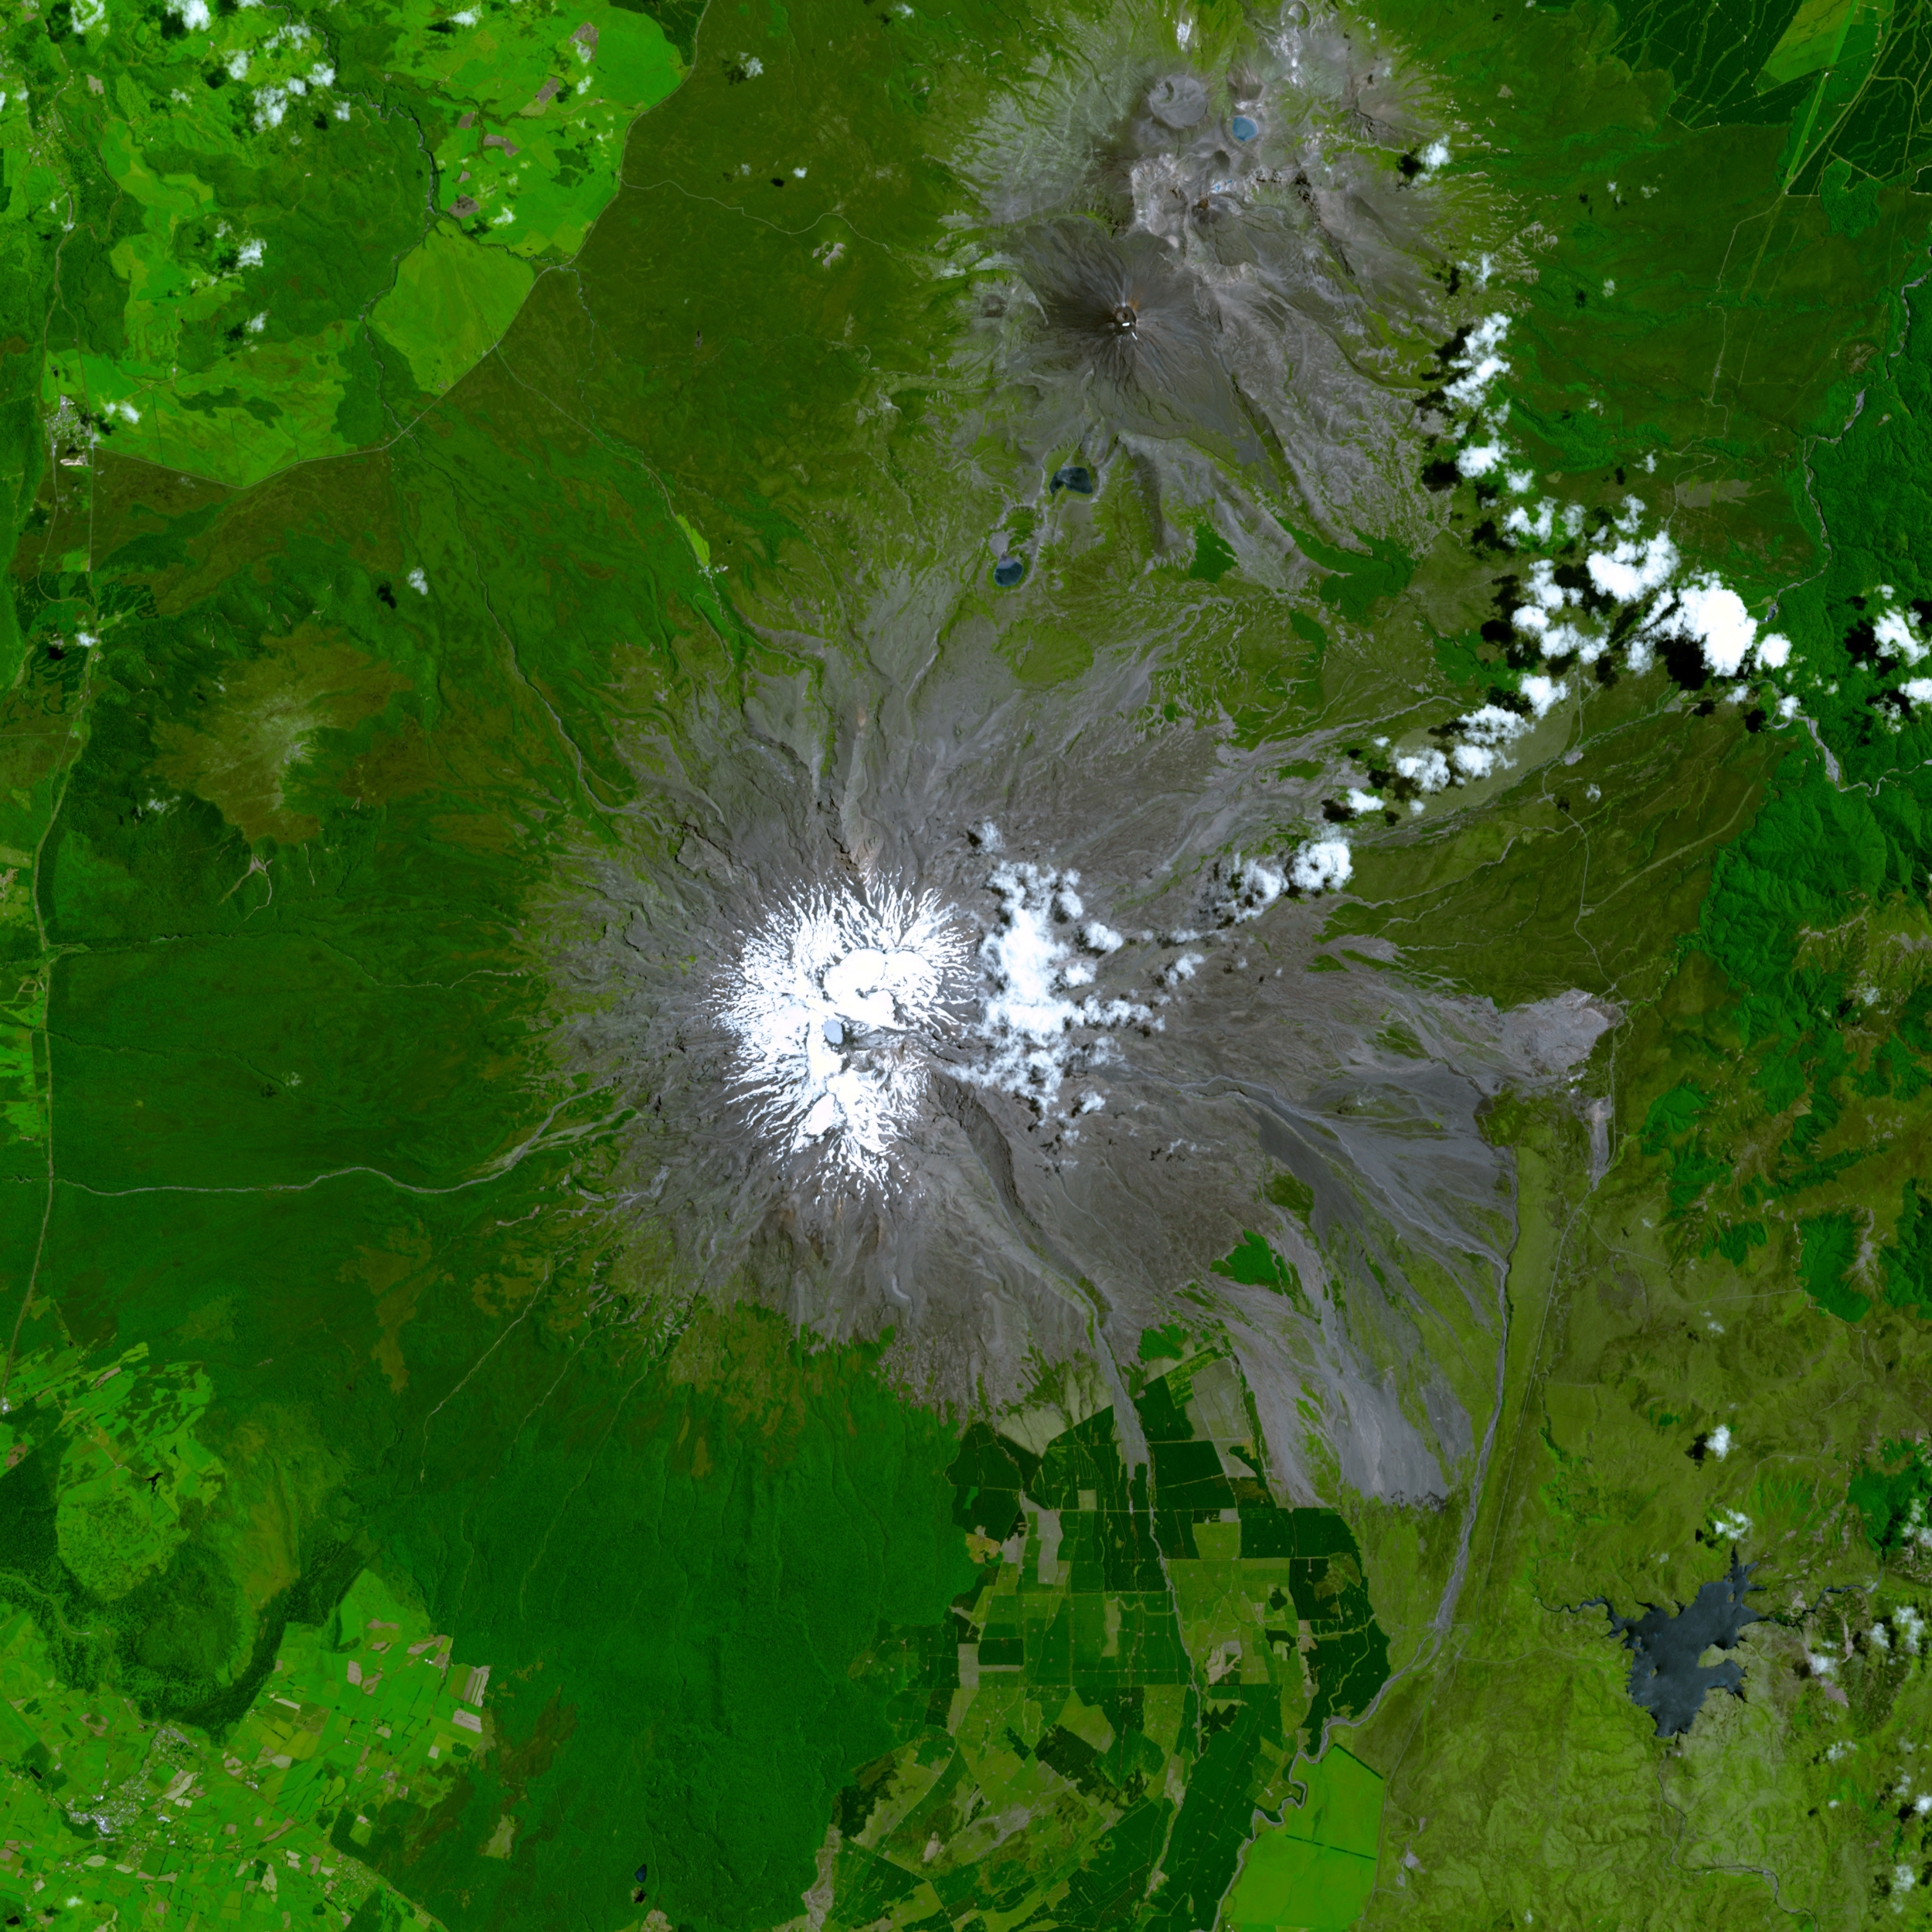
These images show Mount Ruapehu on the North Island of New Zealand and its summit lake, observed by the Advanced Spaceborne Thermal Emission and Reflection Radiometer (ASTER) on NASA’s Terra satellite. The top image is a simulated true-color image taken on January 12, 2001. In this image, vegetation appears green, bare rock appears gray-brown, snow appears white, clouds vary in color from white to pale blue, and the summit lake appears pale blue.
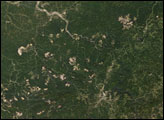
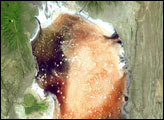
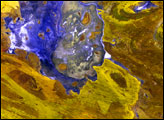
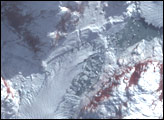
Besides observing some of the same wavelengths of light that human eyes can see, ASTER can also detect thermal infrared light invisible to our eyes. The three images along the bottom show ASTER’s observations in this portion of the light spectrum. The left image shows the summit on January 12, 2001, the same day as the top image. The middle and right images are from December 26, 2002, and January 16, 2005, respectively. In these thermal infrared images, blue indicates the coldest areas and pink-yellow indicates the warmest. Although warm compared to the rest of the summit, the volcanic lake is not consistently hot. It is relatively cool in the left and right images, with a pronounced warming in the middle image.
The relative spike in warmth in the summit lake matches temperature recordings in the graph. The graph of lake temperature demonstrates that satellite observations from ASTER are a good match for observations collected on the ground. Blue dots show peak temperatures measured in the summit lake based on thermal-infrared (TIR) data from ASTER. The yellow line and data points are based on observations collected by Dr. Bruce Christenson of the New Zealand Institute of Geological and Nuclear Sciences (IGNS). The green line and data points are from HazardWatch, an automated system that the IGNS set up to monitor the Ruapehu summit lake since 2001. The elevated temperature of the lake in the satellite image from December 26, 2002, closely matches a spike in temperature recorded on the ground in January 2003.
The analysis, led by Dr. Alain Bernard at the Université Libre de Bruxelles, demonstrates that satellite data can be a valuable resource for volcanic monitoring, particularly in remote areas where other types of warning information is sparse.
NASA image created by Jesse Allen, using data provided courtesy of NASA/GSFC/METI/ERSDAC/JAROS, and U.S./Japan ASTER Science Team. ASTER temperature analysis provided by Laura Trunk, University of Washington, based on data provided by NASA’s Jet Propulsion Laboratory. In-situ lake temperature data from the Institute of Geological & Nuclear Sciences (IGNS), provided by Alain Bernard, Université Libre de Bruxelles.