On May 5, 2012, a flash flood surged down the Seti River in Nepal, sweeping away people and buildings along the riverbanks. The same day, a seismic network half a world away detected a large landslide above the river’s headwaters. The landslide occurred on a ridge below the summit of 7,525-meter (24,688-foot)-tall Annapurna IV, one of the peaks of the Annapurna massif.
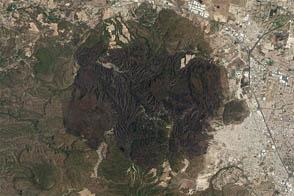
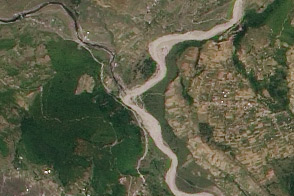
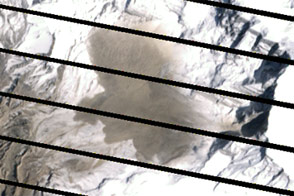
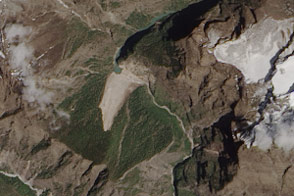
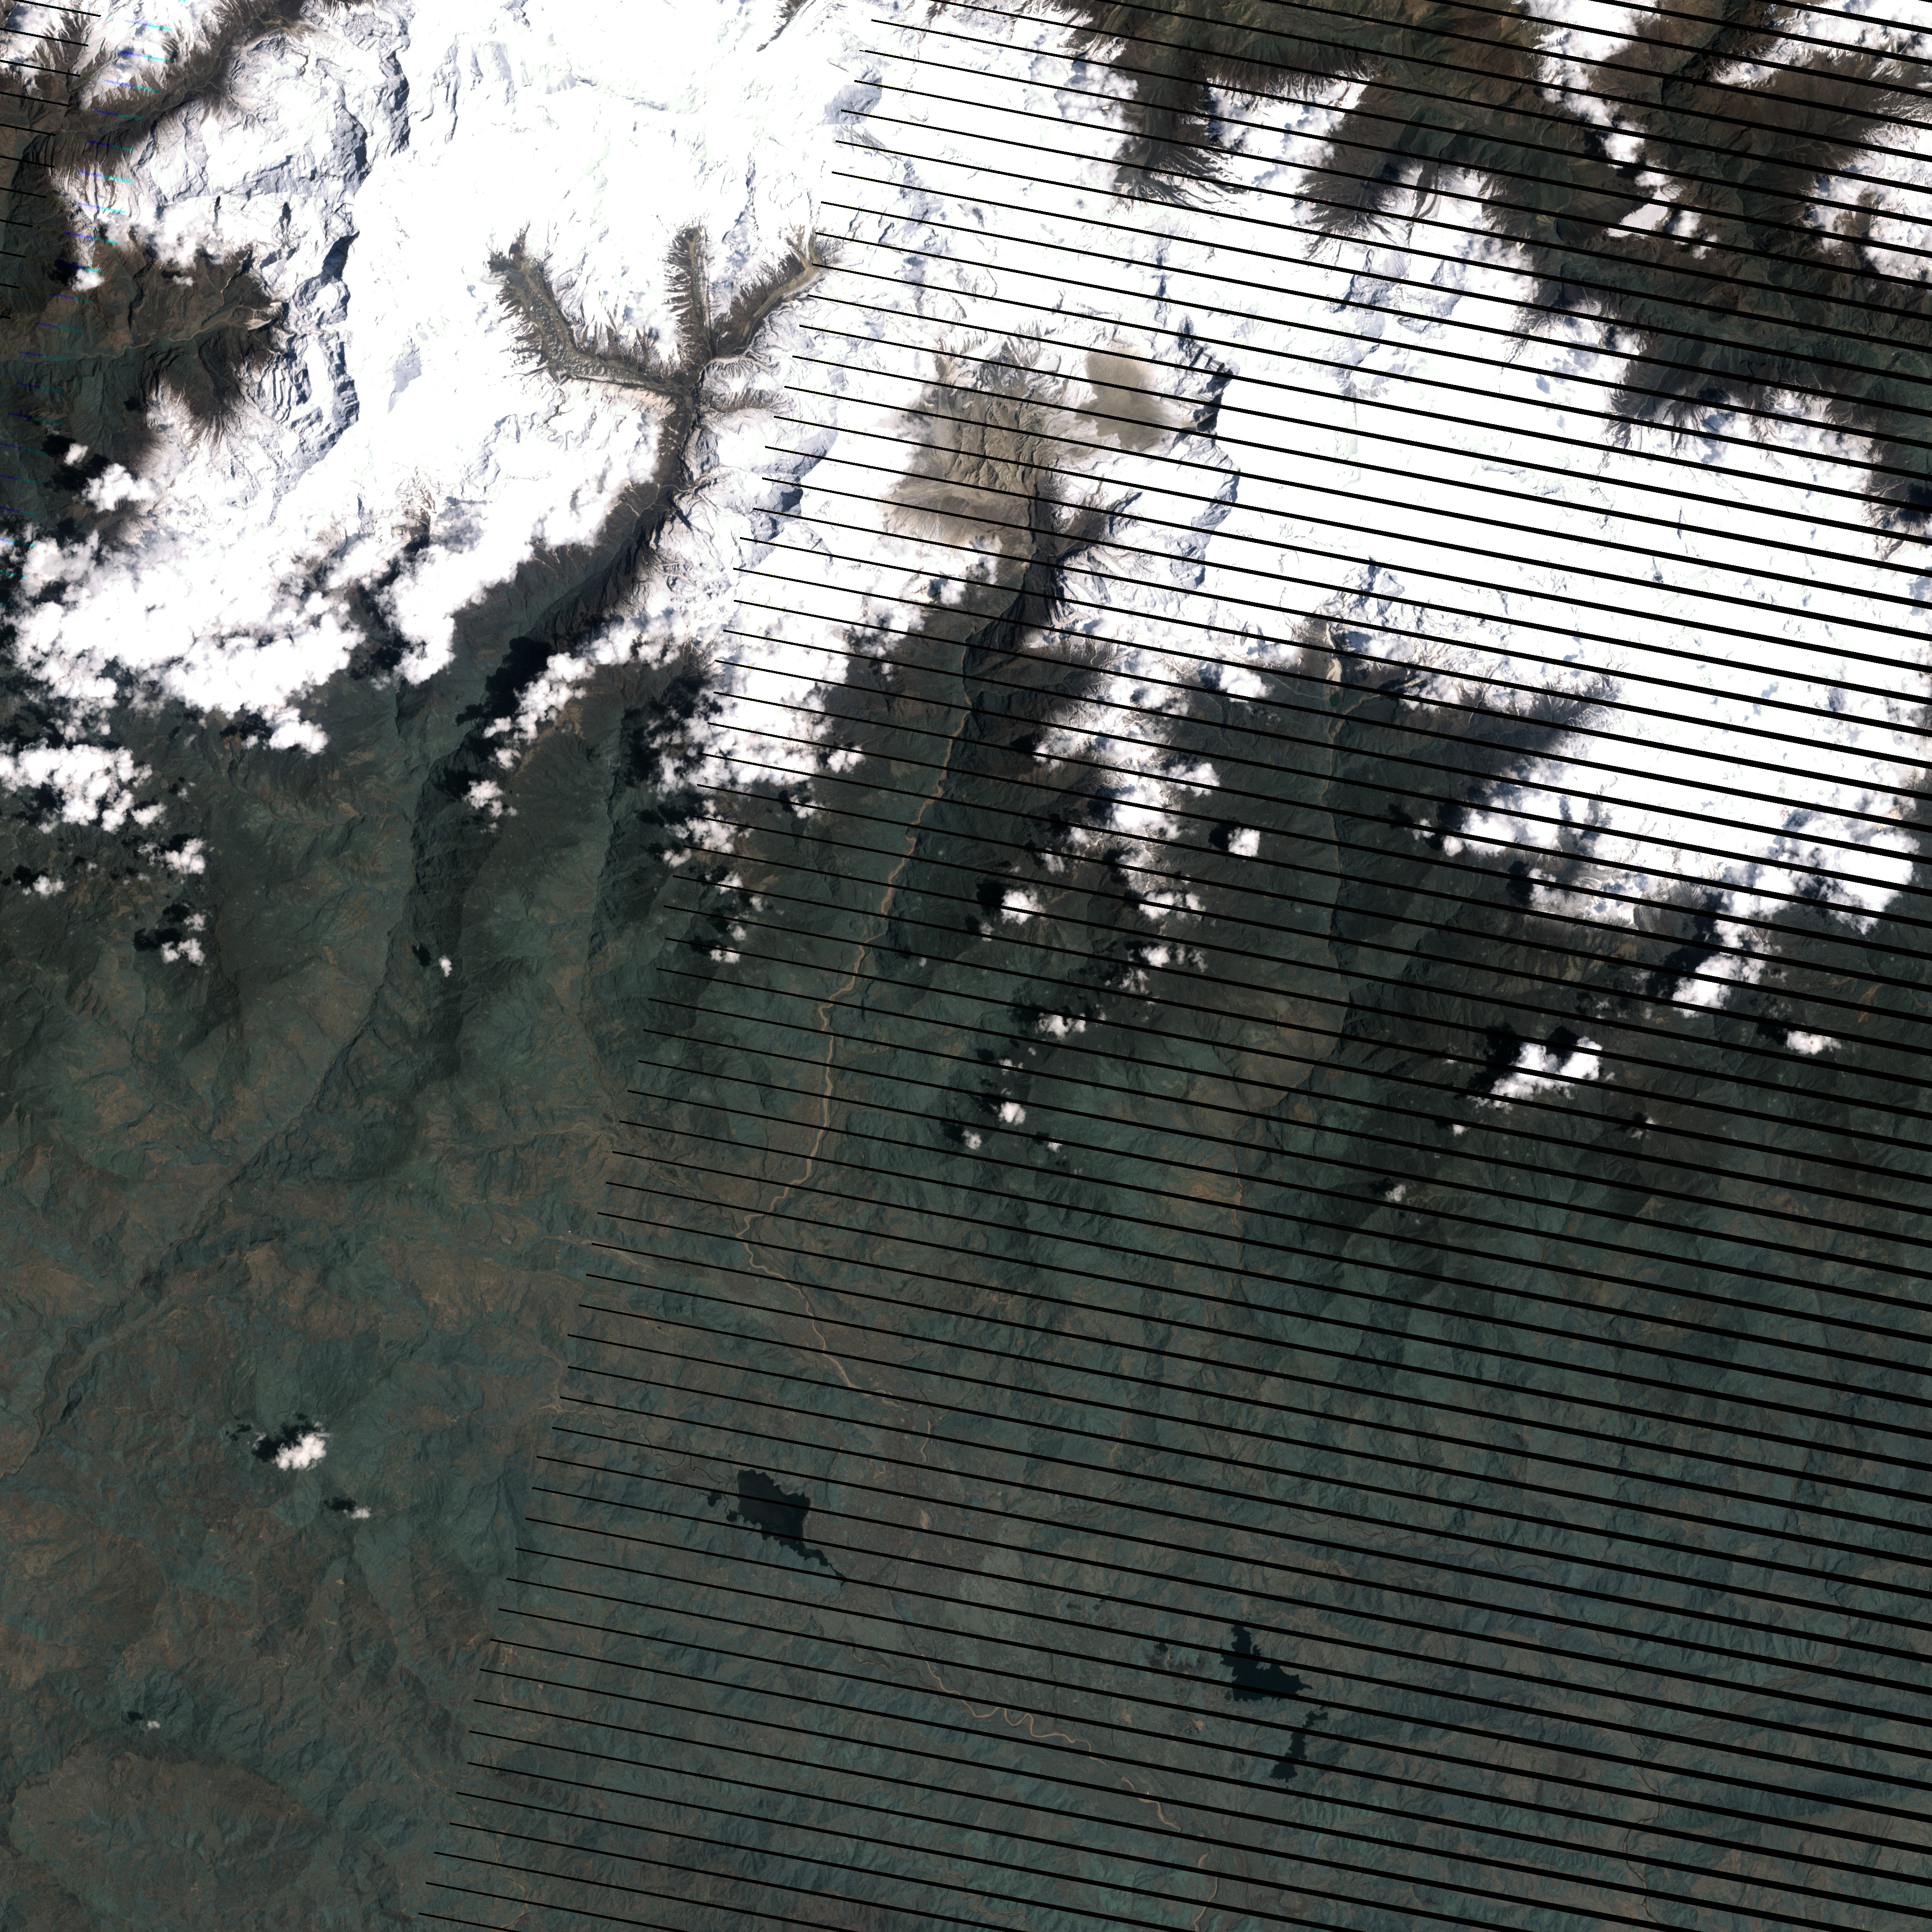
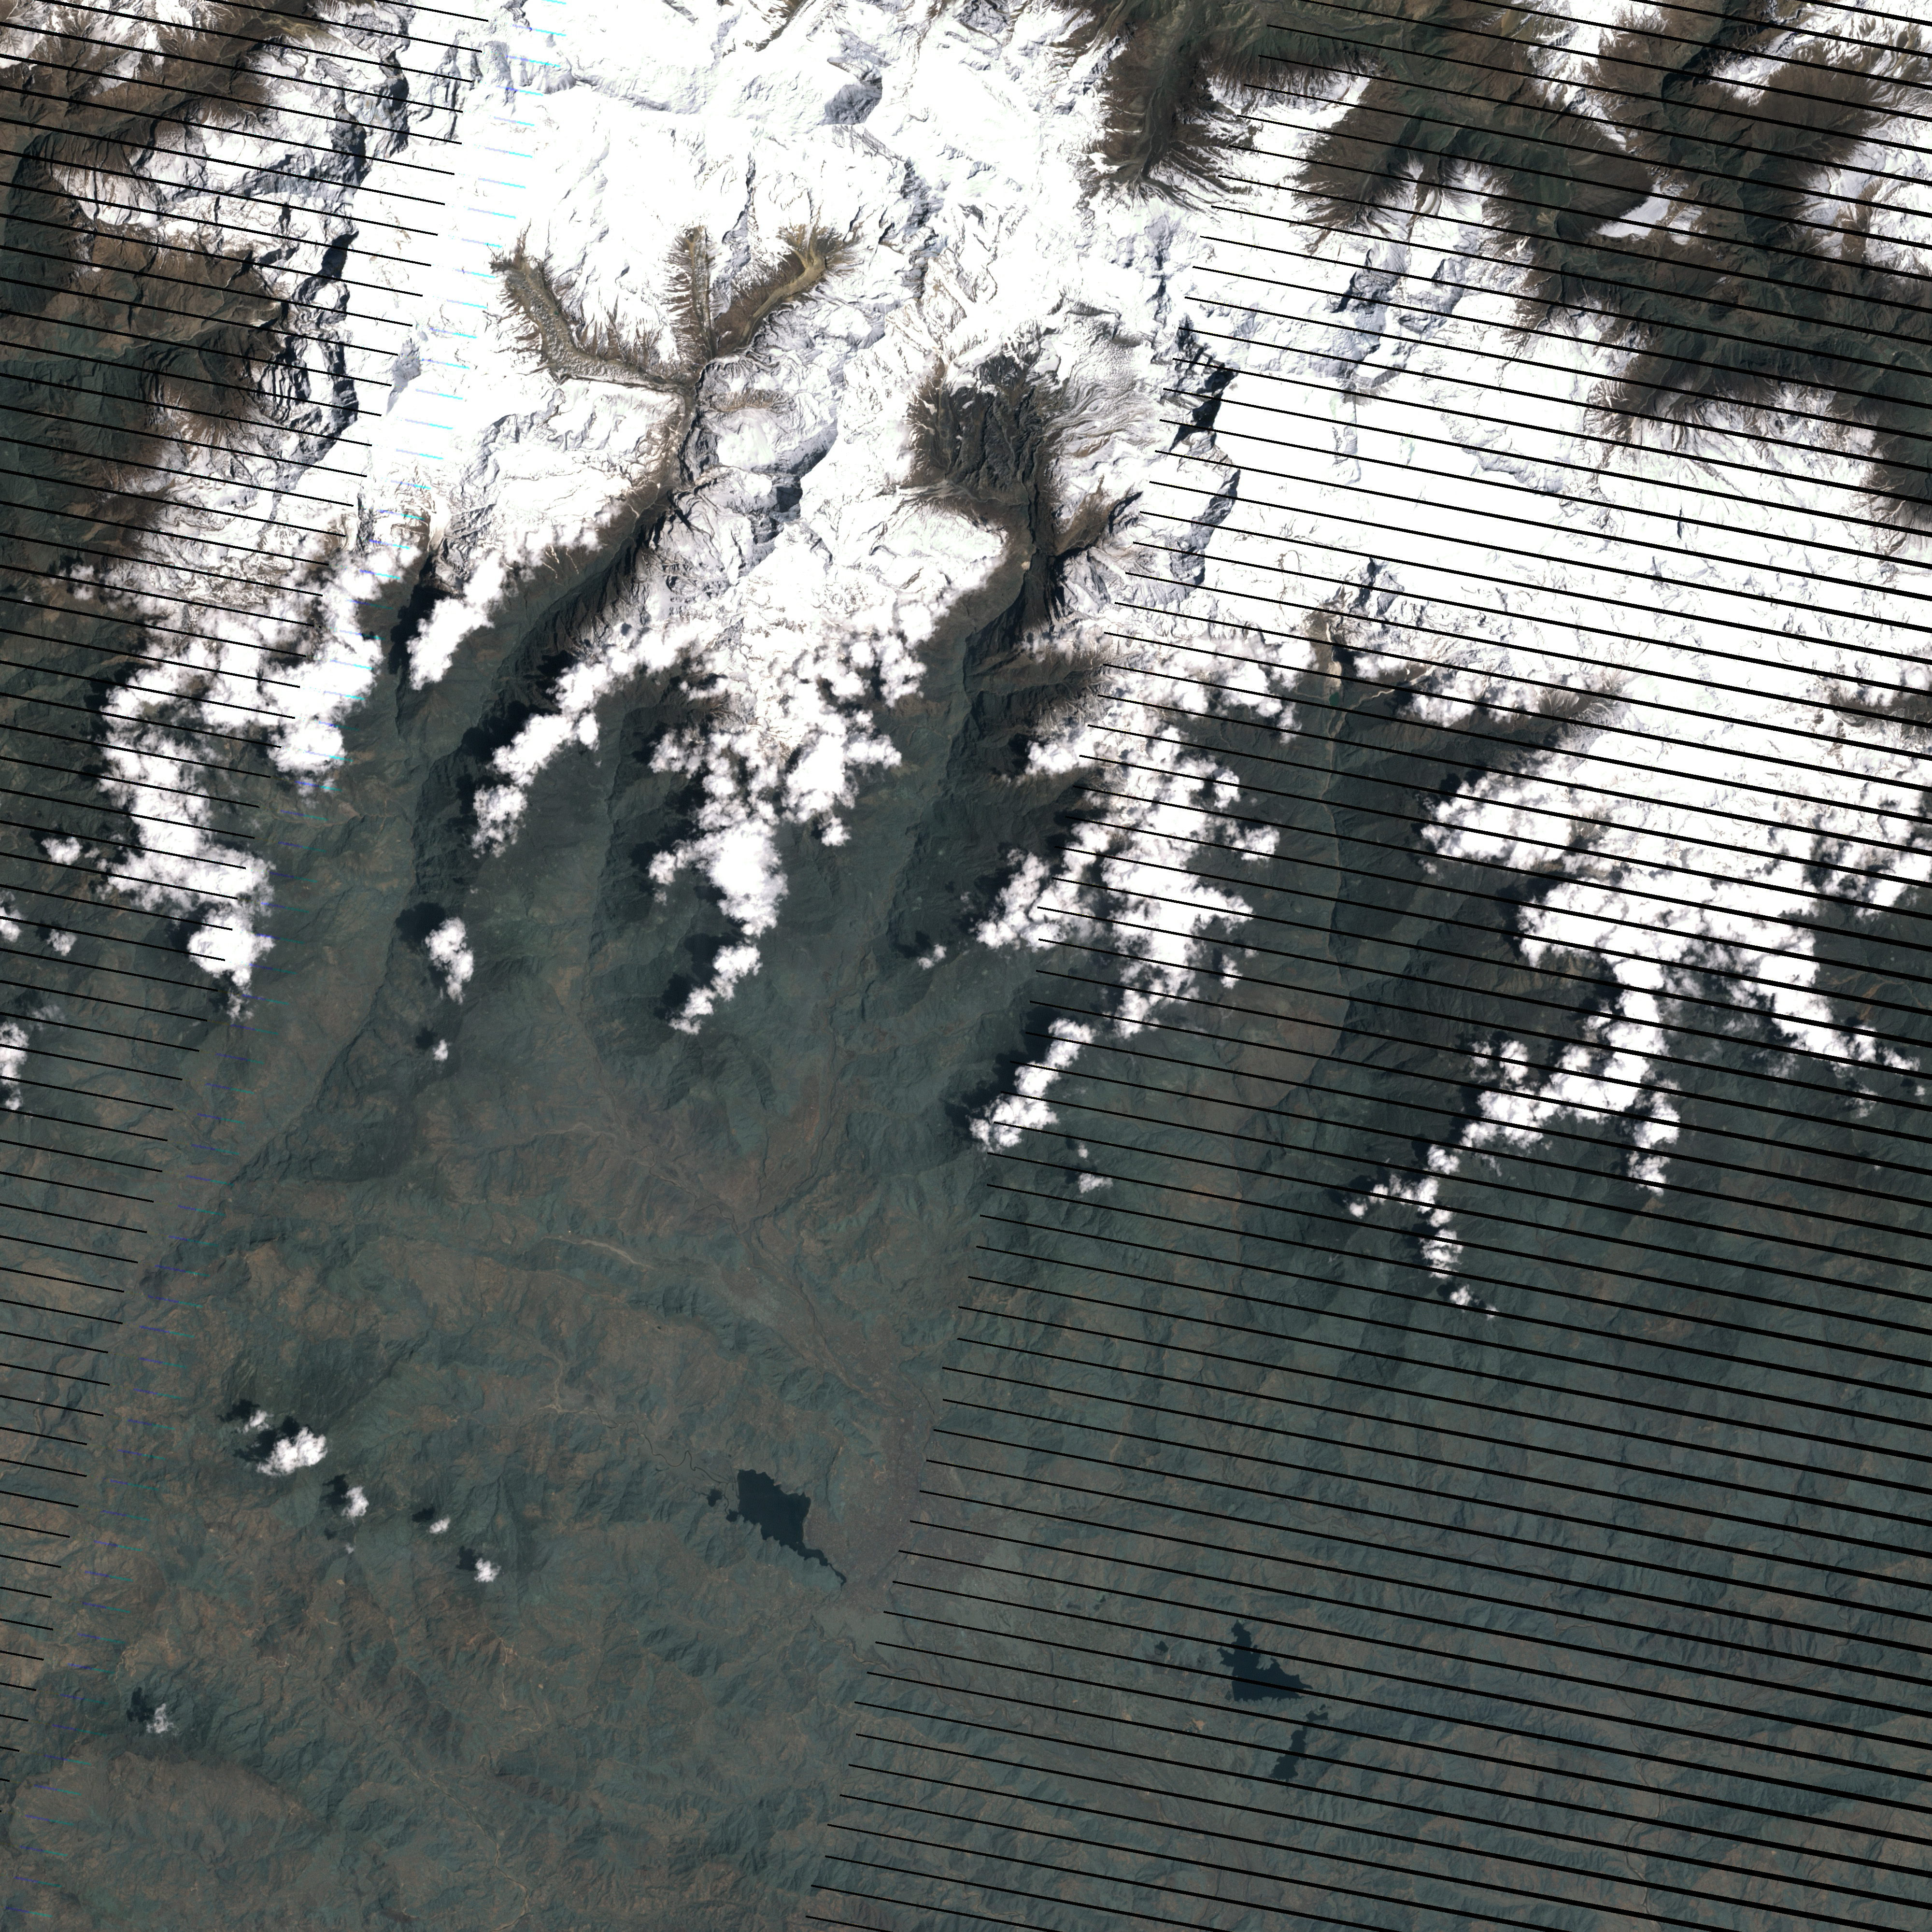
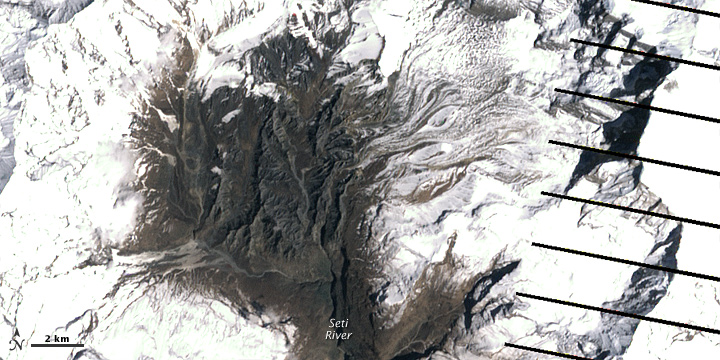
The Enhanced Thematic Mapper Plus (ETM+) on the Landsat 7 satellite observed the region before and after the landslide and flood. The top image shows the area on May 6, 2012, roughly 25 hours after the landslide. For comparison, the bottom image shows the same area on April 20. Both images are natural color. The diagonal lines are gaps in the data, resulting from a partial failure of the satellite.
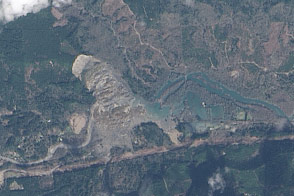
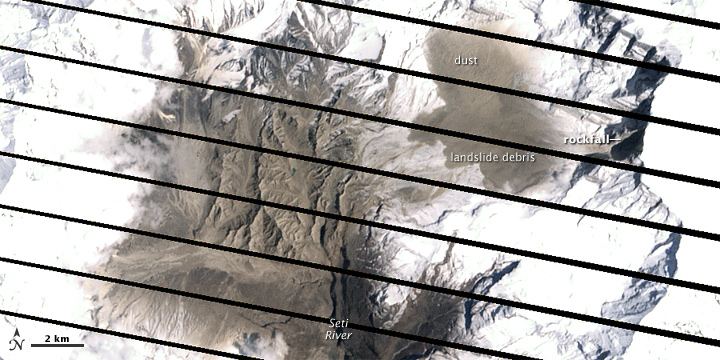
The Seti River channel begins in a largely snow-free valley, surrounded by steep, glacier-covered mountains. The clearest difference between the images is the wide swath of mud-colored debris east of the river channel. Landsat imagery contributed to mounting evidence of the natural disaster. The day after the flash flood, David Petley of the International Landslide Centre at Durham University posted a blog entry discussing a potential landslide.
Big landslides can generate small earthquakes, making those slides detectable to seismic networks like the one at Lamont-Doherty Earth Observatory (LDEO) at Columbia University. Colin Stark (based at LDEO) saw Petley’s blog post and suspected the event had generated a quake big enough for the network to detect. He was right. The seismometers could give the time of the event to within 15 seconds and the general location.
But to learn more about the landslide, Stark needed more advanced analysis. He contacted his colleague, Göran Ekström, also based at LDEO, and the two started to piece together the events of May 5. In the days after the disaster, they estimated the size of the landslide, the direction of the collapse, and the duration of the event. Images from Landsat helped them confirm their findings.
After looking at seismic data and satellite imagery, Stark, Ekström, and Petley offered a scenario of how the events might have unfolded: Roughly 22 million cubic meters (777 million cubic feet) of rock broke off the slope of Annapurna IV. When the rocky avalanche encountered more level land, it fragmented and became a rock avalanche. The initial rockslide, and other rockslides it prompted, produced a massive cloud of dust that drifted northward. The main rockslide shed some of its mass on the gently sloping ground, but some of the material continued moving, falling into the heads of several steep canyons.
The fact that the landslide and flood occurred in quick succession certainly suggested a link, but could the researchers be absolutely sure the two events were related? Early on, Petley wondered if the rock avalanche reached the river channel. Stark said: “There’s a drop of about 2,000 meters (7,000 feet) into the canyon, so we’re talking an enormous gain in momentum. Then I think the debris ran down the canyon at speeds upwards of 30 meters (100 feet) per second—a guess but what we see for the landslide itself. I think this debris flow overran the water flow. In other words, I think the water was largely already in the river channel and all that was needed was a massive, high-momentum debris flow to get it moving.”
In his May 23 blog post on the event, Petley elaborated, “At the moment, we can only speculate, but the most likely explanation is that a small proportion of the debris entered and then flowed down one or more of the steep gullies that descend to the main channel. It may well be that the flow traveled down several gullies at the same time.”
Some of the first news reports of the event suggested that the landslide formed a temporary dam on the Seti River, and water breaking through that dam caused the flash flood. But Stark estimated that events unfolded in a matter of minutes with no time for a temporary dam to form. As of late May 2012, Stark and Petley planned to continue examining the evidence to better understand the events in this remote region.
In addition to the satellite and seismic observations, a local pilot—who was flying a sightseeing tour over the region when the landslide occurred—has shared video of the dust cloud, which probably formed in a matter of minutes after the slide started. He also acquired aerial photos of the flood surge down the Seti River. His YouTube video shows flooding near the village of Pokhara, which was badly damaged. After the initial disaster, the BBC acquired video footage of a subsequent flood surge down the Seti River, where hazardous conditions continued.
NASA Earth Observatory image by Jesse Allen and Robert Simmon, using Landsat data from the U.S. Geological Survey. Image interpretation provided by Colin Stark (Columbia University) and David Petley (Durham University). Caption by Michon Scott.