

Between late January and early March 2002, the northern section of Antarctica’s Larsen B ice shelf shattered, setting thousands of icebergs adrift into the adjacent Weddell Sea. This breakup of 3,250 square kilometers of the shelf was likely caused by local climate warming, which has averaged about 0.5 degrees Celsius per decade since the 1940s.
Ice shelves are thick plates of glacier ice that has overrun the coastline and floats on the ocean. After the Larsen Ice Shelf disintegrated, scientists Ted Scambos and Jennifer Bohlander of the National Snow and Ice Data Center (NSIDC) in Boulder, Colorado, were among the scientists who studied the area intently to try to understand the dynamic processes in the ice shelves and how they respond to events of this kind.
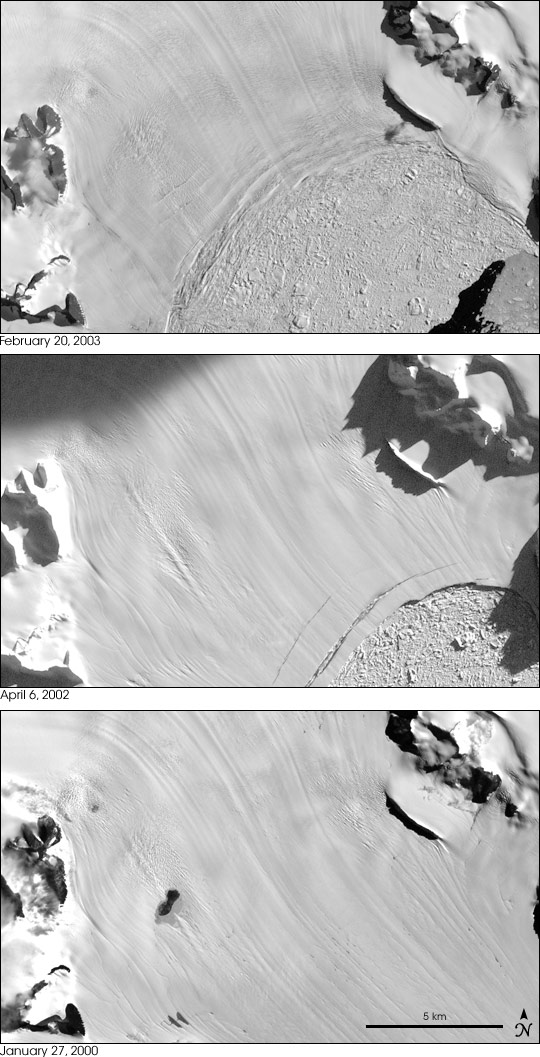
The Landsat images above show the Hektoria Glacier before the collapse (January 2000), just after the collapse (April 2002), and almost one year later (February 2003). By tracking the changes in the locations of surface features on the glaciers in Landsat satellite images before and after the collapse, the scientists discovered that the ice shelf had been providing a “braking mechanism” on the glaciers, creating back pressure that slowed the flow of ice onto the shelf. After the shelf’s breakup, the glaciers picked up speed.
Before the collapse, the flow of the Hektoria Glacier toward the ocean had been increasing by about 1 millimeter per day each day. In other words, if the flow rate was 1 millimeter per day on Monday, it was 2 millimeters per day on Tuesday. After the Larsen B broke up, the flow increased at a rate of about 14 millimeters per day each day near the shelf edge with lesser increases farther inland. This means that if it was moving at 1 millimeter per day on Monday, then on Tuesday it had sped up to 15 millimeters per day. Eric Rignot of NASA's Jet Propulsion Laboratory independently arrived at similar measures using interferometry from synthetic aperture radar data collected by the RADARSAT satellite.
In addition to looking at Landsat imagery, Scambos and Bohlander measured the thickness of the ice in the glacier before and after the event, using NASA's Ice, Cloud and land Elevation Satellite (ICESat). The more rapid acceleration of the glacier near the shelf edge compared to locations farther inland would cause the glacier to "stretch," and from the speed measurements, the scientists could predict the degree of thinning that would result. Their measurements of the thickness of the ice using ICESat data showed a 5- to 40-meter lowering of the surface between satellite passes separated by six months in 2003. These measurements are consistent with predictions based on the flow measurements by both Landsat and RADARSAT, giving the scientists a great deal of confidence in the results.
The imagery shown above was acquired by the Landsat 7 satellite with its Enhanced Thematic Mapper Plus (ETM+) instrument using the panchromatic band, which observes at high resolution across a broad section of the visible and near infrared spectrum.
Further details on the Larsen B ice shelf breakup and studies of the glaciers after the event are available from the NSIDC website.
Landsat imagery provided by Jennifer Bohlander, NSIDC.