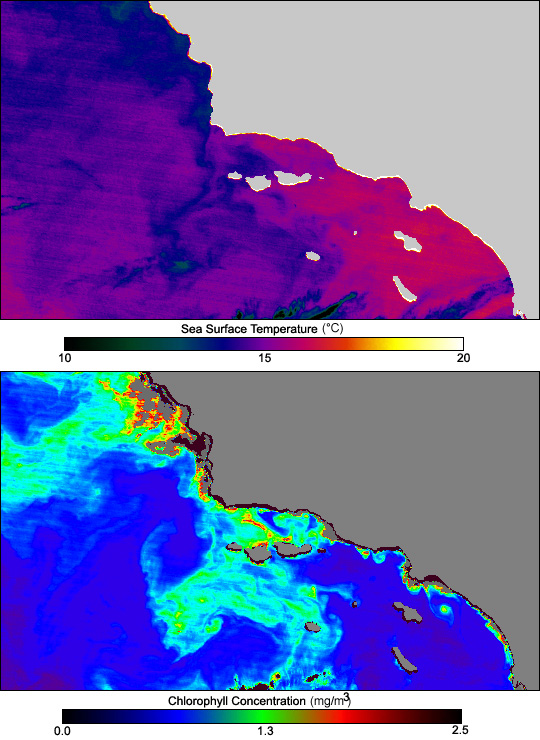


The two false-color images above show the relationship that is sometimes apparent between sea surface temperature and biological activity in the ocean. The top scene shows sea surface temperature around California’s Channel Islands, ranging from 10 - 20 degrees Celsius. The bottom scene shows concentrations of chlorophyll in the surface waters for the same region, ranging from zero to 2.5 milligrams per cubic meter. Both images were produced using data collected on February 3, 2003, by the Moderate Resolution Imaging Spectroradiometer (MODIS) aboard NASA’s Terra satellite. In these images, the land is colored gray and areas representing “no data” are black.
There is often a direct relationship between sea surface temperature and biological activity in the ocean. This relationship becomes evident just by comparing the patterns you see in both images. Warm surface waters typically block deeper, colder currents from rising to the surface. But where the surface waters are colder, the deep, nutrient-rich currents can “upwell” bringing nourishment needed to support life. Where nutrients (such as iron) are plentiful in the ocean, so too are blooms of the microscopic plants and animals that form the foundation of the marine food chain. Given ample nutrients, the tiny plants, known as phytoplankton, can quickly “bloom” into very dense populations producing colorful patterns on the ocean’s surface. Satellites help us observe this direct relationship between sea surface temperature and biological activity.
By measuring the color variations of the ocean, scientists can determine where concentrations of phytoplankton are floating at the sea’s surface. Like land-based plants, phytoplankton contain the pigment chlorophyll — used for photosynthesis — that gives them their greenish color. Chlorophyll absorbs red and blue wavelengths of light and reflects green light. From outer space, MODIS can distinguish even slight variations in ocean color that our eyes cannot detect. To MODIS, ocean water with high concentrations of chlorophyll will appear as blue-green or green, depending upon the type and density of the phytoplankton population there. This allows scientists to produce false-color maps showing where there are high and low concentrations of chlorophyll.
To learn more about the relationship between sea surface temperature and life in the ocean, check out the Channel Islands lesson.
ÿImage courtesy Jesse Allen, NASA Earth Observatory, using data provided by the MODIS Ocean Science Team, University of Miami